. 2025 Jan;100(1):52-65.
doi: 10.1002/ajh.27523. Epub 2024 Nov 18.

RAS signaling pathway is essential in regulating PIEZO1-mediated hepatic iron overload in dehydrated hereditary stomatocytosis

Affiliations

RAS signaling pathway is essential in regulating PIEZO1-mediated hepatic iron overload in dehydrated hereditary stomatocytosis

Barbara Eleni Rosato et al. Am J Hematol. 2025 Jan.

Abstract

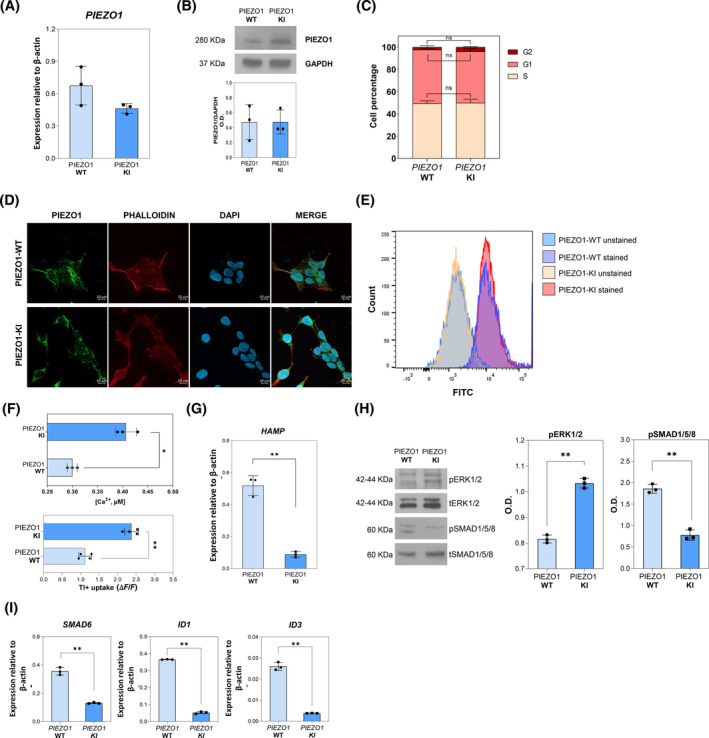
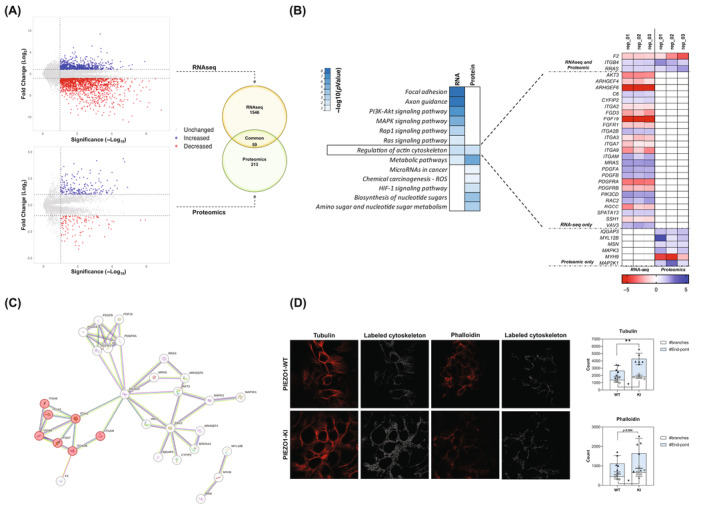
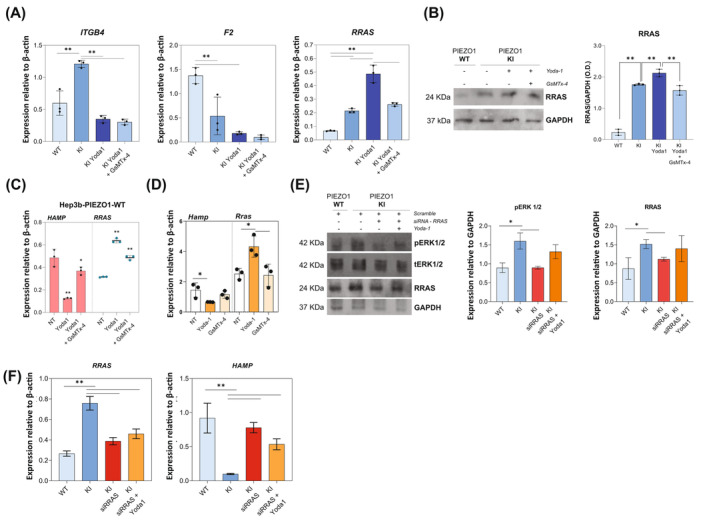
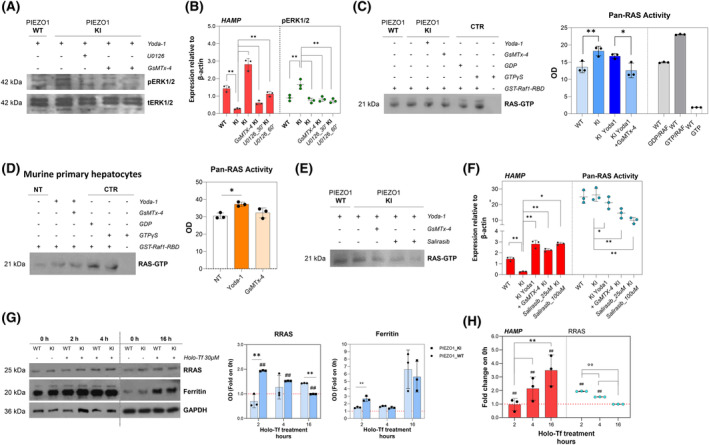
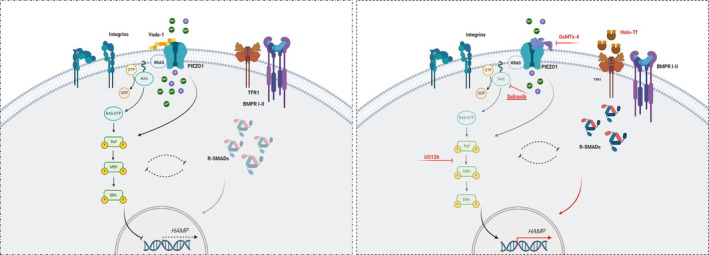
PIEZO1 encodes a mechanoreceptor, a cation channel activated by mechanical stimuli. Gain-of-function (GoF) variants in PIEZO1 cause dehydrated hereditary stomatocytosis (DHS), or xerocytosis, a pleiotropic syndrome characterized by anemia and iron overload. DHS patients develop hepatic iron overload independent of the degree of anemia and transfusion regimen. PIEZO1-GoF variants suppress hepcidin expression in both hepatic cellular model and constitutive/macrophage-specific Piezo1-GoF mice model. Therefore, PIEZO1-GoF variants regulate hepcidin expression by a crosstalk between hepatocytes (HCs) and macrophages with a still unknown mechanism. Transcriptomic and proteomics analysis in the human hepatic Hep3B cells engineered for the PIEZO1-R2456H variant (PIEZO1-KI) revealed alterations in the actin cytoskeleton regulation, MAPK cascade, and RAS signaling. These changes mainly occur through a novel key regulator, RRAS, whose protein and mRNA levels are regulated by PIEZO1 activation and inhibition. This regulation was further confirmed in C57BL/6 mouse primary HCs treated with Yoda-1 and/or GsMTx-4. Indeed, PIEZO1-KI cells exhibited hyper-activated RAS-GTPase activity that is rescued by PIEZO1 inhibition, restoring expression of the hepcidin gene HAMP. A negative correlation between RAS signaling and HAMP regulation was confirmed by inhibiting RAS-GTPase and MEK1-2 activity. Conversely, rescued HAMP gene expression requires downregulation of RRAS, confirming negative feedback between RAS-MAPK and BMP/SMADs pathways in HAMP regulation. We demonstrated that PIEZO1-GoF variants influence the actin cytoskeleton organization by activating the hepatic RAS signaling system. Understanding the role of RAS signaling in regulating iron metabolism could pave the way for new therapeutic strategies in DHS and other conditions characterized by iron overload.


Conflict of interest statement

The authors declare no competing interests.

Figures

FIGURE 1
FIGURE 1
Characterization of Hep3B cell line engineered for PIEZO1 R2456H variant (PIEZO1‐KI). (A) mRNA expression of PIEZO1, relative to β‐actin, in PIEZO1‐WT and PIEZO1‐KI cells. Data are means ± standard deviation (SD) of three independent experiments. (B) Representative immunoblot of PIEZO1 in Hep3B‐WT and PIEZO1‐KI cells. Lower panel: Quantification by densitometric analysis of three separate Western blots with similar results. Data are means ± SD of three independent experiments and are normalized on GAPDH. (C) Histograms showing the number of PIEZO1‐WT and PIEZO1‐KI cells on total events (%) in the G1, S, and G2 phases of the cell cycle. Data derived from three experiments are presented as mean ± SD. (D) Representative confocal imaging by ZEISS LSM 980 Airyscan 2 of PIEZO1‐WT and PIEZO1‐KI cells is shown. Rabbit anti‐PIEZO1 antibody was used to stain the PIEZO1 protein (green). Phalloidin was used as a cytoskeleton marker (red), and DAPI was used as a nuclear marker (blue). Overlapping of both signals (MERGE) is shown on the right (yellow). Scale bar 10 μm. (E) Representative histograms showing fluorescence intensity of PIEZO1 in Hep3b PIEZO1‐WT and PIEZO1‐KI cells stained or not (unstained) with PIEZO1‐Alexa Fluor 488. Data are mean ± SD of three independent acquisitions. Ten thousand events were acquired for each sample. (F) Upper panel: Quantification of total intracellular Ca2+ concentrations in Hep3B cells expressing PIEZO1‐WT and PIEZO1‐KI at steady state. Data are means ± SD of three experiments and are normalized on protein concentrations (*p < .05, PIEZO1‐KI vs. PIEZO1_WT, Student's t‐test). Lower panel: Quantification of Tl + uptake in PIEZO1‐WT and PIEZO1‐KI at steady state. ΔF/F is the difference between the mean of fluorescence (four replicates) and fluorescence at 0 time (**p < .01, PIEZO1‐KI vs. PIEZO1‐WT, Student's t‐test). (G) Quantification of HAMP gene expression normalized to β‐actin in PIEZO1‐WT and PIEZO1‐KI. Data are means ± SD of three independent experiments (**p < .01; Student's t‐test, PIEZO1‐WT vs. PIEZO1‐KI). (H) Representative immunoblotting of pERK1/2 and pSMAD1/5/8 and relative densitometric analysis (right panel) normalized to tERK1/2 and tSMAD1/5/8, in PIEZO1‐WT and PIEZO1‐KI cells. Data are means ± SD of three independent experiments (**p < .01; Student's t‐test, PIEZO1‐WT vs. PIEZO1‐KI). (I) SMAD6, ID1, and ID3 gene expression normalized to β‐actin in PIEZO1‐WT and PIEZO1‐KI. Data are means ± SD of three independent experiments (**p < .01; Student's t‐test, PIEZO1‐WT vs. PIEZO1‐KI). [Color figure can be viewed at wileyonlinelibrary.com]
FIGURE 2
FIGURE 2
Comparative transcriptomic and proteomic profiling of PIEZO1‐KI cells. (A) Left panel: Volcano plot representing the significantly upregulated (blue), significantly downregulated (red), and unchanged (gray) genes (upper) and protein (lower). Right panel: Venn diagram showing the number of significantly deregulated genes/proteins identified by RNAseq only (n = 1564) and Proteomics only (n = 213). Intersection represents the commonly deregulated genes/proteins (n = 59). (B) KEGG enrichment pathway analysis of deregulated genes and proteins in PIEZO1‐KI cells compared to PIEZO1‐WT. Enrichment is expressed as −log10 of pathway p value. Right panel: Expression heatmap for upregulated (blue) and downregulated (red) genes and protein (three replicates are shown) associated with the pathway named “Regulation of actin cytoskeleton.” The common genes/proteins are shown on the top; RNAseq‐only genes are shown in the middle, and protein‐only genes are shown on the bottom. Undetected expression is shown as a white square (N/D). (C) Interaction analysis (by STRING) of genes/proteins belonging to the “Regulation of actin cytoskeleton” pathway. Integrin cluster indicated as red circles. (D) Representative confocal imaging by ZEISS LSM 980 Airyscan 2 of PIEZO1‐WT and PIEZO1‐KI cells is shown. Tubulin and phalloidin were used as cytoskeleton markers (red). Right panel: Stress fibers were tagged and quantified with ImageJ software. Scale bar 10 μm. Histograms show the number of branches and end‐points in both PIEZO1‐WT and PIEZO1‐KI. Data are means ± standard deviation of six different acquisitions. *p < .05, **p < .01 by unpaired t‐test. [Color figure can be viewed at wileyonlinelibrary.com]
FIGURE 3
FIGURE 3
Crosstalk between RRAS deregulation and HAMP expression. (A) mRNA expression relative to β‐actin of ITGB4, F2, and RRAS, in PIEZO1‐WT and PIEZO1‐KI cells at steady state and PIEZO1‐KI treated with Yoda‐1 (15 μM for 60 min) or Yoda‐1 plus GsMTx‐4 (5 μM for 30 min) cells. (B) Left panel: Representative immunoblot of RRAS in PIEZO1‐WT and PIEZO1‐KI cells at steady state and PIEZO1‐KI treated with Yoda‐1 (15 μM for 60 min) or Yoda‐1 plus GsMTx‐4 (5 μM for 30 min) cells. Right panel: Quantification by densitometric analysis of three separate Western blots with similar results. Data are means ± standard deviation (SD) (**p < .01, ANOVA adjusted for Sidak's multiple comparisons test) and are normalized on GAPDH. (C) mRNA expression of HAMP (red histograms, left) and RRAS (blue scatter dot plot, right) in PIEZO1‐WT cells at steady state (NT) and treated with Yoda‐1 and GsMTx‐4. Data are means ± SD of three independent experiments. *p < .05, **p < .01 by ANOVA test and post hoc correction by Sidak's multiple comparison tests. (D) mRNA expression of Hamp and Rras in primary murine hepatocytes at steady state (NT), treated with Yoda‐1 (50 μM for 30 min) and Yoda‐1 plus GsMTx‐4 (30 μM for 30 min). Data are means ± SD of three independent experiments. *p < .05, by ANOVA test and post hoc correction by Sidak's multiple comparison tests. r‐value by Pearson correlation analysis of Hamp and Rras gene expression. (E) Left panel: Representative immunoblots of pERK1/2 and RRAS in total cells lysate of PIEZO1‐WT and PIEZO1‐KI cells treated with siRRAS and siRRAS + Yoda‐1 (15 μM for 60 min); tERK1/2 and GAPDH were used as loading control. Right panel: Histograms showing quantification by densitometric analysis of three separate western blots with similar results. Data are means ± SD (*p < .05, **p < .01, ANOVA test and post hoc correction by Sidak's multiple comparison tests). (F) Histograms showing HAMP and RRAS gene expression in PIEZO1‐WT and PIEZO1‐KI cells treated with siRRAS and siRRAS + Yoda‐1 (15 μM for 60 min). Data are means ± SD of three independent experiments (*p < .05, **p < .01, ANOVA test and post hoc correction by Sidak's multiple comparison tests). [Color figure can be viewed at wileyonlinelibrary.com]
FIGURE 4
FIGURE 4
RRAS is a key regulator of PIEZO1‐mediated HAMP gene regulation, modulating MAPK cascade and RAS‐mediated signaling. (A) Representative immunoblots of pERK1/2 in total cells lysate of PIEZO1‐WT and PIEZO1‐KI cells treated with Yoda‐1 (15 μM for 60 min), PIEZO1‐KI treated with Yoda‐1 plus GsMTx‐4 (5 μM for 30 min) and PIEZO1‐KI treated with U0126 for 30 and 60 min. tERK1/2 was used as the loading control. (B) Histograms showing HAMP gene expression in PIEZO1‐WT and PIEZO1‐KI treated with Yoda‐1 (15 μM for 60 min), PIEZO1‐KI treated with Yoda‐1 plus GsMTx‐4 (5 μM for 30 min), and PIEZO1‐KI treated with U0126 for 30 and 60 min. Scatter dot plot showing quantification by densitometric analysis of three separate western blots with similar results. Data are means ± standard deviation (SD) of three independent experiments (*p < .05, **p < .01, ANOVA test and post hoc correction by Sidak's multiple comparison tests). (C) Left panel: Representative immunoblots of RAS GTP proteins purified by affinity precipitation with the RAS binding domain (RBD) of RAF1 from total cell lysate of PIEZO1‐WT and PIEZO1‐KI cells at steady state and PIEZO1‐KI treated with Yoda‐1 (15 μM for 60 min) or Yoda‐1 plus GsMTx‐4 (5 μM for 30 min). Lanes 5 and 6 are the positive controls (cell lysate treated with GST‐Raf1‐RBD plus GDP or GTP); lane 7 is the negative control (without GST‐Raf1‐RBD). Right panel: Quantification by densitometric analysis of three separate western blots with similar results. Data are means ± SD (*p < .05, PIEZO1‐WT vs. PIEZO1‐KI; **p < .01, PIEZO1‐KI vs. PIEZO1‐KI + GsMTx‐4; ANOVA test and post hoc correction by Sidak's multiple comparison tests). (D) Left panel: Representative immunoblots of RAS GTP proteins purified by affinity precipitation with the RBD of RAF1 from total cell lysate of primary murine hepatocytes (HCs) treated with vehicle, Yoda‐1 (50 μM for 30 min) or Yoda‐1 plus GsMTx‐4 (30 μM for 30 min). Lanes 5 and 6 are the positive controls (cell lysate treated with GST‐Raf1‐RBD plus GDP or GTP); lane 7 is the negative control (without GST‐Raf1‐RBD). Right panel: Histograms showing quantification by densitometric analysis of three separate western blots with similar results. Data are means ± SD (*p < .05, hepatocytes + Yoda‐1 vs. hepatocytes vehicle‐treated by ANOVA test and post hoc correction by Sidak's multiple comparison tests). (E) Left panel: Representative immunoblots of RAS GTP proteins purified by affinity precipitation with the RBD of RAF1 from total cell lysate of PIEZO1‐WT and PIEZO1‐KI cells at steady state and PIEZO1‐KI treated with Yoda‐1, Yoda‐1 plus GsMTx‐4 or Salirasib 25 and 100 μM. Right panel: Histograms showing HAMP gene expression in PIEZO1‐WT and PIEZO1‐KI treated with Yoda‐1 (15 μM for 60 min), PIEZO1‐KI treated with Yoda‐1 plus GsMTx‐4 and PIEZO1‐KI treated with Salirasib 25 and 100 μM. Boxes showing quantification by densitometric analysis of three separate Western blots with similar results. Data are means ± SD of three independent experiments. (*p < .05, PIEZO1‐WT vs. PIEZO1‐KI; **p < .01, PIEZO1‐KI vs. PIEZO1‐KI + GsMTx‐4; ANOVA test and post hoc correction by Sidak's multiple comparison tests). (G) Left panel: Representative immunoblots of RRAS, and ferritin in total cells lysate of PIEZO1‐WT and PIEZO1‐KI cells treated with Holo‐transferrin (Holo‐Tf) (30 μM) for 0, 2, 4, or 16 h. GAPDH is the loading control. Right panel: Quantification by densitometric analysis of three separate Western blots with similar results. Data are means ± SD (*p < .05, **p < .01 PIEZO1‐WT vs. PIEZO1‐KI; ##p < .01 PIEZO1‐KI 2, 4, or 6 vs. PIEZO1‐KI NT [0 h]; ##p < .01 PIEZO1‐KI vs. PIEZO1‐WT. ANOVA test and post hoc correction by Sidak's multiple comparison tests). (H) Histograms showing HAMP gene expression normalized to β‐actin (red), and scatter dot plot showing quantification of and RRAS protein expression in PIEZO1‐KI cells treated with Holo‐Tf (30 μM) for 2, 4, or 16 h. Data are means ± SD of three independent experiments and are represented as fold on NT (##p < .01 vs. NT (0 h);°°p < .01, PIEZO1‐KI 2 h vs. PIEZO1‐KI 4 h, PIEZO1‐KI 4 h vs. PIEZO1‐KI 16 h ANOVA and PIEZO1‐KI 2 h vs. PIEZO1‐KI 16 h by ANOVA test and post hoc correction by Sidak's for multiple comparisons). OD, optical density. [Color figure can be viewed at wileyonlinelibrary.com]
FIGURE 5
FIGURE 5
Schematic representation of intracellular deregulation in PIEZO1‐KI model. Schematic models of the intracellular pathways' alteration leading to HAMP deregulation in PIEZO1‐KI hepatic cells here described. Left panel: PIEZO1 activation, due to GoF variants or Yoda‐1 treatment, induced an over‐activation of small GTPase and RAS‐mediated signaling that, in turn, activates MAPK cascade. In this condition, HAMP gene expression is suppressed also because of R‐SMAD downregulation. Right panel: The inhibition of the channel by GsMTx‐4 molecule, RAS‐inhibition and MEK activity inhibition are able to rescue HAMP gene expression to PIEZO1‐WT levels (in red). Finally, the HAMP gene over‐expression induced by Holo‐transferrin (Holo‐Tf) treatment inversely correlates with the protein expression of the small GTPase RRAS, suggesting negative feedback between RAS‐MAPK axis and BMP/SMAD pathway (black dotted lines). [Color figure can be viewed at wileyonlinelibrary.com]

References

    1. Andolfo I, Russo R, Gambale A, Iolascon A. New insights on hereditary erythrocyte membrane defects. Haematologica. 2016;101(11):1284‐1294. doi:10.3324/haematol.2016.142463 - DOI - PMC - PubMed
    1. Andolfo I, Russo R, Gambale A, Iolascon A. Hereditary stomatocytosis: an underdiagnosed condition. Am J Hematol. 2018;93(1):107‐121. doi:10.1002/ajh.24929 - DOI - PubMed
    1. Gallagher PG. Diagnosis and management of rare congenital nonimmune hemolytic disease. Hematology Am Soc Hematol Educ Program. 2015;2015:392‐399. doi:10.1182/asheducation-2015.1.392 - DOI - PubMed
    1. Andolfo I, Alper SL, De Franceschi L, et al. Multiple clinical forms of dehydrated hereditary stomatocytosis arise from mutations in PIEZO1. Blood. 2013;121(19):3925‐3935. doi:10.1182/blood-2013-02-482489 - DOI - PubMed
    1. Zarychanski R, Schulz VP, Houston BL, et al. Mutations in the mechanotransduction protein PIEZO1 are associated with hereditary xerocytosis. Blood. 2012;120(9):1908‐1915. doi:10.1182/blood-2012-04-422253 - DOI - PMC - PubMed

MeSH terms

Supplementary concepts

LinkOut - more resources