. 2024 Nov 18;16(1):134.
doi: 10.1186/s13073-024-01407-3.

Integrated single-cell analysis reveals distinct epigenetic-regulated cancer cell states and a heterogeneity-guided core signature in tamoxifen-resistant breast cancer

Affiliations

Integrated single-cell analysis reveals distinct epigenetic-regulated cancer cell states and a heterogeneity-guided core signature in tamoxifen-resistant breast cancer

Kun Fang et al. Genome Med. .

Abstract

Background: Inter- and intra-tumor heterogeneity is considered a significant factor contributing to the development of endocrine resistance in breast cancer. Recent advances in single-cell RNA sequencing (scRNA-seq) and single-cell ATAC sequencing (scATAC-seq) allow us to explore inter- and intra-tumor heterogeneity at single-cell resolution. However, such integrated single-cell analysis has not yet been demonstrated to characterize the transcriptome and chromatin accessibility in breast cancer endocrine resistance.

Methods: In this study, we conducted an integrated analysis combining scRNA-seq and scATAC-seq on more than 80,000 breast tissue cells from two normal tissues (NTs), three primary tumors (PTs), and three tamoxifen-treated recurrent tumors (RTs). A variety of cell types among breast tumor tissues were identified, PT- and RT-specific cancer cell states (CSs) were defined, and a heterogeneity-guided core signature (HCS) was derived through such integrated analysis. Functional experiments were performed to validate the oncogenic role of BMP7, a key gene within the core signature.

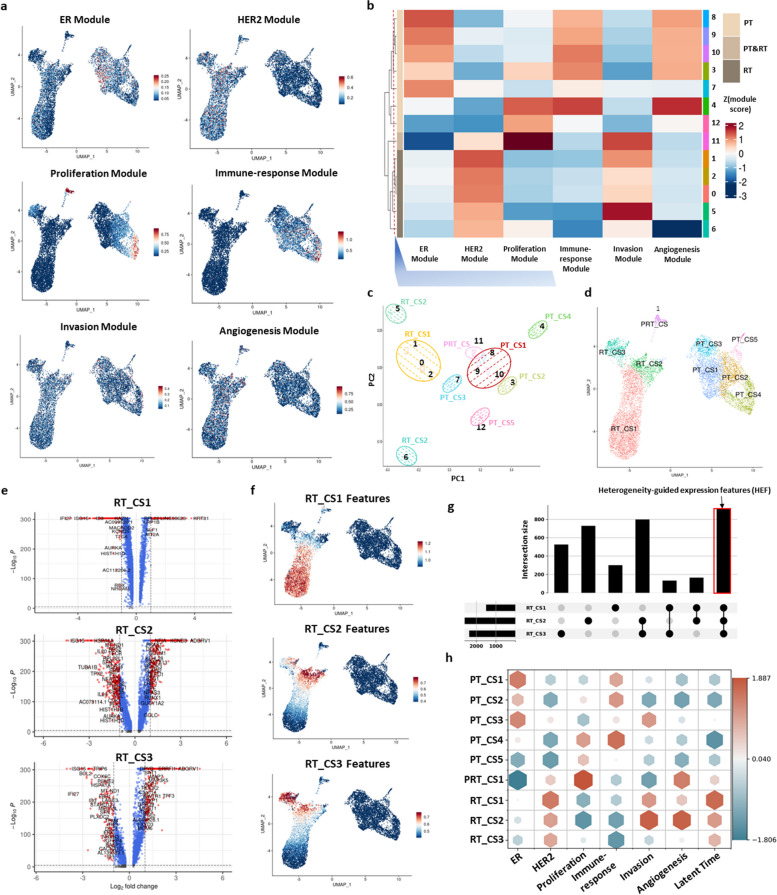
Results: We observed a striking level of cell-to-cell heterogeneity among six tumor tissues and delineated the primary to recurrent tumor progression, underscoring the significance of these single-cell level tumor cell clusters classified from scRNA-seq data. We defined nine CSs, including five PT-specific, three RT-specific, and one PT-RT-shared CSs, and identified distinct open chromatin regions of CSs, as well as a HCS of 137 genes. In addition, we predicted specific transcription factors (TFs) associated with the core signature and novel biological/metabolism pathways that mediate the communications between CSs and the tumor microenvironment (TME). We finally demonstrated that BMP7 plays an oncogenic role in tamoxifen-resistant breast cancer cells through modulating MAPK signaling pathways.

Conclusions: Our integrated single-cell analysis provides a comprehensive understanding of the tumor heterogeneity in tamoxifen resistance. We envision this integrated single-cell epigenomic and transcriptomic measure will become a powerful approach to unravel how epigenetic factors and the tumor microenvironment govern the development of tumor heterogeneity and to uncover potential therapeutic targets that circumvent heterogeneity-related failures.

Keywords: Breast tumor heterogeneity; Epigenetic-regulated cancer cell states; Single-cell analysis.


Conflict of interest statement

Declarations Ethics approval and consent to participate This study uses previously collected breast cancer patients’ pathological specimens, or diagnostic specimens from various biospecimen resources that have already been granted local Institutional Review Board (IRB) protocol approvals. All patients’ samples are de-identified but included with some basic clinical features. We will not have any keys that may link specific Health Insurance Portability and Accountability Act (HIPAA)-defined protected health information (PHI) to specific individuals. Medical College of Wisconsin has granted this study without an IRB; therefore, ethics approval was waived in this case. This study was conducted in accordance with the ethical principles outlined in the Declaration of Helsinki. Consent for publication Not applicable. Competing interests The authors declare no competing interests.

Figures

Fig. 1
Fig. 1
Distinct tumor cell characteristics among breast tumor tissues. a An overview of scRNA-seq and scATAC-seq profiling and analysis on a total of eight breast tissues including two NTs, three PTs, and three RTs. b An UMAP (left panel) showing 12 clusters identified from two NTs by 17 markers and a violin plot (right panel) showing the different expression pattern of 17 markers in the clusters. c An UMAP (left panel) showing 15 clusters identified from three PTs by 20 markers and a dot plot (right panel) showing the expression pattern of 20 markers in the clusters. d An UMAP (left panel) showing 13 clusters identified from three RTs by 20 markers and a dot plot (right panel) showing the expression pattern of 20 markers in the clusters. e An UMAP showing six cell types annotated for 12 clusters in two NTs (left panel), seven cell types annotated for 15 clusters in three PTs (middle panel), and five cell types annotated for 13 clusters in three RTs (right panel), respectively
Fig. 2
Fig. 2
Inter- and intra-tumor cell heterogeneity among breast tumor tissues. a A stacked bar plot showing the number of cells in each cell type in each of six TTs. b A cell-to-cell correlation matrix for single cells demonstrating low cell-to-cell correlations (Pearson’s r) between PTs and RTs (left). After separating tumor and non-tumor cells, cell-to-cell correlations were increased in PTs (right top) but unchanged in RTs (right bottom). Each row and column represent single cells. In the color panel on the far-right side, black represents tumor cells, and gray represents non-tumor cells. c Intra-sample correlations before (red boxes) and after (blue boxes) the removal of non-tumor cells. Each box shows the median and interquartile range (IQR 25th–75th percentiles), whiskers indicate the highest and the lowest value within 1.5 times the IQR, and outliers are marked as dots. d UMAPs showing 13 clusters (left) identified from tumor cells in six TTs and their annotation with tissue sample (right). e The stacked violin plots depicting the expression level of 15 known breast cancer-related genes in each cluster. f The proportional bar plot illustrating the ratio of tumor cells of six tumor tissues among 13 clusters. g The dimensional plots illustrating velocity confidence (coherence) of each cluster. h UMAPs of the latent time exhibiting the inferred transcriptional dynamics and tumor progression. i A PAGA graph showing the inferred directed abstracted representations of trajectories through a RNA velocity of tumor cells
Fig. 3
Fig. 3
Cancer cell states defined by breast cancer gene expression modules. a UMAPs visualizing the patterns of six breast cancer gene expression module scores. Six modules: ER signaling, HER2 signaling, proliferation, immune-response, invasion, and angiogenesis module. b A heatmap showing that K-mean hierarchical clustering identified nine cancer cell states based on six modules. c A PC plot illustrating the nine cancer cell states from b. Different colors representing different cell states. d A UMAP visualizing the nine cancer cell states. e Volcano plots depicting differentially expressed markers identified by comparing each RT_CS with all PT_CSs. f UMAPs visualizing the score of the expression features in each of three RT_CSs. g An upset plot presenting the intersection among expression features in three RT_CS. h A characterization of nine cancer cell states by distinct module scores and latent time
Fig. 4
Fig. 4
Epigenetic-regulated cancer cell states and a heterogeneity-guided core signature. a UMAPs illustrating an integration of the scRNA-seq and scATAC-seq data (left) and the geometric location of each of nine cancer cell states on co-embedded datasets (right). b The stacked bar plot displaying the number of peaks identified from scATAC-seq data across distal, proximal, promoter, and intergenic regions for each cancer cell state. c The upsetting plot presenting the number of UpAs in distal, proximal, and promoter regions that were common or specific among RT_CS1, RT_CS2, and RT_CS3. d A plot demonstrating the heterogeneity-guided core signature contains 137 genes resulted from incorporating both heterogeneity-guided expression and accessibility features. e A scatter plot showing the average log2 fold change of expression and accessibility as well as the co-accessibility score for 137 genes in HCS. f A bubble plot showing the top GO terms, KEGG/Wiki/REACTOME pathways for the core signature, respectively. g The top overrepresented TF motifs detected in 524 distal/proximal increased accessibility regions of 137 genes in HCS
Fig. 5
Fig. 5
Cell–cell communication between RT_CSs and non-tumor cells. a Number of ligand-receptor interactions among the three RT_CSs and four non-tumor cell types. b A bar plot showing the communication probability of all signaling pathways identified by CellChat for RT_CS1, RT_CS2, and RT_CS3 as source. c A bar plot showing the communication probability of all signaling pathways identified by CellChat for RT_CS1, RT_CS2, and RT_CS3 as target. d A circle network plot showing communication networks of three RT_CSs common signaling pathways, LAMININ, COLLEGAN, and FN1 and three RT_CSs specific signaling pathways, GRN, WNT, and EGF as source. The width of the edges indicates the communication probability. e A circle network plot showing communication networks of three RT_CSs common signaling pathways, BMP, EGF, and LAMININ and three RT_CSs specific signaling pathways, OCLN, PSAP, and CDH1 as target. The width of the edges indicates the communication probability. f A violin plot of the ligands and receptors involved in LAMININ signaling pathway. Purple color indicates the ligand and dark green color indicates the receptor. g A violin plot of the ligands and receptors involved in BMP signaling pathway. Purple color indicates the ligand and dark green color indicates the receptor
Fig. 6
Fig. 6
Resensitization of TR cells to 4-OHT treatment upon the silence of BMP7. a K-M plots showing the relapse-free survival probability of BMP7 in systemic untreated patients vs. Tam-treated patients. b Knockdown of BMP7 by siRNAs in MCF7TR and T47DTR cells. Cells were transfected with siRNA. Relative mRNA expression levels were quantified by the qRT-PCR method, using β-actin as an internal control. The data were represented by the mean ± SD. ***p ≤ 0.0005, **p ≤ 0.001, *p ≤ 0.05 vs. control. c Effect of BMP7 siRNAs on cell proliferation in MCF7TR and T47DTR cell lines. Cell proliferation was measured by CCK-8 assay after transfection with BMP7 siRNAs. The data were represented as mean ± SD. ***p ≤ 0.005, **p ≤ 0.05 vs. control. d Effect of BMP7 siRNAs on cell proliferation in MCF7TR and T47DTR cell line treated with 4-OHT. Cell proliferation was measured by CCK-8 assay after transfection with BMP7 siRNAs. The data were represented as mean ± SD. ***p ≤ 0.005, **p ≤ 0.05 vs. control
Fig. 7
Fig. 7
Modulation of p-MARK/MAPK upon the silence of BMP7. a Representative western blot of BMP7 and β-actin proteins from cells transfected with siRNAs (top panel); the expression levels of BMP7 protein in MCF7TR cells transfected with siRNAs (bottom panel). The expression level of each band was measured by densitometry and normalized to corresponding β-actin. Results were expressed in relation to the control. The data were represented by the mean ± SD. ***p ≤ 0.005, **p ≤ 0.05 vs. control. b Representative western blot of BMP7 and β-actin proteins from cells transfected with siRNAs (top panel); the expression levels of BMP7 protein in T47DTR cells transfected with siRNAs (bottom panel). The expression level of each band was measured by densitometry and normalized to corresponding β-actin. Results were expressed in relation to the control. The data were represented by the mean ± SD. ***p ≤ 0.005, **p ≤ 0.05 vs. control. c Representative western blot of MAPK and p-MAPK proteins from cells transfected with siRNAs (top panel); the expression levels of MAPK and p-MAPK in MCF7TR cells transfected with siRNAs (bottom panel). The expression level of each band was measured by densitometry and normalized to corresponding β-actin. Results were expressed in relation to the control. The data were represented by the mean ± SD. ***p ≤ 0.005, **p ≤ 0.05 vs. control. d Representative western blot of MAPK and p-MAPK proteins from cells transfected with siRNAs (top panel); the expression levels of MAPK and p-MAPK in T47DTR cells transfected with siRNAs (bottom panel). The expression level of each band was measured by densitometry and normalized to corresponding β-actin. Results were expressed in relation to the control. The data were represented by the mean ± SD. ***p ≤ 0.005, **p ≤ 0.05 vs. control

References

    1. Miller WR, Bartlett JM, Canney P, Verrill M. Hormonal therapy for postmenopausal breast cancer: the science of sequencing. Breast Cancer Res Treat. 2007;103:149–60. - PubMed
    1. Osborne CK. Tamoxifen in the treatment of breast cancer. N Engl J Med. 1998;339:1609–18. - PubMed
    1. Early Breast Cancer Trialists’ Collaborative G, Davies C, Godwin J, Gray R, Clarke M, Cutter D, Darby S, McGale P, Pan HC, Taylor C, et al. Relevance of breast cancer hormone receptors and other factors to the efficacy of adjuvant tamoxifen: patient-level meta-analysis of randomised trials. Lancet. 2011;378:771–84. - PMC - PubMed
    1. Clarke R, Liu MC, Bouker KB, Gu Z, Lee RY, Zhu Y, Skaar TC, Gomez B, O’Brien K, Wang Y, Hilakivi-Clarke LA. Antiestrogen resistance in breast cancer and the role of estrogen receptor signaling. Oncogene. 2003;22:7316–39. - PubMed
    1. Musgrove EA, Sutherland RL. Biological determinants of endocrine resistance in breast cancer. Nat Rev Cancer. 2009;9:631–43. - PubMed

MeSH terms

Substances