

Optical sensor for fast and accurate lung cancer detection with tissue autofluorescence and diffuse reflectance spectroscopy
- PMID: 39558507
- PMCID: PMC11729394
- DOI: 10.1111/1759-7714.15476
Optical sensor for fast and accurate lung cancer detection with tissue autofluorescence and diffuse reflectance spectroscopy
Abstract
Background: Cancer is a severe threat to human health, and surgery is a major method of cancer treatment. This study aimed to develop an optical sensor for fast cancer tissue.
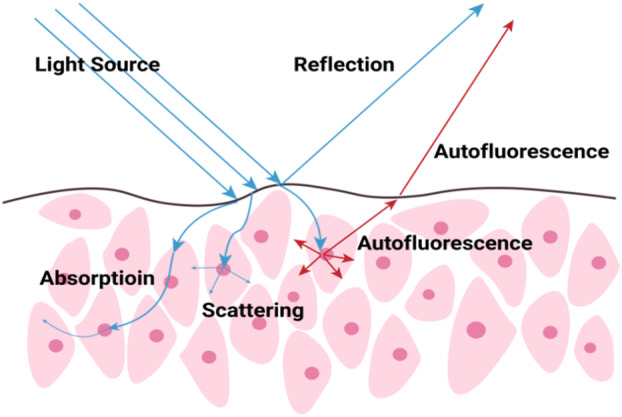
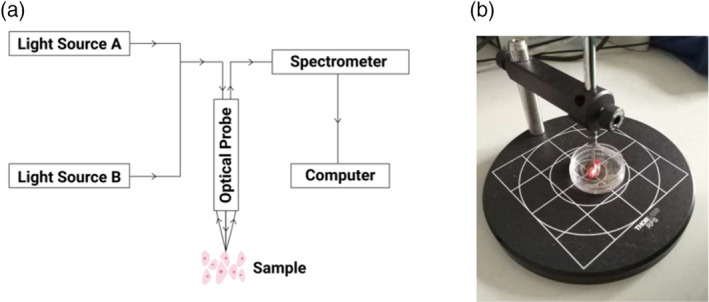
Methods: The tissue autofluorescence spectrum and diffuse reflectance spectrum were obtained by using a laboratory-developed optical sensor system. A total of 151 lung tissue samples were used in this ex vivo study.
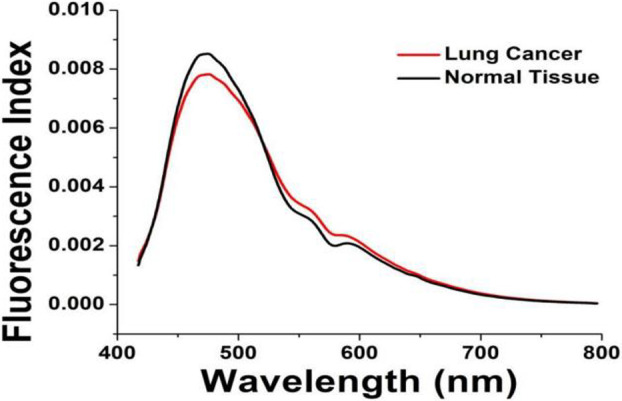
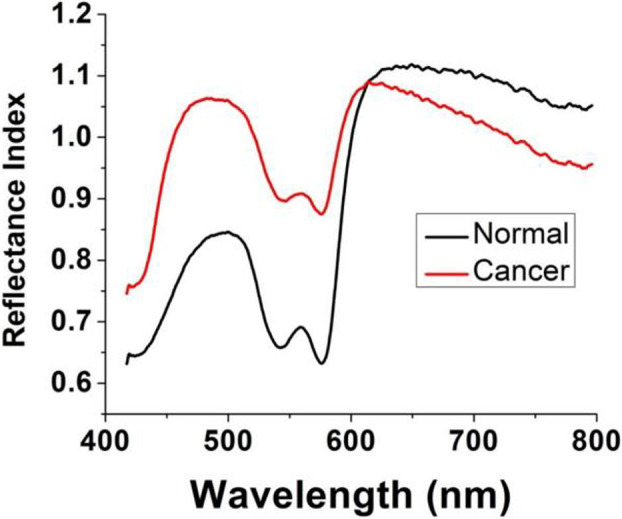
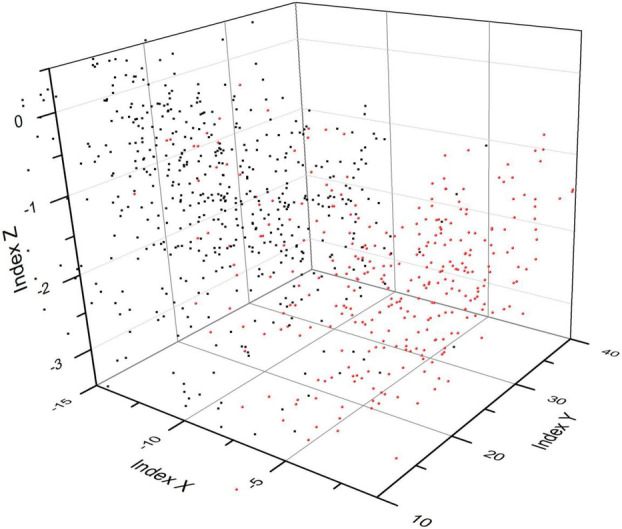
Results: Experimental results demonstrate that tissue autofluorescence spectroscopy with a 365-nm excitation has better performance than diffuse reflectance spectroscopy, and 63 of 64 test samples (98.4% accuracy) were correctly classified with tissue autofluorescence spectroscopy and our developed data analysis method.
Conclusions: Our promising ex vivo study results show that the developed optical sensor system has great promise for future clinical translation for intraoperative lung cancer detection and other applications.
Keywords: artificial intelligence; diagnosis; lung cancer; optical sensor.
© 2024 The Author(s). Thoracic Cancer published by John Wiley & Sons Australia, Ltd.
Conflict of interest statement
The authors declare no conflicts of interest.
Figures
Similar articles
-
Early prediction of skin viability using visible diffuse reflectance spectroscopy and autofluorescence spectroscopy.Plast Reconstr Surg. 2014 Aug;134(2):240e-247e. doi: 10.1097/PRS.0000000000000399. Plast Reconstr Surg. 2014. PMID: 25068346
-
Highly Accurate Detection of Cancer In Situ with Intraoperative, Label-Free, Multimodal Optical Spectroscopy.Cancer Res. 2017 Jul 15;77(14):3942-3950. doi: 10.1158/0008-5472.CAN-17-0668. Epub 2017 Jun 28. Cancer Res. 2017. PMID: 28659435
-
In vivo assessment of bladder cancer with diffuse reflectance and fluorescence spectroscopy: A comparative study.Lasers Surg Med. 2024 Jul;56(5):496-507. doi: 10.1002/lsm.23788. Epub 2024 Apr 22. Lasers Surg Med. 2024. PMID: 38650443
-
Optical spectroscopy: current advances and future applications in cancer diagnostics and therapy.Future Oncol. 2012 Mar;8(3):307-20. doi: 10.2217/fon.12.15. Future Oncol. 2012. PMID: 22409466 Review.
-
[Fluorescence spectroscopy and imaging for optical biopsy].Guang Pu Xue Yu Guang Pu Fen Xi. 2005 Jul;25(7):1083-7. Guang Pu Xue Yu Guang Pu Fen Xi. 2005. PMID: 16241061 Review. Chinese.
References
-
- Allemani C, Matsuda T, Di Carlo V, Harewood R, Matz M, Nikšić M, et al. Global surveillance of trends in cancer survival 2000‐14 (CONCORD‐3): analysis of individual records for 37 513 025 patients diagnosed with one of 18 cancers from 322 population‐based registries in 71 countries. Lancet. 2018;391(10125):1023–1075. - PMC - PubMed
-
- Bray F, Ferlay J, Soerjomataram I, Siegel RL, Torre LA, Jemal A. Global cancer statistics 2018: GLOBOCAN estimates of incidence and mortality worldwide for 36 cancers in 185 countries. CA‐Cancer J Clin. 2018;68(6):394–424. - PubMed
-
- Chen W, Zheng R, Baade PD, Zhang S, Zeng H, Bray F, et al. Cancer statistics in China, 2015. CA‐Cancer J Clin. 2016;66(2):115–132. - PubMed
-
- Wakeam E, Acuna SA, Leighl NB, Giuliani ME, Finlayson S, Varghese TK, et al. Surgery versus chemotherapy and radiotherapy for early and locally advanced small cell lung cancer: a propensity‐matched analysis of survival. Lung Cancer. 2017;109:78–88. - PubMed
MeSH terms
Grants and funding
LinkOut - more resources
Full Text Sources
Medical
