Integrating real-world data and machine learning: A framework to assess covariate importance in real-world use of alternative intravenous dosing regimens for atezolizumab
- PMID: 39558509
- PMCID: PMC11573720
- DOI: 10.1111/cts.70077
Integrating real-world data and machine learning: A framework to assess covariate importance in real-world use of alternative intravenous dosing regimens for atezolizumab
Abstract
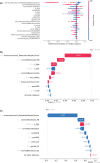
The increase in the availability of real-world data (RWD), in combination with advances in machine learning (ML) methods, provides a unique opportunity for the integration of the two to explore complex clinical pharmacology questions. Here we present a recently developed RWD/ML framework that utilizes ML algorithms to understand the influence and importance of various covariates on the use of a given dose and schedule for drugs that have multiple approved dosing regimens. To demonstrate the application of this framework, we present atezolizumab as a use case on account of its three approved alternative intravenous (IV) dosing regimens. As expected, the real-world use of atezolizumab has generally been increasing since 2016 for the 1200 mg every 3 weeks regimen and since 2019 for the 1680 mg every 4 weeks regimen. Out of the ML algorithms evaluated, XGBoost performed the best, as measured by the area under the precision-recall curve, with an emphasis on the under-sampled class given the imbalance in the data. The importance of features was measured by Shapley Additive exPlanations (SHAP) values and showed metastatic breast cancer and use of protein-bound paclitaxel as the most correlated with the use of 840 mg every 2 weeks. Although patient usage data for alternative IV dosing regimens are still maturing, these analyses provide initial insights on the use of atezolizumab and set up a framework for the re-analysis of atezolizumab (at a future data cut) as well as application to other molecules with approved alternative dosing regimens.
© 2024 Genentech, Inc. Clinical and Translational Science published by Wiley Periodicals LLC on behalf of American Society for Clinical Pharmacology and Therapeutics.
Conflict of interest statement
All authors are employees and stockholders of Roche/Genentech, Inc.
Figures


Similar articles
-
Alternative dosing regimens for atezolizumab: an example of model-informed drug development in the postmarketing setting.Cancer Chemother Pharmacol. 2019 Dec;84(6):1257-1267. doi: 10.1007/s00280-019-03954-8. Epub 2019 Sep 21. Cancer Chemother Pharmacol. 2019. PMID: 31542806 Free PMC article.
-
Model-based simulation to support the extended dosing regimens of atezolizumab.Eur J Clin Pharmacol. 2021 Jan;77(1):87-93. doi: 10.1007/s00228-020-02980-3. Epub 2020 Aug 17. Eur J Clin Pharmacol. 2021. PMID: 32808071
-
Extension of the Alternative Intravenous Dosing Regimens of Atezolizumab into Combination Settings through Modeling and Simulation.J Clin Pharmacol. 2022 Nov;62(11):1393-1402. doi: 10.1002/jcph.2074. Epub 2022 Jun 11. J Clin Pharmacol. 2022. PMID: 35576521
-
Administration of cetuximab every 2 weeks in the treatment of metastatic colorectal cancer: an effective, more convenient alternative to weekly administration?Oncologist. 2008 Feb;13(2):113-9. doi: 10.1634/theoncologist.2007-0201. Oncologist. 2008. PMID: 18305055 Review.
-
Trastuzumab for patients with HER2 positive breast cancer: delivery, duration and combination therapies.Breast. 2013 Aug;22 Suppl 2:S152-5. doi: 10.1016/j.breast.2013.07.029. Breast. 2013. PMID: 24074778 Review.
References
-
- McCafferty J, Grover K, Li L, et al. A systematic analysis of off‐label drug use in real‐world data (RWD) across more than 145,000 cancer patients. J Clin Oncol. 2019;37(15_suppl):e18031. doi:10.1200/JCO.2019.37.15_suppl.e18031 - DOI
-
- Uncovering the patient journey: Four ways that real‐world data offers value. STAT. Published September 11, 2023. Accessed June 5, 2024. https://www.statnews.com/sponsor/2023/09/05/uncovering‐the‐patient‐journ...
MeSH terms
Substances
LinkOut - more resources
Full Text Sources
Research Materials

