

Dynamic modelling of signalling pathways when ordinary differential equations are not feasible
- PMID: 39558579
- PMCID: PMC11629707
- DOI: 10.1093/bioinformatics/btae683
Dynamic modelling of signalling pathways when ordinary differential equations are not feasible
Abstract
Motivation: Mathematical modelling plays a crucial role in understanding inter- and intracellular signalling processes. Currently, ordinary differential equations (ODEs) are the predominant approach in systems biology for modelling such pathways. While ODE models offer mechanistic interpretability, they also suffer from limitations, including the need to consider all relevant compounds, resulting in large models difficult to handle numerically and requiring extensive data.
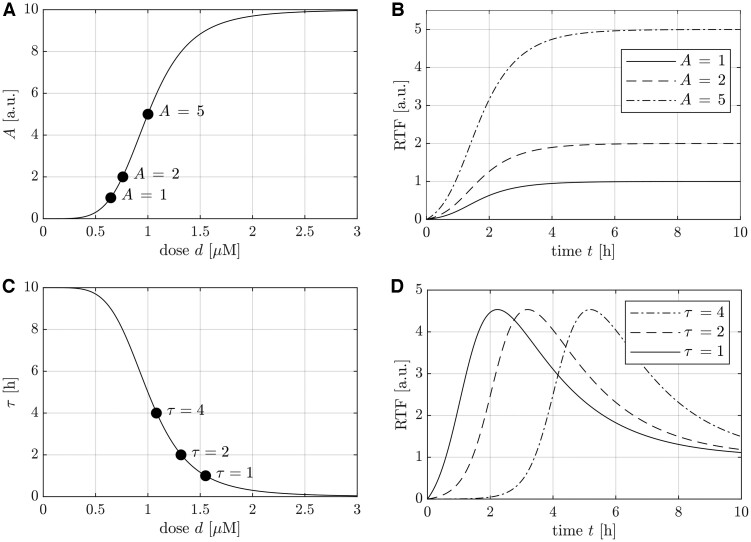
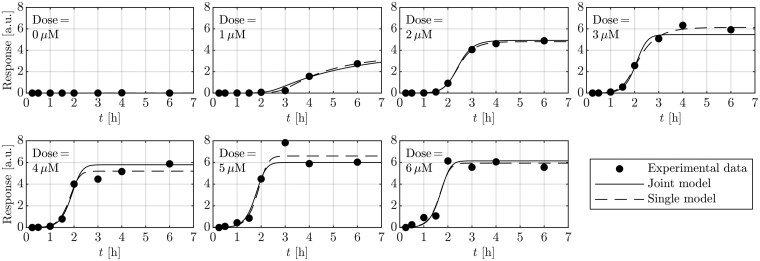
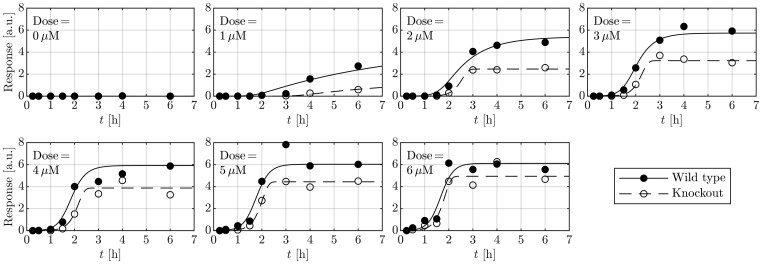
Results: In previous work, we introduced the retarded transient function (RTF) as an alternative method for modelling temporal responses of signalling pathways. Here, we extend the RTF approach to integrate concentration or dose-dependencies into the modelling of dynamics. With this advancement, RTF modelling now fully encompasses the application range of ODE models, which comprises predictions in both time and concentration domains. Moreover, characterizing dose-dependencies provides an intuitive way to investigate and characterize signalling differences between biological conditions or cell types based on their response to stimulating inputs. To demonstrate the applicability of our extended approach, we employ data from time- and dose-dependent inflammasome activation in bone marrow-derived macrophages treated with nigericin sodium salt. Our results show the effectiveness of the extended RTF approach as a generic framework for modelling dose-dependent kinetics in cellular signalling. The approach results in intuitively interpretable parameters that describe signal dynamics and enables predictive modelling of time- and dose-dependencies even if only individual cellular components are quantified.
Availability and implementation: The presented approach is available within the MATLAB-based Data2Dynamics modelling toolbox at https://github.com/Data2Dynamics and https://zenodo.org/records/14008247 and as R code at https://github.com/kreutz-lab/RTF.
© The Author(s) 2024. Published by Oxford University Press.
Figures
References
-
- Bradley RA, Srivastava SS.. Correlation in polynomial regression. Am Stat 1979;33:11–4. 10.1080/00031305.1979.10482644 - DOI
-
- Cox DR, Hinkley DV.. Theoretical Statistics. Boca Raton, Florida, U.S.: CRC Press, 1979.
-
- Cressie N. The origins of kriging. Math Geol 1990;22:239–52. 10.1007/BF00889887 - DOI
-
- Heinonen M, Yildiz C, Mannerström H. et al. Learning unknown ode models with Gaussian processes. In: International Conference on Machine Learning. Stockholm, Sweden: PMLR, 2018, 1959–68.
MeSH terms
Grants and funding
LinkOut - more resources
Full Text Sources
Miscellaneous
