

The Genomic Signature and Transcriptional Response of Metal Tolerance in Brown Trout Inhabiting Metal-Polluted Rivers
- PMID: 39558756
- PMCID: PMC11665495
- DOI: 10.1111/mec.17591
The Genomic Signature and Transcriptional Response of Metal Tolerance in Brown Trout Inhabiting Metal-Polluted Rivers
Abstract
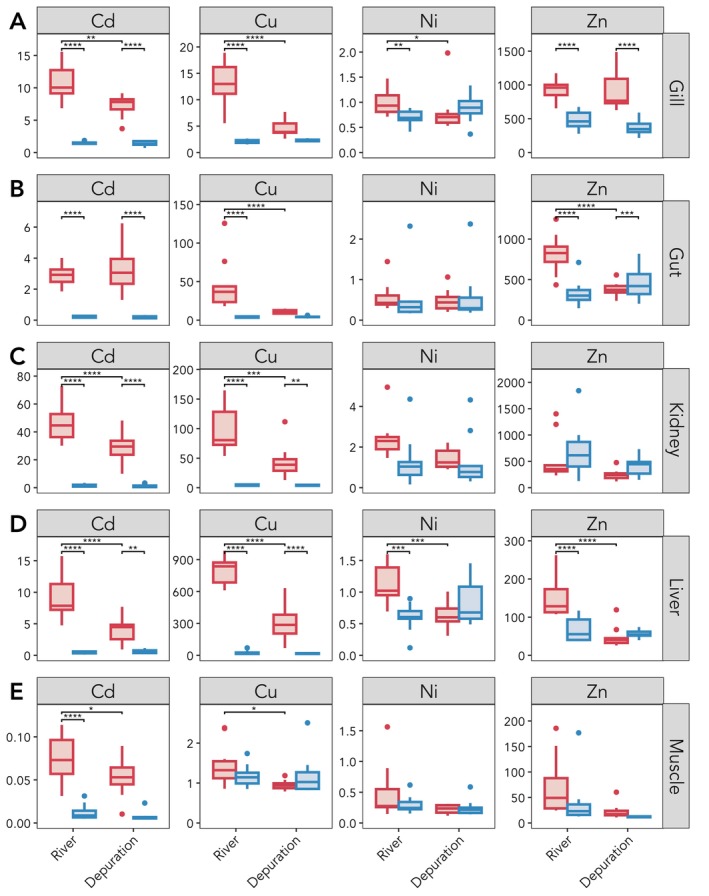
Industrial pollution is a major driver of ecosystem degradation, but it can also act as a driver of contemporary evolution. As a result of intense mining activity during the Industrial Revolution, several rivers across the southwest of England are polluted with high concentrations of metals. Despite the documented negative impacts of ongoing metal pollution, brown trout (Salmo trutta L.) survive and thrive in many of these metal-impacted rivers. We used population genomics, transcriptomics, and metal burdens to investigate the genomic and transcriptomic signatures of potential metal tolerance. RADseq analysis of six populations (originating from three metal-impacted and three control rivers) revealed strong genetic substructuring between impacted and control populations. We identified selection signatures at 122 loci, including genes related to metal homeostasis and oxidative stress. Trout sampled from metal-impacted rivers exhibited significantly higher tissue concentrations of cadmium, copper, nickel and zinc, which remained elevated after 11 days in metal-free water. After depuration, we used RNAseq to quantify gene expression differences between metal-impacted and control trout, identifying 2042 differentially expressed genes (DEGs) in the gill, and 311 DEGs in the liver. Transcriptomic signatures in the gill were enriched for genes involved in ion transport processes, metal homeostasis, oxidative stress, hypoxia, and response to xenobiotics. Our findings reveal shared genomic and transcriptomic pathways involved in detoxification, oxidative stress responses and ion regulation. Overall, our results demonstrate the diverse effects of metal pollution in shaping both neutral and adaptive genetic variation, whilst also highlighting the potential role of constitutive gene expression in promoting metal tolerance.
Keywords: RADseq; RNAseq; adaptation; freshwater; pollution; toxic metals.
© 2024 The Author(s). Molecular Ecology published by John Wiley & Sons Ltd.
Conflict of interest statement
The authors declare no conflicts of interest.
Figures


Similar articles
-
Gill metal binding and stress gene transcription in brown trout (Salmo trutta) exposed to metal environments: the effect of pre-exposure in natural populations.Environ Toxicol Chem. 2007 May;26(5):944-53. doi: 10.1897/06-380r.1. Environ Toxicol Chem. 2007. PMID: 17521141
-
The effect of metal pollution on the population genetic structure of brown trout (Salmo trutta L.) residing in the River Hayle, Cornwall, UK.Environ Pollut. 2011 Dec;159(12):3595-603. doi: 10.1016/j.envpol.2011.08.005. Epub 2011 Aug 31. Environ Pollut. 2011. PMID: 21885173
-
Can ecological history influence response to pollutants? Transcriptomic analysis of Manila clam collected in different Venice lagoon areas and exposed to heavy metal.Aquat Toxicol. 2016 May;174:123-33. doi: 10.1016/j.aquatox.2016.02.024. Epub 2016 Mar 2. Aquat Toxicol. 2016. PMID: 26945539
-
Global transcriptomic profiling demonstrates induction of oxidative stress and of compensatory cellular stress responses in brown trout exposed to glyphosate and Roundup.BMC Genomics. 2015 Jan 31;16(1):32. doi: 10.1186/s12864-015-1254-5. BMC Genomics. 2015. PMID: 25636363 Free PMC article.
-
Implications of metal accumulation mechanisms to phytoremediation.Environ Sci Pollut Res Int. 2009 Mar;16(2):162-75. doi: 10.1007/s11356-008-0079-z. Epub 2008 Dec 6. Environ Sci Pollut Res Int. 2009. PMID: 19067014 Review.
References
-
- Abdelnour, S. A. , Naiel M. A. E., Said M. B., et al. 2024. “Environmental Epigenetics: Exploring Phenotypic Plasticity and Transgenerational Adaptation in Fish.” Environmental Research 252, no. Pt 1: 118799. - PubMed
-
- Ahrens, C. W. , Rymer P. D., Stow A., et al. 2018. “The Search for Loci Under Selection: Trends, Biases and Progress.” Molecular Ecology 27, no. 6: 1342–1356. - PubMed
-
- Andres, S. , Ribeyre F., Tourencq J.‐N., and Boudou A.. 2000. “Interspecific Comparison of Cadmium and Zinc Contamination in the Organs of Four Fish Species Along a Polymetallic Pollution Gradient (Lot River, France).” Science of the Total Environment 248, no. 1: 11–25. - PubMed
MeSH terms
Substances
Grants and funding
LinkOut - more resources
Full Text Sources
Research Materials
