. 2025 Jan;12(2):e2407222.
doi: 10.1002/advs.202407222. Epub 2024 Nov 19.

Ginkgetin Alleviates Inflammation and Senescence by Targeting STING

Affiliations

Ginkgetin Alleviates Inflammation and Senescence by Targeting STING

Yadan Liu et al. Adv Sci (Weinh). 2025 Jan.

Abstract

Ginkgo biloba extract is reported to have therapeutic effects on aging-related disorders. However, the specific component responsible for this biological function and its mechanism of action remain largely unknown. This study finds that Ginkgetin, an active ingredient of Ginkgo biloba extract, can alleviate cellular senescence and improve pathologies in multiple tissues of aging mice. To reveal the molecular mechanism of Ginkgetin's anti-aging effect, a graph convolutional network-based drug "on-target" pathway prediction algorithm for prediction is employed. The results indicate that the cGAS-STING pathway may be a potential target for Ginkgetin. Subsequent cell biological and biophysical data confirmed that Ginkgetin directly binds to the carboxy-terminal domain of STING protein, thereby inhibiting STING activation and signal transduction. Furthermore, in vivo pharmacodynamic data showed that Ginkgetin effectively alleviates systemic inflammation in Trex1-/- mice and inhibits the abnormally activated STING signaling in aging mouse model. In summary, this study, utilizing an artificial intelligence algorithm combined with pharmacological methods, confirms STING serves as a critical target for Ginkgetin in alleviating inflammation and senescence. Importantly, this study elucidates the specific component and molecular mechanism underlying the anti-aging effect of Ginkgo biloba extract, providing a robust theoretical basis for its therapeutic use.

Keywords: Ginkgetin; STING inhibitor; cGAS‐STING signaling; senescence; target identification.


Conflict of interest statement

The authors declare no conflict of interest.

Figures

Figure 1
Figure 1
Ginkgetin alleviates cellular senescence and improves pathologies in multiple tissues of aging mice. A,B) MEFs were pretreated with 100 nm Dox for 24 h and subsequently treated with 2 µm Ginkgetin for an additional 48 h. The transcriptional levels of p16, p21, Il6, and Il1b mRNA in MEFs were measured by RT‐qPCR (A). SA‐β‐Gal staining was also examined and quantified in MEFs, scale bars represent 50 µm (B). C,D) MEFs were irradiated with 6 Gy X‐ray and subsequently treated with 2 µm Ginkgetin for 5 days. The transcriptional levels of p16, p21, Il6, and Il1b mRNA in MEFs were measured by RT‐qPCR (C). SA‐β‐Gal staining was also examined and quantified in MEFs, scale bars represent 50 µm (D). E‐H) C57BL/6J mice were intraperitoneally injected with 10 mg kg−1 Dox on days 1 and 40, followed by intraperitoneal administration of 5 mg kg−1 Ginkgetin every 2 days for 2 months (n = 5). The transcriptional levels of p16, p21, Il6, and Il1b mRNA in kidney, liver, muscle, and spleen were measured by RT‐qPCR (E). The representative images of SA‐β‐Gal staining in kidney were shown, scale bars represent 100 µm (F). The representative images of hematoxylin and eosin (H&E) staining in kidney and liver of Dox‐induced aging mice were shown, scale bars represent 100 µm (G). The physical functions, including the distance run in the OFT, grip strength, and time on the rotarod before falling, were assessed (H). I‐L) C57BL/6J mice were irradiated with a 5 Gy X‐ray for 8 weeks, followed by intraperitoneal administration of 5 mg kg−1 Ginkgetin every 2 days for another 8 weeks (n = 6). The representative images of SA‐β‐Gal staining in kidney were shown, scale bars represent 100 µm (I). The representative images of H&E staining in kidney were shown, scale bars represent 100 µm (J). The transcriptional levels of p16 and p21 mRNA in kidney, lung, liver, heart, and visceral adipose tissue (VAT) were measured by RT‐qPCR (K). The physical functions, including the distance run in the OFT, grip strength, and time on rotarod before falling, were assessed (L). Data are shown as mean ± SEM from at least three independent experiments; a two‐tailed unpaired t‐test was used to analyze significant differences between groups. *P < 0.05; **P < 0.01; ***P < 0.001.
Figure 2
Figure 2
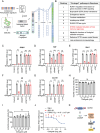
The cGAS‐STING pathway was predicted and confirmed as an “on‐target” pathway for Ginkgetin. A) Ginkgetin‐induced signatures with protein‐protein interactions (PPI) network were passed to a spectral‐based graph convolutional network (sGCN) module to get latent vectors. The SMILES of Ginkgetin was encoded into Morgan fingerprints. Then the latent vectors and Morgan fingerprints were concatenated, and the united vectors were further fed to a deep dense network to predict the “on‐target” pathways. B) The top 10 predicted “on‐target” pathways for Ginkgetin. C,D) THP‐1 mφs were co‐treated with Ginkgetin (10 µm) and various stimuli (G3‐YSD at 1 µg mL−1, cGAMP at 5 µm, poly (I:C) at 2.5 µg mL−1 and LPS at 10 µg mL−1) for 6 h, and the mRNA expression levels of IFNB1 (C) and TNF (D) were measured by RT‐qPCR. E‐G) Raw 264.7 cells were co‐treated with Ginkgetin (10 µm) and various stimuli (ISD at 1 µg mL−1, cGAMP at 5 µm, poly (I:C) at 2.5 µg mL−1 and LPS at 10 µg mL−1) for 6 h, and the mRNA expression levels of Ifnb1 (E), Il6 (F) and Cxcl10 (G) were measured by RT‐qPCR. H,I) Ginkgetin's inhibitory effects on the enzymatic activities of human cGAS (hcGAS) (H) and mouse cGAS (mcGAS) (I) were measured by the PPiase‐coupled cGAS activity assay. J) 293T cells over‐expressing STING, TBK1, or IRF3‐5D were treated with different concentrations of Ginkgetin for 6 h, and the mRNA expression level of IFNB1 was detected by RT‐qPCR. K) The schematic diagram of the cGAS‐STING pathway. Data are shown as mean ± SEM of at least three independent experiments; a two‐tailed unpaired t‐test was used to analyze significant differences between groups. ns, no statistical difference; *P < 0.05; **P < 0.01; ***P < 0.001.
Figure 3
Figure 3
Ginkgetin directly bound to the carboxy‐terminal domain of STING. A) Summary of the effects of Ginkgetin on the thermal stability of various STING proteins. B) The melting curves of hSTINGWT and mSTINGWT proteins treated with different doses of Ginkgetin in the PTS assay. C) The melting curves of hSTINGN154S and hSTINGV155M proteins treated with different doses of Ginkgetin in the PTS assay. D,E) The kinetic binding profiles of Ginkgetin with hSTINGWT protein (D) and mSTINGWT protein (E) analyzed by SPR assay. The K D values were determined using a 1:1 kinetics binding model. F) ITC‐binding curves for Ginkgetin titrated into hSTINGWT. The upper left graph represents the raw ITC thermograms, and the lower left graph represents the fitted binding isotherms. The right graph shows the ΔG, ΔH and ‐TΔS during the period. G) HTRF analysis curve of the competition between Ginkgetin and cGAMP for binding to hSTINGWT protein. Data are shown as mean ± SEM from at least three independent experiments.
Figure 4
Figure 4
Ginkgetin inhibits STING activation and signal transduction. A) SEAP (Secreted Alkaline Phosphatase) activity in THP‐1 mφs and Luciferase activity in Raw‐Lucia cells treated with Ginkgetin for 24 h in the presence of 5 µm cGAMP. B) Cell viability of THP‐1 mφs and Raw 264.7 cells treated with various concentrations of Ginkgetin for 24 h. C,D) Transcriptomic analysis of THP‐1 mφs treated with indicated compounds for 6 h. cGAMP was used at 5 µm and Ginkgetin at 10 µm. Compared with the cGAMP group, the 50 most significantly downregulated genes in the Ginkgetin and cGAMP co‐treated group are represented by a heatmap (C). Differential genes between the two groups are represented by a volcanic map (D). E,F) Western blot analysis of the phosphorylation levels of key proteins in the cGAS‐STING pathway in THP‐1 mφs (E) and Raw 264.7 (F) cells co‐treated with Ginkgetin and cGAMP for 2 h. G,H) Immunofluorescence imaging for IRF3 (G) or p65 (H) in THP‐1 mφs using confocal microscopy. THP‐1 mφs were pretreated with 10 µm Ginkgetin or DMSO, followed by stimulation with 5 µm cGAMP for 2 h. Scale bars, 20 µm. I) Co‐Immunoprecipitation was performed to detect the interaction between STING and TBK1 using anti‐Myc beads (upper panel) or anti‐Flag beads (lower panel) in 293T cells. The cells were transfected with Flag‐STING and Myc‐TBK1 plasmids for 24 h, followed by 2 h co‐treatment with 10 µm Ginkgetin and 5 µm cGAMP. J,K) Immunofluorescence imaging for STING with TBK1 (J) or STING with GM130 (Golgi autoantigen) (K) in HeLa cells using confocal microscopy. Following transfection with the Flag‐STING plasmid for 24 h, the cells were treated with 10 µm Ginkgetin or DMSO, and subsequently stimulated with 5 µm cGAMP or 1 µm GSK3 for 2 h. Scare bars, 10 µm. Data are presented as mean ± SEM from at least three independent experiments.
Figure 5
Figure 5
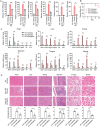
Ginkgetin suppresses systemic inflammation in Trex1 −/− mice. A) The mRNA levels of Ifnb1, Cxcl10, Isg15, Isg56, Il6, and Il1b in BMDMs were detected by RT‐qPCR. BMDMs were derived from Trex1 −/− or WT mice and treated with 10 µm Ginkgetin for 24 h. B‐D) The Trex1 −/− and WT mice were intraperitoneally treated with Vehicle or 5 mg kg−1 Ginkgetin in a solution containing DMSO, PEG400, and 10% hydroxypropyl‐β‐cyclodextrin in water (5/5/90, v/v/v), once every 2 days for 20 days (n = 6). At the experimental endpoint, the heart, liver, kidney, stomach, tongue, and muscle were collected and analyzed. Survival curves of mice were shown (B). The mRNA levels for the indicated genes in various organs and tissues were detected by RT‐qPCR (C). Images of H&E staining in various organs and tissues and their blinded histological scores are shown. Scale bars, 200 µm (D). Data are presented as mean ± SEM. A two‐tailed unpaired t‐test was used to analyze significant differences between groups. *P < 0.05, **P < 0.01, ***P < 0.001.
Figure 6
Figure 6
Ginkgetin exerts anti‐aging activity by suppressing the cGAS‐STING pathway. A‐C) The kidney (A), liver (B), and lung (C) tissues were obtained from TBI‐induced aging mouse model and subsequently stained with antibodies against p‐STING (Ser365), p‐TBK1 (Ser172), p‐IRF3 (Ser396), p‐p65 (Ser536), and p‐STAT3 (Tyr705). The representative images were shown, scale bars represent 50 µm. Quantification analysis results were also shown. Data are presented as mean ± SEM. A two‐tailed unpaired t‐test was used to analyze significant differences between groups. **P < 0.01; ***P < 0.001.

References

    1. Campisi J., Annu. Rev. Physiol. 2013, 75, 685. - PMC - PubMed
    1. JAMA, J. Am. Med. Assoc. 1967, 200, 1176.
    1. López‐Otín C., Blasco M. A., Partridge L., Serrano M., Kroemer G., CellCell 2023, 186, 243. - PubMed
    1. Hernandez‐Segura A., Nehme J., Demaria M., Trends Cell Biol. 2018, 28, 436. - PubMed
    1. Coppé J.‐P., Desprez P.‐Y., Krtolica A., Campisi J., Annu Rev Pathol 2010, 5, 99. - PMC - PubMed

LinkOut - more resources