. 2024 Dec;20(12):8684-8699.
doi: 10.1002/alz.14318. Epub 2024 Nov 19.

Plasma p-tau181 and GFAP reflect 7T MR-derived changes in Alzheimer's disease: A longitudinal study of structural and functional MRI and MRS

Affiliations

Plasma p-tau181 and GFAP reflect 7T MR-derived changes in Alzheimer's disease: A longitudinal study of structural and functional MRI and MRS

Laura Göschel et al. Alzheimers Dement. 2024 Dec.

Abstract

Background: Associations between longitudinal changes of plasma biomarkers and cerebral magnetic resonance (MR)-derived measurements in Alzheimer's disease (AD) remain unclear.

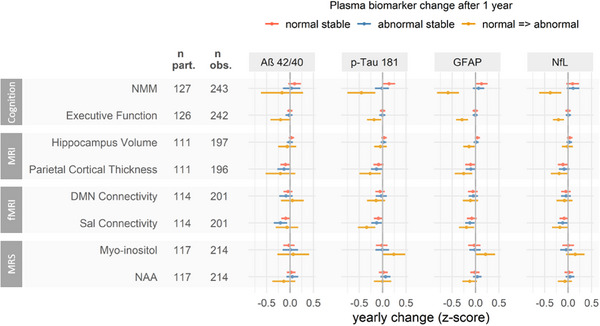
Methods: In a study population (n = 127) of healthy older adults and patients within the AD continuum, we examined associations between longitudinal plasma amyloid beta 42/40 ratio, tau phosphorylated at threonine 181 (p-tau181), glial fibrillary acidic protein (GFAP), neurofilament light chain (NfL), and 7T structural and functional MR imaging and spectroscopy using linear mixed models.

Results: Increases in both p-tau181 and GFAP showed the strongest associations to 7T MR-derived measurements, particularly with decreasing parietal cortical thickness, decreasing connectivity of the salience network, and increasing neuroinflammation as determined by MR spectroscopy (MRS) myo-inositol.

Discussion: Both plasma p-tau181 and GFAP appear to reflect disease progression, as indicated by 7T MR-derived brain changes which are not limited to areas known to be affected by tau pathology and neuroinflammation measured by MRS myo-inositol, respectively.

Highlights: This study leverages high-resolution 7T magnetic resonance (MR) imaging and MR spectroscopy (MRS) for Alzheimer's disease (AD) plasma biomarker insights. Tau phosphorylated at threonine 181 (p-tau181) and glial fibrillary acidic protein (GFAP) showed the largest changes over time, particularly in the AD group. p-tau181 and GFAP are robust in reflecting 7T MR-based changes in AD. The strongest associations were for frontal/parietal MR changes and MRS neuroinflammation.

Keywords: 7 Tesla; Alzheimer's disease; NeuroMET Memory Metric; amyloid beta 42/40; blood‐based biomarkers; functional magnetic resonance imaging; glial fibrillary acidic protein; magnetic resonance imaging; magnetic resonance spectroscopy; memory; mild cognitive impairment; neurofilament light chain; plasma biomarkers; subjective cognitive decline; tau phosphorylated at threonine 181.


Conflict of interest statement

Charlotte E. Teunissen has research contracts with Acumen, ADx Neurosciences, AC‐Immune, Alamar, Aribio, Axon Neurosciences, Beckman‐Coulter, BioConnect, Bioorchestra, Brainstorm Therapeutics, Celgene, Cognition Therapeutics, EIP Pharma, Eisai, Eli Lilly, Fujirebio, Grifols, Instant Nano Biosensors, Merck, Novo Nordisk, Olink, PeopleBio, Quanterix, Roche, Siemens, Toyama, and Vivoryon. Charlotte E. Teunissen is editor‐in‐chief of Alzheimer Research and Therapy and serves on editorial boards of Medidact Neurologie/Springer, and Neurology: Neuroimmunology & Neuroinflammation. Charlotte E. Teunissen had speaker contracts for Eli Lilly, Novo Nordisk, Olink, and Roche. Agnes Flöel had speaker contracts for Eli Lilly, Biogen Idec, Eisai, and Roche, and advisory board contracts for Eli Lilly and Biogen Idec. Sylvain Lehmann has speaker contracts with Eli Lilly, Roche, Beckman Coulter, and Fujirebio, and advisory board contracts with Beckman Coulter and Roche. Péter Körtvélyessy consulted Biogen, Eli Lilly, and Novartis; had speaker contracts with Eisai, Eli Lilly, and Novartis;, and advisory board contracts with Eli Lilly and Biogen. There is nothing to disclose for Andrea Dell'Orco, Ariane Fillmer, Claudia Schwarz, Jeanette Melin, Laura Göschel, Layla Riemann, Leslie Pendrill, Patty L. Hoede, Semiha Aydin, Stefan Cano, and Ulrike Grittner. Author disclosures are available in the supporting information.

Figures

FIGURE 1
FIGURE 1
Structural MR images and spectra from participants from the clinically defined groups HC (age = 61), SCD (age = 62), MCI (age = 70), and AD (age = 66) using a 7T whole‐body scanner (Magnetom 7T, Siemens Healthineers). Structural data were acquired by T1‐weighted MP2RAGE and segmented by FreeSurfer 7.1.1. For this study, we selected the thickness of the ROIs of the parietal lobe (superior and inferior parietal, supramarginal, postcentral, precuneus, and PCC) and the volume of the hippocampus (extracted from the subfield pipeline, Figure 1 shows the left hippocampus). MRS data on myo‐inositol and NAA concentration were acquired in a 20 × 20 × 20 mm3 MRS volume‐of‐interest positioned in the sagittal PCC/precuneus region (see the red square in the inlet) using the SPECIAL sequence and the software LCModel v6.3. AD, Alzheimer's disease; HC, healthy control; MCI, mild cognitive impairment; MP2RAGE, magnetization‐prepared 2 rapid acquisition gradient echo sequence; MR, magnetic resonance; MRS, magnetic resonance spectroscopy; NAA, N‐acetylaspartate; PCC, posterior cingulate cortex; ROIs, regions of interest; SCD, subjective cognitive decline; SPECIAL, spin echo full intensity acquired localization.
FIGURE 2
FIGURE 2
Glass brains to visualize the default mode network (left) and salience network (right). ROIs were defined using the 7 networks, 400 ROIs Schaefer Atlas. . ROIs, regions of interest.
FIGURE 3
FIGURE 3
Description of longitudinal concentration changes of plasma Aß42/Aß40, p‐tau181, GFAP, and NfL. In the SCD group, only plasma p‐tau181 showed a relevant yearly increase. The AD group, however, showed substantially increasing concentrations of p‐tau181, GFAP, and NfL. Concentrations were measured at visit 1 (n = 127), and when available at follow‐ups after 1 year (n = 32), 3 years (n = 44), 4 years (n = 31), and 5 years (n = 9). The thin lines link individual concentrations at each available visit. The linear fits are presented with 95% CI (shaded areas) estimated by linear mixed models adjusted for age. For later interpretation of the models, orange lines represent the mean of the HC group at visit 1 (continuous line) and 1 SD toward the pathological direction (dashed line). Aß, amyloid beta; AD, Alzheimer's disease; CI, confidence interval; GFAP, glial fibrillary acidic protein; HC, healthy control; MCI, mild cognitive impairment; NfL, neurofilament light chain; p‐tau181, tau phosphorylated at threonine 181; SCD, subjective cognitive decline; SD, standard deviation.
FIGURE 4
FIGURE 4
Description of longitudinal changes of cognition, structural and fMRI, and MRS. The thin lines link individual measurements in their individual unit at each available visit. The linear fits are presented with 95% CI (shaded areas) estimated by linear mixed models adjusted for age. Models including the MRS parameters myo‐inositol and NAA were additionally weighted based on a measure of uncertainty (CRLB). Although on average, the HC, SCD, and MCI groups showed stable cognition over time, there were changes in hippocampus volume, parietal cortical thickness, salience network connectivity, myo‐inositol, and NAA. Besides a substantial cognitive decline in the AD group, individuals showed a decrease in hippocampus volume and salience network connectivity. Due to the small sample size for longitudinal data and the grouping being based on clinical and not pathological diagnostics, further models of associations between MR‐derived measurements and plasma biomarkers did not include groups. AD, Alzheimer's disease; CI, confidence interval; CRLB, Cramér‐Rao lower bound; fMRI, functional magnetic resonance imaging; HC, healthy control; MCI, mild cognitive impairment; MRI, magnetic resonance imaging; MRS, magnetic resonance spectroscopy; NAA, N‐acetylaspartic acid; NMM, NeuroMET Memory Metric; SCD, subjective cognitive decline; thickn., thickness; vol., volume.
FIGURE 5
FIGURE 5
Cross‐sectional associations between concentrations of plasma Aß42/40, p‐tau181, GFAP, and NfL and z transformed parameters of cognition, structural and fMRI, and MRS (at visit 1). Largest effect sizes were consistently found for either p‐tau181 or GFAP. Effects for Aß42/40 were smaller with large uncertainties. Effects for NMM, that is, memory ability, were considerably larger than for any of the MR‐based parameters. Depending on data availability, observations of a maximum of 127 participants were included. The effects are presented with 95% CI (horizontal bars) estimated by linear mixed models adjusted for age, sex, and education. Models including the MRS parameters myo‐inositol and NAA were additionally weighted based on a measure of uncertainty (CRLB). Connectivity measures for the DMN and Sal were acquired at resting state. Aß, amyloid beta; CI, confidence interval; CRLB, Cramér‐Rao lower bound; DMN, default mode network; fMRI, functional magnetic resonance imaging; GFAP, glial fibrillary acidic protein; MR, magnetic resonance; MRI, magnetic resonance imaging; MRS, magnetic resonance spectroscopy; NAA, N‐acetylaspartic acid; NfL, neurofilament light chain; NMM, NeuroMET Memory Metric; p‐tau181, tau phosphorylated at threonine 181; Sal, salience network.
FIGURE 6
FIGURE 6
Yearly change of cognitive, structural, and fMRI, and MRS parameters depending on changes of plasma Aß42/40, p‐tau181, GFAP, and NfL. To allow for comparison, all parameters were z‐transformed. Yearly changes were estimated for discrete changes of plasma biomarker concentrations after 1 year: stable concentrations of the mean of the HC group (normal stable, blue), change of concentration from the mean of the HC group to 1 SD toward the pathological direction as indicated in Figure 1 (normal ⇒ abnormal, red), stable concentrations of 1 SD toward the pathological direction (abnormal stable, blue). Depending on data availability, a maximum of 127 participants with 243 observations were included. The effects are presented with 95% CI estimated by linear mixed models adjusted for age, sex, and education. Models including the MRS markers myo‐inositol and NAA were additionally weighted based on a measure of uncertainty (CRLB). Aß, amyloid beta; CI, confidence interval; CRLB, Cramér‐Rao lower bound; DMN, Default mode network; fMRI, functional magnetic resonance imaging; GFAP, glial fibrillary acidic protein; HC, healthy control; MRI, magnetic resonance imaging; MRS, magnetic resonance spectroscopy; NAA, N‐acetylaspartic acid; NfL, neurofilament light chain; NMM, NeuroMET Memory Metric; obs., observations; part., participants; p‐tau181, tau phosphorylated at threonine 181; Sal, salience network; SD, standard deviation.

References

    1. Salvadó G, Ossenkoppele R, Ashton NJ, et al. Specific associations between plasma biomarkers and postmortem amyloid plaque and tau tangle loads. EMBO Mol Med. 2023;15:e17123. doi:10.15252/emmm.202217123 - DOI - PMC - PubMed
    1. Lantero Rodriguez J, Karikari TK, Suarez‐Calvet M, et al. Plasma p‐tau181 accurately predicts Alzheimer's disease pathology at least 8 years prior to post‐mortem and improves the clinical characterisation of cognitive decline. Acta Neuropathol. 2020;140(3):267‐278. doi:10.1007/s00401-020-02195-x - DOI - PMC - PubMed
    1. Ashton NJ, Janelidze S, Mattsson‐Carlgren N, et al. Differential roles of Aβ42/40, p‐tau231 and p‐tau217 for Alzheimer's trial selection and disease monitoring. Nat Med. 2022;28:2555‐2562. doi:10.1038/s41591-022-02074-w - DOI - PMC - PubMed
    1. Hansson O, Edelmayer RM, Boxer AL, et al. The Alzheimer's Association appropriate use recommendations for blood biomarkers in Alzheimer's disease. Alzheimers Dement. 2022;18(12):2669‐2686. doi:10.1002/alz.12756 - DOI - PMC - PubMed
    1. Jack CR Jr, Andrews JS, Beach TG, et al. Revised criteria for diagnosis and staging of Alzheimer's disease: Alzheimer's Association Workgroup. Alzheimers Dement. 2024;20(8):5143‐5169. doi:10.1002/alz.13859 - DOI - PMC - PubMed

MeSH terms

LinkOut - more resources