

Association of oxidative balance score with hyperuricemia and gout: NHANES 2009-2018
- PMID: 39558977
- PMCID: PMC11570265
- DOI: 10.3389/fendo.2024.1402369
Association of oxidative balance score with hyperuricemia and gout: NHANES 2009-2018
Abstract
Introduction: Oxidative stress plays a crucial role in the development and progression of hyperuricemia/gout. This study aims to explore the relationship between the Oxidative Balance Score (OBS) and hyperuricemia/gout.
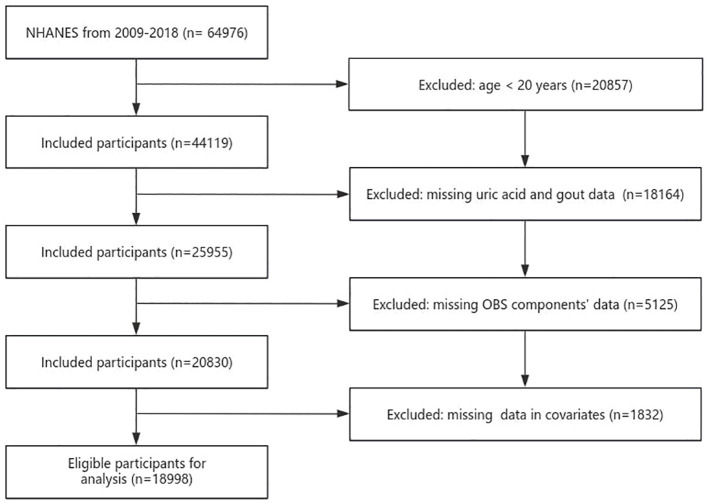
Methods: The study utilized complete data from adult participants in the National Health and Nutrition Examination Survey (NHANES) spanning from 2009 to 2018. OBS, composed of scores for 20 dietary and lifestyle factors, served as the exposure variable. Multivariable linear regression model was applied to evaluate the association between OBS and uric acid (UA). Multivariable logistic regression, subgroup analyses, and restricted cubic spline (RCS) regression were conducted to explore the relationship between OBS and hyperuricemia/gout.
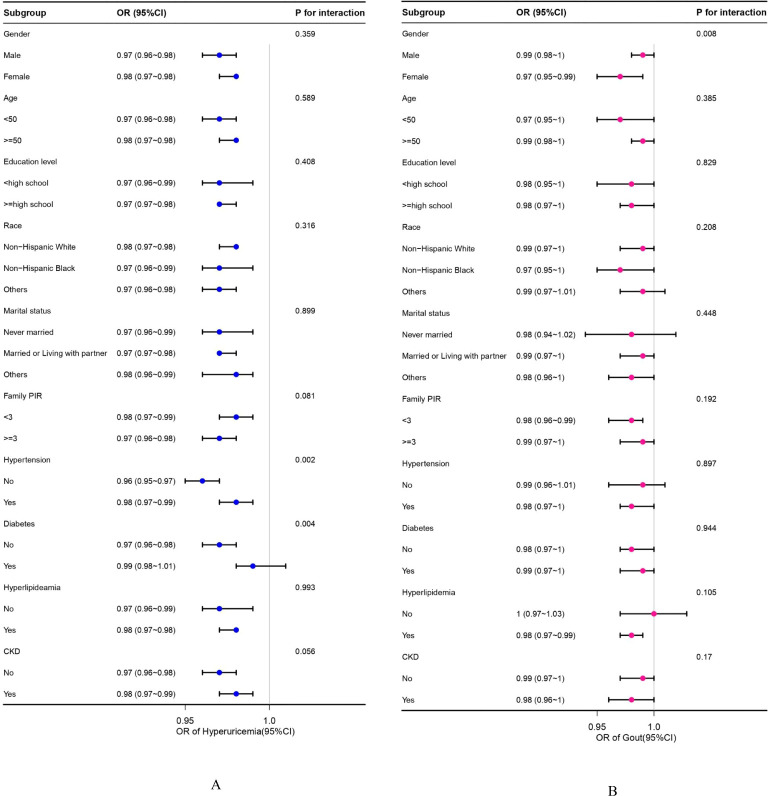
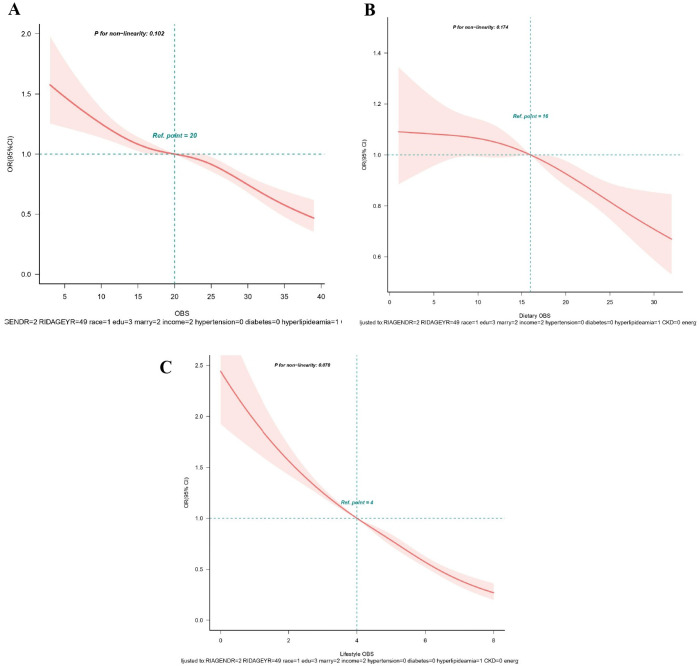
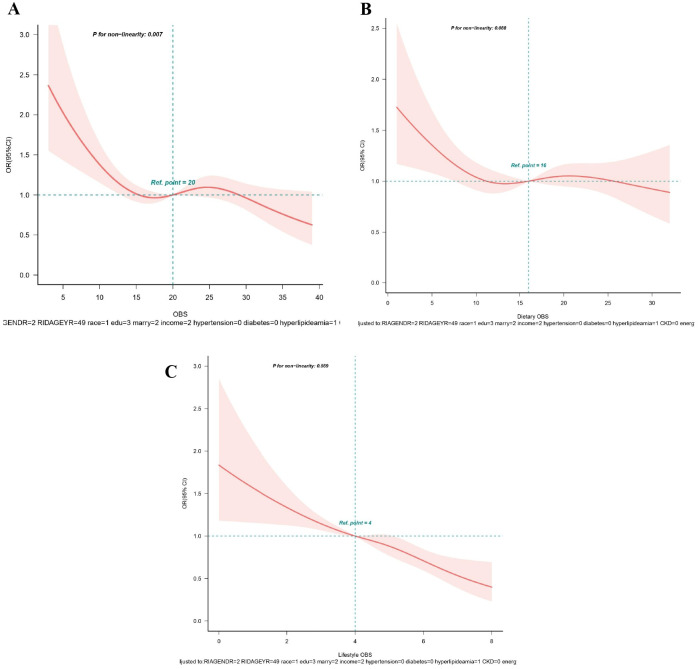
Results: A total of 18,998 participants were included. In the fully adjusted model, compared to the lowest quartile, the highest quartiles of OBS, dietary OBS, and lifestyle OBS were negatively correlated with UA (β=-0.31 (-0.36,-0.25), β=-0.18 (-0.24,-0.12), and β=-0.64 (-0.69,-0.59), respectively) and hyperuricemia (OR=0.63 (0.55,0.71), OR=0.76 (0.67,0.86), OR=0.37 (0.33,0.42), respectively). Moreover, the highest quartiles of OBS and lifestyle OBS exhibited a negative correlation with gout (OR=0.72(0.58,0.91), OR=0.54 (0.43,0.67), respectively). Subgroup analyses revealed differences in the negative association between OBS and hyperuricemia concerning hypertension (p for interaction =0.002) and diabetes (p for interaction= 0.004), while gender-related disparities were observed in the negative association between OBS and gout (p for interaction =0.008). RCS analysis demonstrated a linear negative association between hyperuricemia and OBS (p for non-linearity >0.05), while gout exhibited a non-linear negative association (p for non-linearity<0.05).
Conclusion: The study found that a higher OBS was associated with a decreased risk of developing hyperuricemia/gout, underscoring its potential in the prevention and management of these conditions.
Keywords: NHANES; antioxidants; gout; hyperuricemia; oxidative balance score; oxidative stress.
Copyright © 2024 He, Chen, Ma, Wang and Lin.
Conflict of interest statement
The authors declare that the research was conducted in the absence of any commercial or financial relationships that could be construed as a potential conflict of interest.
Figures
References
MeSH terms
Substances
LinkOut - more resources
Full Text Sources
Medical