. 2024 Sep 26;27(11):111042.
doi: 10.1016/j.isci.2024.111042. eCollection 2024 Nov 15.

Irisin reduces senile osteoporosis by inducing osteocyte mitophagy through Ampk activation

Affiliations

Irisin reduces senile osteoporosis by inducing osteocyte mitophagy through Ampk activation

Honghan Li et al. iScience. .

Abstract

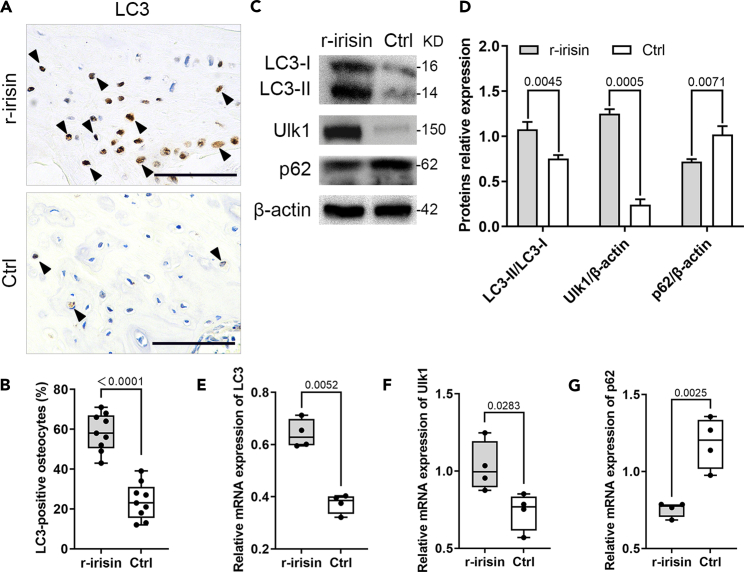
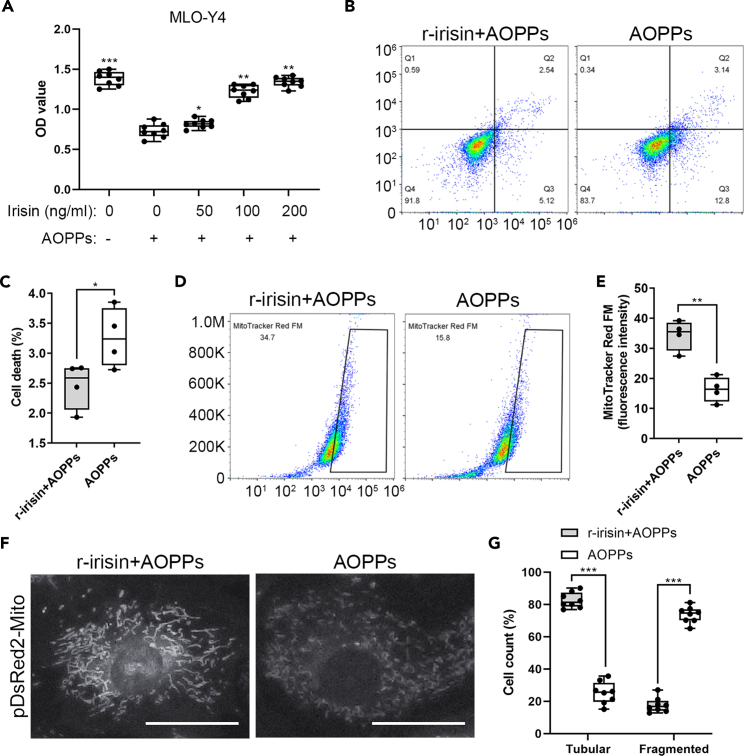
Irisin, an exercise-induced myokine, is known to be able to regulate bone metabolism. However, the underlying mechanisms regarding the effects of irisin on senile osteoporosis have not been fully elucidated. Here, we demonstrated that irisin can inhibit bone mass loss and bone microarchitecture alteration in senile osteoporosis mouse model. In addition, irisin has effects on bone remodeling that is in favor of bone formation. Remarkably, irisin induced autophagy in osteocytes demonstrated by increased LC3-positive osteocytes, and increased autophagy-related genes and proteins. In vitro analysis revealed that Irisin can prevent mitochondrial oxidative damage. Furthermore, irisin can obviously induce osteocyte mitophagy and increased phosphorylation of Ampk and Ulk1. Inhibition of Ampk signaling recapitulated the biological effect of irisin loss, accompanied by the markedly lower expression of Ulk1. Taken together, our findings show that irisin reduces age-related bone loss by inducing osteocyte mitophagy via Ampk-dependent activation of Ulk1.

Keywords: Biological sciences; Molecular biology; Physiology.


Conflict of interest statement

The authors declare no competing interests.

Figures

None
Graphical abstract
Figure 1
Figure 1
Irisin reduces body weight, enhances physical activity, and inhibits bone mass loss and bone microarchitecture alteration in senile osteoporosis mice (A) Photograph of 24-month-old mice to demonstrate hair loss from control group, whereas r-irisin treatment group had no overt phenotype. (B and C) The body weight was reduced, and the physical activity was enhanced in the treatment group compared to the control group. (D) Three-dimensional images of the L4 vertebrae and the lower extremity. (E–J) Quantitative Micro-CT analysis of BMD, BV/TV, Tb.Th, Tb.N, Tb.Sp, and Ct.Th in the L4 vertebrae, femur, and tibia from two groups mice. All quantitative data were assessed by two-tailed unpaired Student’s t test; n = 10 animals. White arrows, cortical bones. Data are represented as mean ± SD.
Figure 2
Figure 2
Irisin increases the ratio of osteoblasts/osteoclasts, the protein expression of sclerostin, and the ratio of serum PINP/CTX-I (A and B) TRAP staining and quantification for the L4 lumbar vertebrae bone sections demonstrate increased osteoclast number in the treatment group compared to the control group. (C and D) IHC of the L4 lumbar vertebraes shows the protein expression level of Ocn was increased in the treatment group compared to the control group. (E) Quantification of bone turnover reveals the ratio of Osteocalcin-positive cells to Trap-positive cells was upregulated. (F and G) IHC of the tibias demonstrates increased the protein expression level of sclerostin in the treatment group compared to the control group. (H–J) The level of the CTX-I, PINP, and the ratio of serum PINP/CTX-I were increased in the treatment group when compared with the control group. All quantitative histomorphometry data were assessed by two-tailed non-parametric Mann-Whitney test; n = 10 animals. Black arrows, positive cells. Scale bar, 20 μm. Data are represented as mean ± SD.
Figure 3
Figure 3
Irisin preserves osteocyte viability through inducing osteocyte autophagy (A and B) Significant upregulation of LC3 protein expression was detected in the femurs using IHC imaging and quantitative analysis in the treatment group compared to the control group (two-tailed non-parametric Mann-Whitney test; n = 10 animals). (C and D) Western blotting confirmed that LC3-I, LC3-II, Ulk1 protein expression levels were higher, and p62 was lower in the treatment group (two-tailed non-parametric Mann-Whitney test; n = 10 animals). (E–G) Significant upregulation of autophagy-related genes LC3 and Ulk1, and downregulation of p62 were detected in treatment group by qPCR analysis (two-tailed unpaired Student’s t test; n = 10 animals). Black arrows, positive cells. Scale bar, 20 μm. Data are represented as mean ± SD.
Figure 4
Figure 4
Irisin exhibits increased proliferation potential and mitochondrial activity, and reduced cell death in the MLO-Y4 cells (A) MLO-Y4 cells were treated with the indicated concentrations of irisin and 200 μg/mL AOPPs, followed by analysis of cell viability using MTT (two-tailed unpaired Student’s t test; n = 3 independent experiments). (B–E) MLO-Y4 cells were treated with 100 ng/mL irisin and 200 μg/mL AOPPs, followed by analysis of cell death and mitochondrial activity using flow cytometry (two-tailed unpaired Student’s t test; n = 3 independent experiments). (F and G) MLO-Y4 cells were transiently transfected with the mitochondrial marker pDsRed2-Mito and treated with 100 ng/mL irisin and 200 μg/mL AOPPs for quantitative analysis of the mitochondrial morphology. The number of cells containing tubular and fragmented mitochondria was expressed as percentage of total counted cells (two-tailed non-parametric Mann-Whitney test; n = 3 independent experiments). p < 0.05; ∗∗p < 0.01; ∗∗∗p < 0.001. Scale bar, 20 μm. Data are represented as mean ± SD.
Figure 5
Figure 5
Irisin obviously induces osteocyte mitophagy and increases LC3 turnover (A and B) MLO-Y4 cells transiently expressing GFP-LC3 were treated with 100 ng/mL irisin and 200 μg/mL AOPPs and the average number of GFP-LC3 dots per cell was quantified (two-tailed non-parametric Mann-Whitney test; n = 3 independent experiments). (C and D) Western blotting confirmed that LC3-I, LC3-II, Ulk1 protein expression levels were higher, and p62 was lower in the treatment group compared to the control group (two-tailed non-parametric Mann-Whitney test; n = 3 independent experiments). (E–G) Significant upregulation of autophagy-related genes LC3 and Ulk1, and downregulation of p62 were detected in treatment group by qPCR analysis (two-tailed unpaired Student’s t test; n = 3 independent experiments). p < 0.05; ∗∗p < 0.01; ∗∗∗p < 0.001. Scale bar, 20 μm. Data are represented as mean ± SD.
Figure 6
Figure 6
Irisin increases the protein expression levels of p-Ampk in bone tissue (A and B) Significant upregulation of p-Ampk protein expression was detected in the femurs using IHC imaging and quantitative analysis in the treatment group compared to the control group (two-tailed non-parametric Mann-Whitney test; n = 10 animals). (C and D) Western blotting confirmed that p-Ampkα protein expression was higher, and no noticeable change in Ampkα, p-Acc, and Acc in the treatment group compared to the control group (two-tailed non-parametric Mann-Whitney test; n = 10 animals). (E and F) Decreased immunoreactivity due to age-related-decreased irisin and AMPK expression were detected in the osteoporosis patients by using target-specific ELISA (two-tailed unpaired Student’s t test; n = 10–12 samples). ∗∗p < 0.01. Scale bar, 20 μm. Data are represented as mean ± SD.
Figure 7
Figure 7
Irisin directly modulates osteocyte mitophagy through Ampk-dependent activation of Ulk1 (A) MLO-Y4 cells were treated with the indicated concentrations of irisin and 200 μg/mL AOPPs, followed by analysis of p-Ampkα and Ampkα protein expression using western blotting (two-tailed non-parametric Mann-Whitney test; n = 3 independent experiments). (B–E) MLO-Y4 cells were transfected with Ampkα siRNA and treated with 100 ng/mL irisin and 200 μg/mL AOPPs, followed by analysis of cell death and mitochondrial activity using flow cytometry (two-tailed unpaired Student’s t test; n = 3 independent experiments). (F and G) Western blotting confirmed that LC3-I, LC3-II, Ulk1 protein expression levels were lower, and p62 was higher in the Ampkα siRNA group compared to the control group (two-tailed non-parametric Mann-Whitney test; n = 3 independent experiments). (H and I) MLO-Y4 cells transiently expressing GFP-LC3 were treated with 100 ng/mL irisin and 200 μg/mL AOPPs and the average number of GFP-LC3 dots per cell was quantified between the Ampkα siRNA group and the control group (two-tailed non-parametric Mann-Whitney test; n = 3 independent experiments). ∗∗p < 0.01; ∗∗∗p < 0.001. Scale bar, 10 μm. Data are represented as mean ± SD.
Figure 8
Figure 8
Schematic representation of irisin reduces age-related bone loss by inducing osteocyte mitophagy through Ampk-dependent activation of Ulk1

References

    1. Rachner T.D., Khosla S., Hofbauer L.C. Osteoporosis: now and the future. Lancet. 2011;377:1276–1287. doi: 10.1016/s0140-6736(10)62349-5. - DOI - PMC - PubMed
    1. Robling A.G., Niziolek P.J., Baldridge L.A., Condon K.W., Allen M.R., Alam I., Mantila S.M., Gluhak-Heinrich J., Bellido T.M., Harris S.E., Turner C.H. Mechanical stimulation of bone in vivo reduces osteocyte expression of Sost/sclerostin. J. Biol. Chem. 2008;283:5866–5875. doi: 10.1074/jbc.M705092200. - DOI - PubMed
    1. Boström P., Wu J., Jedrychowski M.P., Korde A., Ye L., Lo J.C., Rasbach K.A., Boström E.A., Choi J.H., Long J.Z., et al. A PGC1-α-dependent myokine that drives brown-fat-like development of white fat and thermogenesis. Nature. 2012;481:463–468. doi: 10.1038/nature10777. - DOI - PMC - PubMed
    1. Lourenco M.V., Frozza R.L., de Freitas G.B., Zhang H., Kincheski G.C., Ribeiro F.C., Gonçalves R.A., Clarke J.R., Beckman D., Staniszewski A., et al. Exercise-linked FNDC5/irisin rescues synaptic plasticity and memory defects in Alzheimer's models. Nat. Med. 2019;25:165–175. doi: 10.1038/s41591-018-0275-4. - DOI - PMC - PubMed
    1. Xue Y., Hu S., Chen C., He J., Sun J., Jin Y., Zhang Y., Zhu G., Shi Q., Rui Y. Myokine Irisin promotes osteogenesis by activating BMP/SMAD signaling via αV integrin and regulates bone mass in mice. Int. J. Biol. Sci. 2022;18:572–584. doi: 10.7150/ijbs.63505. - DOI - PMC - PubMed

LinkOut - more resources