. 2024 Oct;33(10):1877-1898.
doi: 10.1177/09622802241277956.

A tight fit of the SIR dynamic epidemic model to daily cases of COVID-19 reported during the 2021-2022 Omicron surge in New York City: A novel approach

Affiliations

A tight fit of the SIR dynamic epidemic model to daily cases of COVID-19 reported during the 2021-2022 Omicron surge in New York City: A novel approach

Jeffrey E Harris. Stat Methods Med Res. 2024 Oct.

Abstract

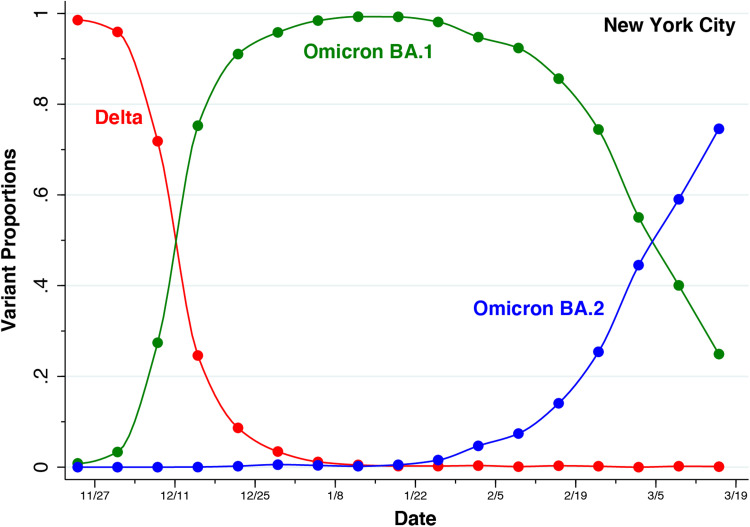
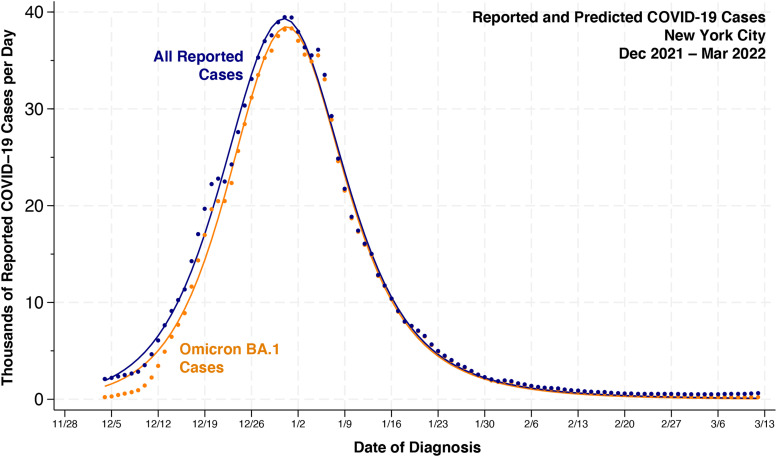
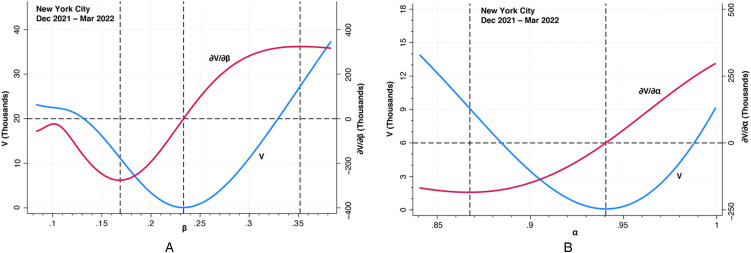
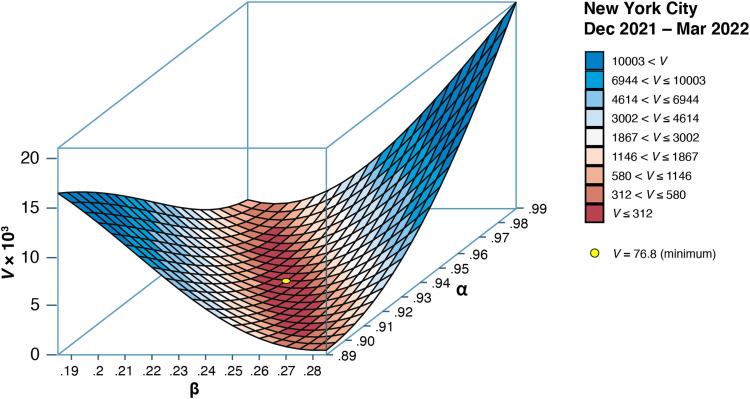
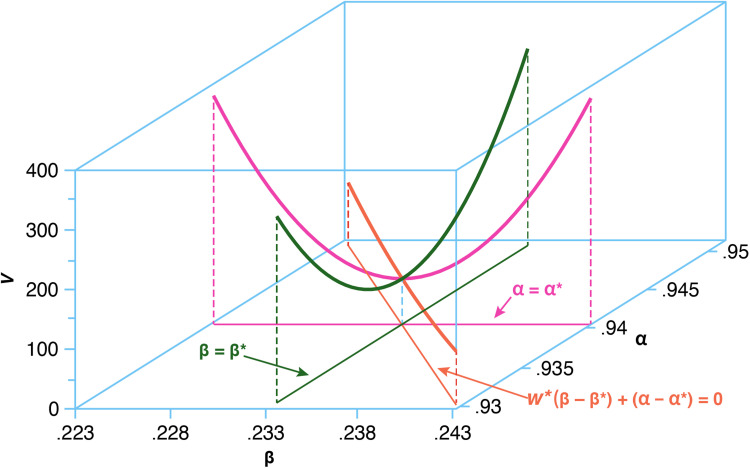
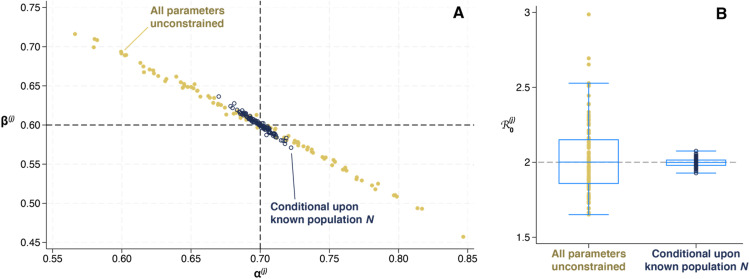
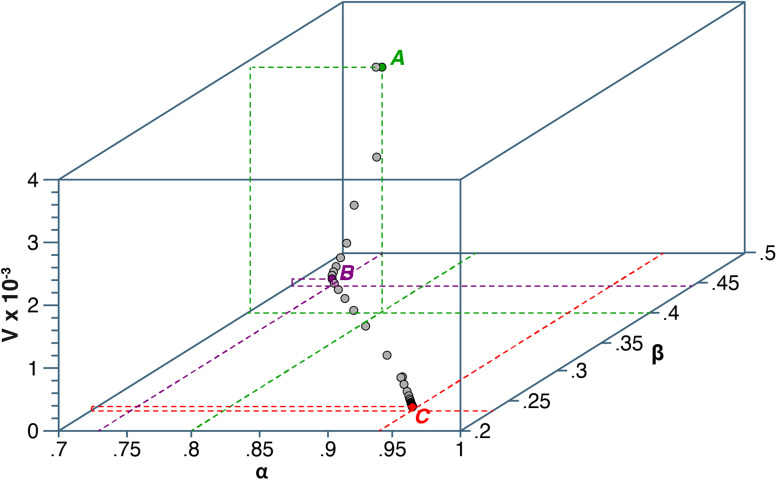
We describe a novel approach for recovering the underlying parameters of the SIR dynamic epidemic model from observed data on case incidence. We formulate a discrete-time approximation of the original continuous-time model and search for the parameter vector that minimizes the standard least squares criterion function. We show that the gradient vector and matrix of second-order derivatives of the criterion function with respect to the parameters adhere to their own systems of difference equations and thus can be exactly calculated iteratively. Applying our new approach, we estimated a four-parameter SIR model from daily reported cases of COVID-19 during the SARS-CoV-2 Omicron/BA.1 surge of December 2021-March 2022 in New York City. The estimated SIR model showed a tight fit to the observed data, but less so when we excluded residual cases attributable to the Delta variant during the initial upswing of the wave in December. Our analyses of both the real-world COVID-19 data and simulated case incidence data revealed an important problem of weak parameter identification. While our methods permitted for the separate estimation of the infection transmission parameter and the infection persistence parameter, only a linear combination of these two key parameters could be estimated with precision. The SIR model appears to be an adequate reduced-form description of the Omicron surge, but it is not necessarily the correct structural model. Prior information above and beyond case incidence data may be required to sharply identify the parameters and thus distinguish between alternative epidemic models.

Keywords: COVID-19; Newton–Raphson algorithm; Omicron variant; SARS-CoV-2; Susceptible-Infected-Removed model; heterogeneous mixing; inversion problem; nonlinear least squares; parameter identification; reduced form models; sloppy models; structural models; underreporting.


Conflict of interest statement

Declaration of conflicting interestsThe author declared no potential conflicts of interest with respect to the research, authorship, and/or publication of this article.

Figures

Figure 1.
Figure 1.
Daily reported cases of COVID-19, 12/1/2021–3/15/2022, in New York City. The connected gray datapoints show the raw case counts (ct) . The red datapoints, covering 12/4/2021–3/12/2022, show the centered 7-day moving averages (yt) . For color figure, see online version.
Figure 2.
Figure 2.
Estimates of the proportions of the Delta, Omicron BA.1, and Omicron BA.2 Variants in New York City During 11/24/2021–3/16/2022. Weekly averages (solid datapoints) were derived from a compilation maintained by the New York City Health Department. The Stata pchipolate interpolation routine was then employed to estimate the intervening days (connecting curves). The Omicron BA.2 category included strains identified as BA.2, BA.2.12.1, and BA.2.75. Not shown are the proportions of all other strains, which represented no more than 0.7 percent of total samples in any one week. For color figure, see online version.
Figure 3.
Figure 3.
Daily reported and predicted cases of COVID-19, 12/1/2021–3/15/2022, in New York City. Estimates Based Upon All Variants (Blue) and Omicron BA.1 Variant Only (Orange). Blue datapoints represent all reported cases yt , while orange datapoints represent Omicron BA.1 cases y^t=htyt . The respective blue and orange curves connect the predicted values of the output variable Xt . The displayed estimates are based upon the 4-dimensional Newton–Raphson algorithm described in Propositions 2 and 3. The estimates based upon the alternative EM procedure, described in Propositions 4 and 5, were identical. For color figure, see online version.
Figure 4.
Figure 4.
Panel A: Least squares criterion V (left axis) and first partial derivative V/β (right axis) as functions of the parameter β . Panel B: Least squares criterion V (left axis) and first partial derivative V/α (right axis) as functions of the parameter α . For color figure, see online version.
Figure 5.
Figure 5.
Least squares criterion V projected onto the (β,α) plane. The center point identifies the minimum where (β*,α*)  =  (0.233, 0.941). The parameters i0 and N were held constant at their optimum values given in Table 1. For color figure, see online version.
Figure 6.
Figure 6.
Contours of V running through the optimum point Θ projected onto the (β,α) plane. All plotted contours run through the optimum (β*,α*)= (0.233, 0.941), with the parameters i0 and N held constant at their optimum values. With β also held constant at its optimum value (green contour), the second-order derivative was 2V(θ*)/α2  = 4.912 × 10⁶. With α also held constant at its optimum value (magenta contour), the second-order derivative was 2V(θ*)/β2  = 6.075 × 10⁶. Along the ray defined by w*  = 1.073 (orange contour), the second-order directional derivative was (d2V/du2)|u=0  = 0.418 × 10⁶. For color figure, see online version.
Figure 7.
Figure 7.
Estimated parameters based upon a simulated SIR model with Gaussian Error. The SIR model of (2), (3) and (4) was simulated with assumed known parameters Θ=(β,α,io,N)=(0.6,0.7,0.04,105) over T=100 time periods. The observed case incidence was then computed as yt=Xt+εt , where the independent Gaussian errors εt were randomly drawn with zero mean and standard deviation σ=100 . Panel A: Plots of parameter estimates β(j) versus α(j) with all parameters unconstrained (gold solid points) and conditional upon a known population N (dark blue circles). Panel B: Box-and-whisker plots of the corresponding estimates R0(j) of the basic reproduction number. The boxes show the 25th, 50th, and 75th percentiles while the capped lines show the bounds of interquartile range. For color figure, see online version.
Figure B1.
Figure B1.
Path of (β(k),α(k),V(k)) through successive iterations of the 4-dimensional Newton–Raphson algorithm: New York City Omicron wave. The algorithm began at point A, where (β(0),α(0),V(0))=(0.4,0.8,3907) . The step size for successive iterations, defined in equation (16), was q=0.5. At point B, where (β(10),α(10),V(10))=(0.446,0.730,101) , the path of the algorithm had entered the ravine described in Figure 6. The path continued along the ravine until the stopping point at (β(40),α(40),V(40))=(0.233,0.941,76.7) . The stopping criterion was |V(k)V(k1)|<104 . The execution time was 0.436 s.

Similar articles

References

    1. Comunian A, Gaburro R, Giudici M. Inversion of a SIR-based model: a critical analysis about the application to COVID-19 epidemic. Physica D 2020; 413: 132674. - PMC - PubMed
    1. Kermack WO, McKendrick AG. A contribution to the mathematical theory of epidemics. Proce of the R Soc A: Math, Phys Eng Sci 1927; 115: 700–721.
    1. Postnikov EB. Estimation of COVID-19 dynamics “on a back-of-envelope”: Does the simplest SIR model provide quantitative parameters and predictions? Chaos. Solitons & Fractals 2020; 135: 1–6. - PMC - PubMed
    1. Magal P, Webb G. The parameter identification problem for SIR epidemic models: identifying unreported cases. J Math Biol 2018; 77: 1629–1648. - PubMed
    1. Schmitt FG. An algorithm for the direct estimation of the parameters of the SIR epidemic model from the I(t) dynamics. Eur Phys J Plus 2021; 137: 1–16. - PMC - PubMed

Supplementary concepts