. 2025 Jan 12;27(1):89-105.
doi: 10.1093/neuonc/noae214.

Longitudinal multimodal profiling of IDH-wildtype glioblastoma reveals the molecular evolution and cellular phenotypes underlying prognostically different treatment responses

Affiliations

Longitudinal multimodal profiling of IDH-wildtype glioblastoma reveals the molecular evolution and cellular phenotypes underlying prognostically different treatment responses

Calixto-Hope G Lucas et al. Neuro Oncol. .

Abstract

Background: Despite recent advances in the biology of IDH-wildtype glioblastoma, it remains a devastating disease with median survival of less than 2 years. However, the molecular underpinnings of the heterogeneous response to the current standard-of-care treatment regimen consisting of maximal safe resection, adjuvant radiation, and chemotherapy with temozolomide remain unknown.

Methods: Comprehensive histopathologic, genomic, and epigenomic evaluation of paired initial and recurrent glioblastoma specimens from 106 patients was performed to investigate the molecular evolution and cellular phenotypes underlying differential treatment responses.

Results: While TERT promoter mutation and CDKN2A homozygous deletion were early events during gliomagenesis shared by initial and recurrent tumors, most other recurrent genetic alterations (eg, EGFR, PTEN, and NF1) were commonly private to initial or recurrent tumors indicating acquisition later during clonal evolution. Furthermore, glioblastomas exhibited heterogeneous epigenomic evolution with subsets becoming more globally hypermethylated, hypomethylated, or remaining stable. Glioblastoma that underwent sarcomatous transformation had shorter interval to recurrence and were significantly enriched in NF1, TP53, and RB1 alterations and the mesenchymal epigenetic class. Patients who developed somatic hypermutation following temozolomide treatment had significantly longer interval to disease recurrence and prolonged overall survival, and increased methylation at 4 specific CpG sites in the promoter region of MGMT was significantly associated with this development of hypermutation. Finally, an epigenomic evolution signature incorporating change in DNA methylation levels across 347 critical CpG sites was developed that significantly correlated with clinical outcomes.

Conclusions: Glioblastoma undergoes heterogeneous genetic, epigenetic, and cellular evolution that underlies prognostically different treatment responses.

Keywords: DNA methylation; glioblastoma; gliosarcoma; molecular neuropathology; temozolomide-induced hypermutation.


Conflict of interest statement

Jennie Taylor, John de Groot, Annette Molinaro, Joseph Costello, Aaron Diaz, Susan Chang, and Mitchel Berger are members of the editorial board of Neuro-Oncology but were not involved in the handling or decision making for this manuscript. Jennie Taylor receives grant support from Bristol Myers Squibb and Servier Pharmaceuticals and serves on the advisory board for Servier Pharmaceuticals. The remaining authors declare that they have no competing interests related to this study.

Figures

Figure 1.
Figure 1.
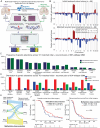
Longitudinal molecular profiling of paired initial and recurrent IDH-wildtype glioblastoma specimens from 106 patients reveals the fundamental genomic alterations underlying glioblastoma pathogenesis. (A) Schematic of the overall study design consisting of comprehensive histopathologic, genomic, and epigenomic profiling of two or more longitudinal IDH-wildtype glioblastoma tumor specimens from 106 patients. (B) Summary copy number variation plots of matched initial treatment-naïve (top) and first surgically treated recurrent (bottom) IDH-wildtype glioblastomas from 98 patients. (C) Bar plot of genetic alteration frequency for the 9 most commonly altered oncogenes and tumor suppressor genes in 101 pairs of matched initial treatment-naïve and first surgically treated recurrent IDH-wildtype glioblastomas. Abbreviations: amp = amplification; homodel = homozygous/biallelic deletion; intragenic del = intragenic deletion (eg EGFRvIII exons 2-7 deletion); mut = mutation. (D) Bar plot showing the distribution of genetic alterations in these 9 most commonly altered oncogenes and tumor suppressor genes segregated by private to initial, private to recurrence, or shared between initial and recurrent tumor specimens in the 101 IDH-wildtype glioblastoma longitudinal pairs. (E) Sankey plot of DNA methylation class assignment for 76 pairs of matched initial treatment-naïve and first surgically treated recurrent IDH-wildtype glioblastomas using the DKFZ Molecular Neuropathology classifier tool version 12.5 using a calibrated score cutoff of 0.3 for inclusion. This analysis revealed frequent epigenetic class switching at recurrence, with a predominance of the Receptor Tyrosine Kinase 2 (RTK2) methylation class at initial surgery and a predominance of the MES methylation class at recurrence. (F) Kaplan–Meier plots of overall survival from initial surgery (left) and recurrence-free survival from initial surgery (right) for 79 patients with IDH-wildtype glioblastoma stratified by methylation class evolution from initial to recurrent tumor pairs as either “stable” or “switch” based on assignment by the DKFZ Molecular Neuropathology classifier tool. Median estimated survival and 95% confidence intervals (CIs) are shown, as well as exact P-values by log-rank test.
Figure 2.
Figure 2.
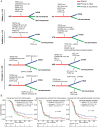
Longitudinal genomic profiling of paired initial and recurrent IDH-wildtype glioblastoma specimens from 106 patients reveals the interpatient heterogeneity of genomic evolution in response to treatment. (A) Genetic evolution dendrograms derived from targeted DNA sequencing analysis of paired initial and recurrent IDH-wildtype glioblastoma specimens illustrating 3 distinct patterns of genomic evolution which were termed “stable”, “additive”, and “divergent”. Genomic alterations that occurred early during gliomagenesis and were shared between initial and recurrent tumors are shown along the truncal red axis, whereas alterations that occurred later during tumorigenesis and were private to either initial or recurrent tumors are shown along the branched blue and green axes, respectively. Abbreviations: amp = amplification; fs = frameshift mutation; homo del = homozygous/biallelic deletion; mis = missense mutation; mut = mutation; non = nonsense mutation; splice = splice site mutation; var = variant. (B) Kaplan–Meier plots of overall survival from initial surgery (left), recurrence-free survival from initial surgery (middle), and survival from first surgically treated recurrence (right) for 101 patients with IDH-wildtype glioblastoma stratified by genomic alteration evolution as either “stable,” “additive,” or “divergent” based on targeted DNA sequencing analysis. Median estimated survival and 95% CIs are shown, as well as exact P-values by log-rank test.
Figure 3.
Figure 3.
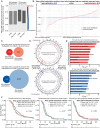
Distinct heterogeneous epigenomic evolution of IDH-wildtype glioblastomas versus IDH-mutant astrocytomas in response to therapy. (A) Box plot showing mean DNA methylation levels at each of ~850,000 interrogated CpG sites across the genome of 98 initial treatment-naïve IDH-wildtype glioblastomas, 98 matched recurrent posttreatment IDH-wildtype glioblastomas, 14 initial treatment-naïve IDH-mutant astrocytomas, and 17 recurrent posttreatment IDH-mutant astrocytomas. (B) Lollipop plot of the mean global DNA methylation β-value for all 850,000 CpG sites from initial tumor specimen (blue) to recurrent tumor specimen (red) for 98 patients with IDH-wildtype glioblastoma and 7 patients with IDH-mutant astrocytoma for comparison. The amount of shift on the y-axis between the initial and recurrent tumor specimen represents the change in mean global DNA methylation levels across the entire genome for each individual patient. Some IDH-wildtype glioblastomas became more globally methylated from initial to recurrent tumor specimens (hypermethylation shift), some are relatively stable, and some become less globally methylated (hypomethylation shift). (C) Venn diagrams showing the number and overlap of the ~850,000 interrogated CpG sites that consistently become more methylated (red) or less methylated (blue) from initial to recurrent tumor specimens in 98 pairs of IDH-wildtype glioblastomas and 7 pairs of IDH-mutant astrocytomas (supplemented with additional unpaired tumor specimens, 7 initial and 10 recurrent). (D) Circos plots showing the genome mapping of the specific CpG sites that undergo consistent epigenomic evolution in IDH-wildtype glioblastoma versus IDH-mutant astrocytoma. Outermost rings show the chromosome position. The top plot with red peaks shows the CpG sites that become more methylated from initial to recurrent tumor specimens, while the bottom plot with blue peaks shows the CpG sites that become less methylated from initial to recurrent specimens. Middle rings show the 260 CpG sites that consistently become more methylated (light red) and 18,535 CpG sites that consistently become less methylated (light blue) in IDH-mutant astrocytomas. Innermost rings show the 110 CpG sites that consistently become more methylated (dark red) and 151 CpG sites that consistently become less methylated (dark blue) in IDH-wildtype glioblastomas. (E) Gene Ontology biological processes that are significantly enriched (P < .05) in genes containing the most differentially methylated CpG sites between 98 initial treatment-naive IDH-wildtype glioblastomas and their matched recurrent posttreatment tumor specimens. (F) Kaplan–Meier plots of overall survival from initial surgery (left), recurrence-free survival from initial surgery (middle), and survival from first surgically treated recurrence (right) for 98 patients with IDH-wildtype glioblastoma stratified by mean global methylation evolution as hypermethylation shift, stable, or hypomethylation shift. Median estimated survival and 95% CIs are shown, as well as exact P-values by log-rank test.
Figure 4.
Figure 4.
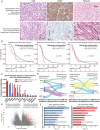
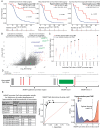
Sarcomatous transformation of IDH-wildtype glioblastoma at recurrence is determined by a unique cell state with a distinct molecular signature at initial resection before therapy. (A) Histopathology images of an initial treatment-naïve glioblastoma (top panels) show tumor cells with fibrillary glial processes, diffuse GFAP expression, and absence of intercellular reticulin meshwork. At the time of recurrence following adjuvant radiation and temozolomide chemotherapy, this glioblastoma developed MES transdifferentiation (bottom panels) with spindled tumor cells arranged in fascicles, loss of GFAP expression, and intercellular reticulin deposition. Scale bar = 100 μm. (B) Kaplan–Meier plots of overall survival from initial surgery (left), recurrence-free survival from initial surgery (middle), and survival from first surgically treated recurrence (right) for 106 patients with IDH-wildtype glioblastoma stratified by sarcomatous transformation at recurrence or not. Median estimated survival and 95% CIs are shown, as well as exact P-values by log-rank test. (C) Bar plot of genetic alteration frequency for the 12 most commonly altered oncogenes and tumor suppressor genes in 101 initial treatment-naïve IDH-wildtype glioblastomas stratified by sarcomatous transformation at recurrence or not. Asterisks denote significant (P < .05) differences in genetic alteration frequency, specifically decreased EGFR and increased TP53, NF1, and RB1 alterations in those tumors that transformed to gliosarcoma at recurrence. (D) Sankey plots of DNA methylation class assignment for matched initial treatment-naïve and first surgically treated recurrent IDH-wildtype glioblastomas using the DKFZ Molecular Neuropathology classifier tool version 12.5, stratified by the 10 tumors that transformed to gliosarcoma at recurrence (left) and the 66 tumors that did not transform to gliosarcoma. This analysis revealed enrichment for the MES methylation class and an absence of the RTK2 methylation class among those glioblastomas that underwent sarcomatous transformation. Additionally, there was enrichment for the novel MES B methylation subclass in those recurrent glioblastomas with sarcomatous transformation which was absent in those recurrent glioblastomas without sarcomatous transformation. (E) Volcano plot of genome-wide DNA methylation data from initial treatment-naïve glioblastoma tumor specimens that later transformed to gliosarcoma at the time of recurrence (n = 17) versus those that did not (n = 81). Each dot represents an individual CpG site in the genome that DNA methylation levels were interrogated at across the 98 initial treatment-naïve IDH-wildtype glioblastoma tumor samples. Blue dots on the left side of the plot represent those CpG sites which are significantly (P < .001) more methylated in those glioblastomas that transformed to gliosarcoma versus those that did not. Red dots on the right side of the plot represent those CpG sites which are significantly less methylated in those glioblastomas that transformed to gliosarcoma versus those that did not. (F) Gene Ontology biological processes that are significantly enriched (P < .001) in genes containing the most differentially methylated CpG sites in their upstream regulatory regions in those glioblastomas that transformed to gliosarcoma versus those that did not.
Figure 5.
Figure 5.
Development of somatic hypermutation in response to alkylating chemotherapy with temozolomide for IDH-wildtype glioblastoma is dictated by DNA methylation at specific CpG sites in the promoter regions of MGMT and KCNQ1DN. (A) Kaplan–Meier plots of overall survival from initial surgery (left), recurrence-free survival from initial surgery (middle), and survival from first surgically treated recurrence (right) for 106 patients with IDH-wildtype glioblastoma stratified by the development of somatic hypermutation at recurrence following temozolomide treatment. Median estimated survival and 95% CIs are shown, as well as exact P-values by log-rank test. (B) Volcano plot of genome-wide DNA methylation data from initial treatment-naïve glioblastoma tumor specimens that became hypermutated at the time of recurrence following TMZ treatment (n = 12) versus those that did not (n = 87). Each dot represents an individual CpG site in the genome that DNA methylation levels were interrogated at across 99 initial treatment-naïve IDH-wildtype glioblastoma tumor samples. Red dots on the right side of the plot represent those CpG sites which are significantly (P < .01) more methylated in those glioblastomas that became hypermutated at recurrence following treatment with temozolomide versus those that did not, which include multiple CpG sites in the upstream promoter region of the MGMT and KCNQ1DN genes. Blue dots on the left side of the plot represent those CpG sites which are significantly less methylated in those glioblastomas that became hypermutated at recurrence following treatment with temozolomide versus those that did not. (C) Scatter plot of mean DNA methylation values at the 12 interrogated CpG sites in the upstream regulatory region of MGMT in 99 initial treatment-naïve IDH-wildtype glioblastomas stratified by those that became hypermutated at recurrence following treatment with temozolomide versus those that did not. Asterisks mark the 4 CpG sites with significant differences in the mean DNA methylation β-values between the two subgroups. (D) Diagram of the upstream promoter region of MGMT showing the 12 interrogated CpG sites. Asterisks mark the 4 critical CpG sites (red bars) within the MGMT promoter whose differential methylation in initial treatment-naïve glioblastomas dictates whether they will go on to become hypermutated at the time of recurrence following TMZ treatment. No significant differences in DNA methylation levels were found at the other 8 CpG sites (gray bars). (E) Analysis determining the optimal DNA methylation β-value cutoffs for each of the 4 critical CpG sites in the MGMT promoter region and the optimal binning for a quantity of these 4 CpG sites above the cutoff for predicting whether an initial treatment-naïve IDH-wildtype glioblastoma is likely to develop somatic hypermutation at recurrence following treatment with temozolomide. Abbreviation: AUC = area under the curve.
Figure 6.
Figure 6.
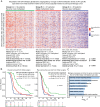
DNA methylation evolution at 347 specific CpG sites across the genome correlates with survival for patients with IDH-wildtype glioblastoma. (A) Heatmap of the DNA methylation β-value change (Δβ value) from initial treatment-naïve tumor to recurrent posttreatment tumor specimens at 347 CpG sites (rows) for a cohort of 98 patients (columns) with IDH-wildtype glioblastoma. The DNA methylation evolution at these 347 specific CpG sites segregated the patient cohort into 3 groups that significantly correlated with interval from initial resection to recurrence (P < .001), enhancing tumor volume at recurrence (P = .029), and overall survival (P < .001). Group A was composed of those patients whose tumors became more methylated at these 347 CpG sites from initial to recurrent tumors and was associated with superior survival, whereas Group C was composed of those patients whose tumors became less methylated at these 347 CpG sites from initial to recurrent tumors and was associated with inferior survival. (B) Kaplan–Meier plots of overall survival from initial surgery (left) and recurrence-free survival from initial surgery (right) for 98 patients with IDH-wildtype glioblastoma stratified by the 347 CpG site DNA methylation evolution subgroups. Median estimated survival and 95% CIs are shown, as well as exact P-values by log-rank test. (C) Gene Ontology biological processes that are significantly enriched (P < .01) in genes containing the 347 CpG sites composing the DNA methylation evolution signature for IDH-wildtype glioblastoma.

References

    1. Stupp R, Mason WP, van den Bent MJ, et al.Radiotherapy plus concomitant and adjuvant temozolomide for glioblastoma. N Engl J Med. 2005; 352(10):987–996. - PubMed
    1. Young JS, Morshed RA, Hervey-Jumper SL, Berger MS.. The surgical management of diffuse gliomas: current state of neurosurgical management and future directions. Neuro-Oncology. 2023; 25(12):2117–2133. - PMC - PubMed
    1. Johnson BE, Mazor T, Hong C, et al.Mutational analysis reveals the origin and therapy-driven evolution of recurrent glioma. Science. 2014; 343(6167):189–193. - PMC - PubMed
    1. van Thuijl HF, Mazor T, Johnson BE, et al.Evolution of DNA repair defects during malignant progression of low-grade gliomas after temozolomide treatment. Acta Neuropathol. 2015; 129(4):597–607. - PMC - PubMed
    1. Kim H, Zheng S, Amini SS, et al.Whole-genome and multisector exome sequencing of primary and post-treatment glioblastoma reveals patterns of tumor evolution. Genome Res. 2015; 25(3):316–327. - PMC - PubMed

MeSH terms