. 2024 Nov;13(22):e70401.
doi: 10.1002/cam4.70401.

A Combinatorial Functional Precision Medicine Platform for Rapid Therapeutic Response Prediction in AML

Affiliations

A Combinatorial Functional Precision Medicine Platform for Rapid Therapeutic Response Prediction in AML

Noor Rashidha Binte Meera Sahib et al. Cancer Med. 2024 Nov.

Abstract

Background: Despite advances made in targeted biomarker-based therapy for acute myeloid leukemia (AML) treatment, remission is often short and followed by relapse and acquired resistance. Functional precision medicine (FPM) efforts have been shown to improve therapy selection guidance by incorporating comprehensive biological data to tailor individual treatment. However, effectively managing complex biological data, while also ensuring rapid conversion of actionable insights into clinical utility remains challenging.

Methods: We have evaluated the clinical applicability of quadratic phenotypic optimization platform (QPOP), to predict clinical response to combination therapies in AML and reveal patient-centric insights into combination therapy sensitivities. In this prospective study, 51 primary samples from newly diagnosed (ND) or refractory/relapsed (R/R) AML patients were evaluated by QPOP following ex vivo drug testing.

Results: Individualized drug sensitivity reports were generated in 55/63 (87.3%) patient samples with a median turnaround time of 5 (4-10) days from sample collection to report generation. To evaluate clinical feasibility, QPOP-predicted response was compared to clinical treatment outcomes and indicated concordant results with 83.3% sensitivity and 90.9% specificity and an overall 86.2% accuracy. Serial QPOP analysis in a FLT3-mutant patient sample indicated decreased FLT3 inhibitor (FLT3i) sensitivity, which is concordant with increasing FLT3 allelic burden and drug resistance development. Forkhead box M1 (FOXM1)-AKT signaling was subsequently identified to contribute to resistance to FLT3i.

Conclusion: Overall, this study demonstrates the feasibility of applying QPOP as a functional combinatorial precision medicine platform to predict therapeutic sensitivities in AML and provides the basis for prospective clinical trials evaluating ex vivo-guided combination therapy.

Keywords: AML; FLT3; combinatorial drug sensitivity; functional precision medicine.


Conflict of interest statement

M.O. received honoraria from Jenssen, Novartis, Astellas, AbbVie, Pfizer Amgen, and Bristol‐Myers Squibb. E.K.H.C. is a shareholder of KYAN Technologies.

Figures

FIGURE 1
FIGURE 1
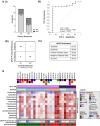
Overall workflow of QPOP study and summary of patient characteristics. (A) The schematic figure indicates the workflow from patient sample collection to QPOP analysis and clinical feedback (Created in BioRender. Meera Sahib, N. (2024) https://BioRender.com/a92n028). (B) Fifty‐one unique AML patients were recruited for QPOP drug combination testing and 55 out of 59 QPOP runs had data generated. (C) Median turnover time for QPOP report was 5 days which is suitable in a clinically relevant timeframe. (D) The heatmap summarizes patient characteristics, and drug panel and concentrations used for each individual QPOP run. The “highest in‐vitro conc.” represents the range in which the highest drug concentration used for each drug per QPOP run falls within.
FIGURE 2
FIGURE 2
Clinical concordance of 29 evaluable patients with standard QPOP drug set and single drug viability of concordant patients. (A) (i) Overall clinical response for the 29 QPOP runs with evaluable data and standardized QPOP dosing and drug set. (ii) The ROC curve (receiver operating characteristic curve) indicates the performance of QPOP has an AUC value of 0.808. (iii) and (iv) indicate the overall QPOP‐predicted response with respect to clinical outcomes and the statistical evaluation of the response. (B) Average normalized cell viability (NCV) scores of single drugs of the 25 patients with concordant clinical data were analyzed and patients with adverse risk or R/R had an overall poorer NCV score compared to ND or those with favorable risk. QPOP‐predicted NCV scores of combination therapy given and actual clinical response was concordant. NCV of individual drugs does not fully reflect combinatorial response.
FIGURE 3
FIGURE 3
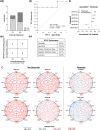
Clinical concordance of AZA‐VEN‐treated patients. (A) (i) Overall clinical response of 11 patients treated with azacytidine and venetoclax drug combination post QPOP. (ii) The ROC curve (receiver operating characteristic curve) indicates the performance of QPOP has an AUC value of 0.867. (iii) and (iv) indicate the QPOP‐predicted response with respect to clinical outcomes to AZA–VEN treatment and the statistical evaluation of the response. (B) The Forrest plot indicates the normalized cell viability of six patients treated with AZA–VEN and patients with lower cell viability were predicted to be clinical responders. Clinical outcomes are concordant and reflective of QPOP‐predicted outcomes. (C) Polygonograms of six representative patients indicate all two drug interactions specific to each individual patient. All four clinical non‐responders had poor viability scores (> 0.5) compared to two clinical responders to AZA–VEN who had better viability scores (< 0.5).
FIGURE 4
FIGURE 4
Fludarabine‐based combinations among most frequently occurring top‐ranked combinations. (A) Upset plot indicating the most frequently occurring top‐ranking two‐drug combinations among 25 evaluable patient data identified as fludarabine and cytarabine followed by fludarabine and venetoclax. (B) Comparison of AZA–VEN standard of care to top ranking fludarabine and cytarabine combination based on (i) diagnosis stage (ND: p = 0.0003, R/R: p = 0.0590 with paired t‐test) and (ii) ELN risk (favorable risk: p = 0.0205, intermediate risk: p = 0.0051, adverse risk: p = 0.0662 with paired t‐test). (C) Comparison of AZA–VEN standard of care to top ranking fludarabine and venetoclax combination based on (i) diagnosis stage (ND: p = 0.0087, R/R: p = 0.0189 with paired t‐test) and (ii) ELN risk (favorable risk: p = 0.0352, intermediate risk: p = 0.0333, adverse risk: p = 0.0748 with paired t‐test).
FIGURE 5
FIGURE 5
Targeted therapy identification with QPOP in a case study of Patient A. (A) QPOP accurately identified midostaurin‐based combinations among top‐ranking two‐ and three‐drug combinations in patient A who displayed FLT3‐ITD mutations in clinical testing. (B) Consecutive QPOP runs on patient A over 3 months indicated higher cell viability scores to FLT3i midostaurin and its combinations which was concordant with patient's increasing resistance to therapy and increasing FLT3‐ITD mutation allelic ratio. (C) Increasing resistance to FLT3i‐based combinations was associated with an increase in phosphorylated AKT expression in patient A as seen in western blot analysis and quantification.
FIGURE 6
FIGURE 6
Resistance to FLT3 inhibitors and pAKT‐FOXM1 pathway. (A) IC50 curves of midostaurin and AKT inhibitor MK2206 as a single drug and combination in MV4‐11‐R cell line in comparison to MV4‐11 parental line. (B) Venn diagram indicating the common differentially expressed genes among the different treatment groups in MV4‐11‐R and MV4‐11. (C) FOXM1 was identified as the most differentially expressed gene among targets involved in both AKT and DDR pathways. (D) Western blot analysis shows increased FOXM1 protein expression in parent vs isogenic resistant line. (E) Combination of midostaurin and AKT inhibitor MK2206 resulted in decreased FOXM1 and pAKT expression and an increase in cleaved PARP expression. This indicates that AKT inhibitors restore sensitivity to midostaurin treatment in resistant cell line. (F) Loss of function of FOXM1 gene restores sensitivity to midostaurin. FOXM1 KD line showed (i) reduced IC50 concentration of midostaurin compared to control MV4‐11‐R and indicated (ii) reduced pAKT expression compared to control. (G) FLT3 patients with known clinical non‐response to FLT3 inhibitor therapy indicated high pAKT expression. While patients with complete response to FLT3 inhibitors had low pAKT expression.

Similar articles

Cited by

References

    1. DiNardo C. D. and Cortes J. E., “Mutations in AML: Prognostic and Therapeutic Implications,” Hematology 2014, the American Society of Hematology Education Program Book 2016 (2016): 348–355. - PMC - PubMed
    1. Consortium, A. P. G , et al., “AACR Project GENIE: Powering Precision Medicine Through an International Consortium,” Cancer Discovery 7 (2017): 818–831. - PMC - PubMed
    1. Xiang W., Lam Y. H., Periyasamy G., and Chuah C., “Application of High Throughput Technologies in the Development of Acute Myeloid Leukemia Therapy: Challenges and Progress,” International Journal of Molecular Sciences 23 (2022): 2863. - PMC - PubMed
    1. Spinner M. A., Aleshin A., Santaguida M. T., et al., “ Ex Vivo Drug Screening Defines Novel Drug Sensitivity Patterns for Informing Personalized Therapy in Myeloid Neoplasms,” Blood Advances 4 (2020): 2768–2778. - PMC - PubMed
    1. Small S., Oh T. S., and Platanias L. C., “Role of Biomarkers in the Management of Acute Myeloid Leukemia,” International Journal of Molecular Sciences 23 (2022): 14543. - PMC - PubMed

MeSH terms