. 2024 Nov 26;121(48):e2406239121.
doi: 10.1073/pnas.2406239121. Epub 2024 Nov 19.

Small-molecule disruption of androgen receptor-dependent chromatin clusters

Affiliations

Small-molecule disruption of androgen receptor-dependent chromatin clusters

Sarah E Kohrt et al. Proc Natl Acad Sci U S A. .

Abstract

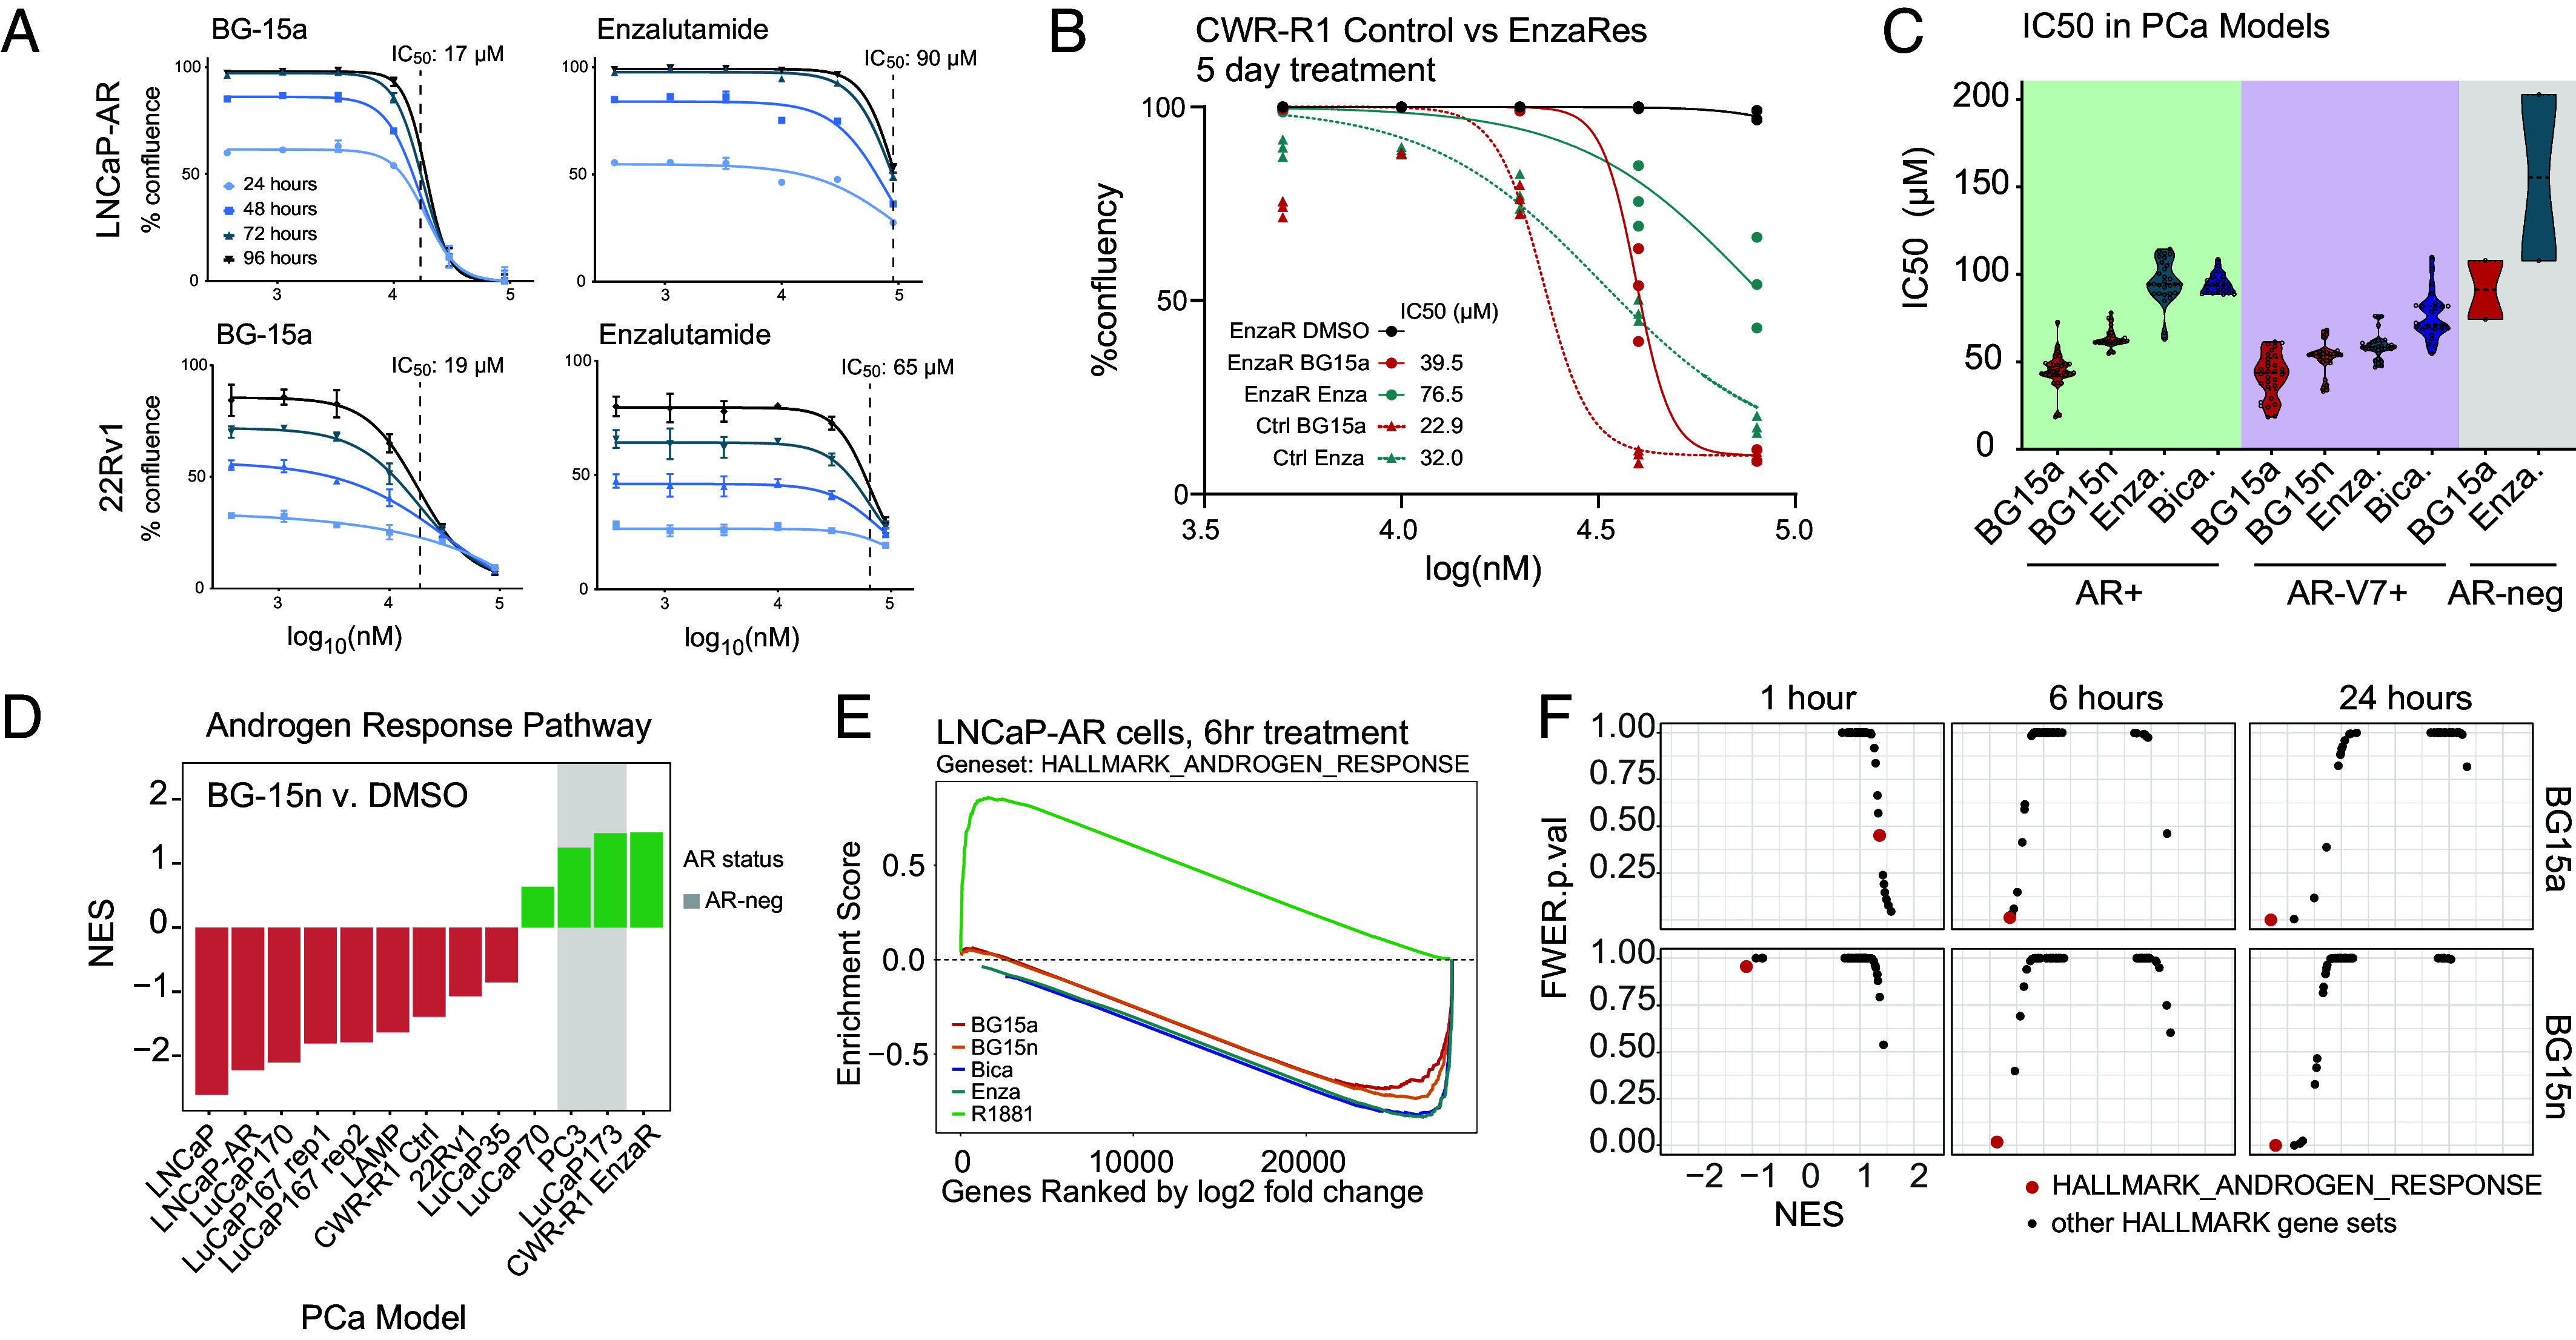
Sustained androgen receptor (AR) signaling during relapse is a central driver of metastatic castration-resistant prostate cancer (mCRPC). Current AR antagonists, such as enzalutamide, fail to provide long-term benefit for the mCRPC patients who have dramatic increases in AR expression. Here, we report AR antagonists with efficacy in AR-overexpressing models. These molecules bind to the ligand-binding domain of the AR, promote AR localization to the nucleus, yet potently and selectively down-regulate AR-target genes. The molecules BG-15a and the pharmacokinetically optimized BG-15n elicit a decrease in cell and tumor growth in vitro and in vivo in models of mCRPC. BG-15a/n treatment causes the collapse of chromatin loops between enhancers and promoters at key genes in the AR-driven epigenome. AR binding in the promoter, as well as 3D chromatin clustering, is needed for genes to respond. BG-15a/n represent promising agents for treating patients with relapsed AR-driven mCRPC tumors.

Keywords: androgen receptor; chromatin architecture; epigenetics; gene regulation; prostate cancer.


Conflict of interest statement

Competing interests statement:E.C. received research funding under institutional SRA from Janssen Research and Development, Bayer Pharmaceuticals, KronosBio, Forma Pharmaceutics Foghorn, Gilead, Sanofi, AbbVie, MacrogGenics, Astra Zeneca, GSK, and K36. B.E.G., A.K.O., S.T., W.D.F., and J.S. are co-inventors on a patent covering this technology (WO2021150603A1). P.S.N. receives personal fees from Janssen, Bristol Myers Squibb, Pfizer, and Merck and grants from Janssen. The other authors declare no competing interests.

Figures

Fig. 1.
Fig. 1.
Chemical determinants of AR-targeted activity. (A) Diagram showing the medicinal chemistry optimization strategy for the BG series of molecules described in this paper. (B) Small chemical modifications cause significant changes in AR binding affinity, such as the oxygen to sulfur change from 14a to 15a. (C) Chemical structure and calculated logP (octanol:water partition coefficient) of BG-15a and BG-15n. BG-15n has improved solubility compared to BG-15a and is therefore hypothesized to be more suitable for downstream in vivo studies. Compounds are dissolved in 100% labrasol or 1:6 dilution of labrasol in saline with 5% sucrose. (D) Phylogenic trees showing relationship of nuclear hormone receptors and affinity to BG-15a or BG-15n, compared to enzalutamide. Binding affinity measured by radioligand binding affinity assay in hAR with testosterone. Response average is a measure of nuclear receptor binding as Ki values in µM. (E) Proposed model of AR-ligand-binding domains interacting with an L/I-X-X-L/I-L/I motif, represented here by AR Tau1 helix, and forming a dimer in the presence of BG15a. (F) BG15a in the pocket of AR LBD and Tau1, with hydrogen bonds forming between the molecule and R753, Q712, and E710. (G) Modifications to improve solubility do not impede AR-transcriptional activity. The bar chart shows AR promoter-based luciferase assay [pAR-Luc (Signosis LR-2105)] in mCRPC cell line VCaP cells grown in CSS and 10 nM R1881 and dose with 10 µM of enzalutamide, BG-15a, or BG-15n.
Fig. 2.
Fig. 2.
Lead compounds decrease AR transcriptional activity while promoting localization into the nucleus. (A) Left: Heatmap of AR transcriptional activity measured by luciferase in a combination matrix dose response to R1881 and BG15-a in LNCaP cells grown in CSS. Right: Transcriptional activity of BG-15a, BG-15n, and enzalutamide in prostate cancer cell line VCaP, measured by AR-promoter-based luciferase assay in media supplemented with CSS and 10 nM of R1881. The line plot shows total detected luminescent signal normalized to vehicle signal. (B) AR-GFP cellular localization measured as nuclear to cytoplasmic ratio influenced by testosterone, enzalutamide, BG-15a, or BG-16 in murine cells (Left). Compound structures for enzalutamide, BG-15a, or BG-16 (Right), highlighting the flexible LBD extrusion moiety of BG-15a. (C) Exogenous GFP-AR construct in HEK293T cells treated with vehicle, BG-15a, or enzalutamide. Cells were grown in CSS. Nuclei are stained with DAPI. (D) Immunofluorescence staining of AR in LNCaP-AR cells (Above) at increased magnification and deconvolution showing AR puncta in the nucleus. Cells were stained with DAPI and with anti-AR antibodies. Nuclei are artificially circled with dotted white line. (E) Puncta size was calculated as a %area of each puncta over a threshold signal intensity compared to the entire image. Bar plots represent a sum of all nuclei per image with each point representative of a single puncta. *P < 0.05, ***P < 0.0001. (F) Quantification of localization of AR puncta in the cytoplasm of the nucleus of each treatment group. Calculations are based on the signal intensity above a given threshold within or outside of the drawn nuclei as determined by the DAPI staining. (G) RNA-sequencing data from LNCaP-AR cells treated with R1881 or BG-15n. The expression level of AR target genes KLK3 and TMPRSS2 is shown as a log2 fold change compared to vehicle control.
Fig. 3.
Fig. 3.
AR antagonists reduce PCa cell growth and inhibit AR target genes. (A) Dose response of cell growth in LNCaP-AR cells (Top) and 22Rv1 cells (Bottom) treated with BG-15a (Left) or enzalutamide (Right). Cells were grown in regular FBS with no added androgens. Growth was measured as the percent cell confluence at 24, 48, 72, and 96 h. Error bars show the SE of measurement from triplicate wells. IC50 values are shown for the 72-h time point. (B) IC50 values for CWR-R1 cells that are controls or enzalutamide resistant treated with BG-15a or enzalutamide. BG-15a continues to be effective in enzalutamide-resistant cells. Cells were grown in regular FBS with no added androgens. (C) Violin plots of cumulative IC50 scores across AR-positive, AR-V7 positive, or AR-negative PCa cell lines. Point within plots represent different cell lines treated with BG15a, BG15n, enzalutamide, or bicalutamide. Median (solid black line) and quartiles (dotted black lines) are represented in each violin plot. Cells were grown in regular FBS with no added androgens. (D) RNA-sequencing data for a panel of PCa models treated with BG-15n represented as GSEA normalized enrichment scores (NES) for the Hallmark Androgen Response pathway. PCa models that are AR-negative are highlighted in gray. (E) GSEA analysis of the Hallmark Androgen Response geneset for LNCaP-AR cells treated for 6 h with R1881, BG-15a, BG-15n, enzalutamide, or bicalutamide. (F) Scatter plots of FWER p-values plotted against NES of GSEA analysis of the Hallmark Androgen Response geneset in a panel of CRPC cell lines and PDX models treated with BG-15a or BG-15n, compared to matched vehicle.
Fig. 4.
Fig. 4.
Preclinical efficacy, bioavailability, and safety. (A) Heatmap of proliferation in LuCaP models in dose response of enzalutamide and BG-15n ex vivo after 5 d of treatment. (B) Boxplot of LuCaP 35 PDX ex vivo proliferation change by day 5 of control compared to increasing concentrations of enzalutamide or BG-15n treatment. In box plots, the center line shows median, box edges mark quartiles 1 and 3, and whiskers span minimum to maximum range. (C) Plot of LuCaP167 PDX grown in vivo over the course of 3 wk of treatment with vehicle or BG-15n at 20 mg/kg. Xenograft growth is displayed as a relative growth percentage normalized to treatment day 0 size. (D) GSEA hallmark response of the Hallmark Androgen Response Pathway geneset from in vivo LuCaP167 tumors. The curve represents log2(fold change) for BG-15n compared to DMSO. (E and F) Pharmacokinetics of BG-15a and BG-15n after 20 mg/kg oral gavage (PO, E) and 1 mg/kg intravenous injection (IV, F) over 12 h. Error bars represent the SD in ng/mL from three independent mice per time point. (G) Microsome metabolic assay results represented as the calculated half-life of the molecules. (H) Results of a Parallel Artificial Membrane Permeability Assay (PAMPA, pH 6.5) to show permeability (Left) of the molecules into a cell and the percentage of molecule recovered (Right). (I) Binding of test compounds BG-15a and BG-15n compared to enzalutamide and positive controls in ion channel assays, represented as % inhibition.
Fig. 5.
Fig. 5.
BG-15n modulates AR chromatin binding and histone acetylation. (A) Analysis of AR chromatin binding and self-association using PAPA and fast single-molecule tracking (fSMT). Left panel: Working principle of PAPA. Excitation of a sender fluorophore coupled to Halo-AR reactivates an adjacent receiver fluorophore coupled to SNAPf-AR, providing a measure of AR self-association. Relative PAPA signal (Middle panel) and overall fraction bound of SNAPf-AR (Right panel) in cells coexpressing Halo-AR and SNAPf-AR that were treated with the indicated drugs at 20 µM for 6 h. (B) AR ChIP-qPCR (Top) and AR HiChIP (Bottom) at the PSA enhancer region in LNCaP-AR cells. Cells treated with BG-15n for 1, 6, or 24 h, and compared to matched DMSO. Boxplot shows means and SD of triplicates per condition. (C) Heatmap of H3K27ac signal (CUT&RUN) in LNCaP-AR cells with BG-15n treatment (30 µM, 48 h) compared to DMSO, and greater AR binding in regions of H3K27ac loss. (D) MA plot comparison for log2(Fold Change, BG15n vs. DMSO) of H3K27ac binding (RRPM) compared to maximum H3K27ac signal with or without AR binding overlap. MA plot; log ratio and mean average scale plot. CUT&RUN data generated from LNCaP-AR cells with BG-15n treatment (30 µM, 48 h) or DMSO.
Fig. 6.
Fig. 6.
BG-15n causes the AR to suppress H3K27ac enhancer clusters. (A) Genome browser view of the PSA cluster containing KLK2 and KLK3, showing H3K27ac clustered loops and associated HiChIP signal, AR loops and associated AR HiChIP signal, and CTCF loops with associated CTCF HiChIP signal. (B) LNCaP-AR HiChIP identified genome-wide loops for AR, H3K27ac, and CTCF binding across promoters, enhancers, or insulators. Represented as percentages of total connectivity. (C) APA (Aggregate Peak Analysis) plots for H3K27ac AQuA-HiChIP (Top) and AR AQuA-HiChIP (Bottom) in LNCaP-AR cells treated with DMSO (Left), BG-15n (Center), or the delta of BG-15n compared to DMSO (Right). BG-15n treatment was for 24 h at 20 µM in LNCaP-AR cells. AQuA CPM is represented as bins of ±1 kB or H3K27ac or AR anchors (Top). AQuA, Absolute Quantification of Architecture; CPM, contacts per million. (D) Change in H3K27ac AQuA-HiChIP signal at AR loops after treatment with BG-15a, enzalutamide, or bicalutamide. Each treatment was for 24 h at 20 µM in LNCaP-AR cells. (E) Pie-chart of gene sensitivity to BG-15n treatment based on inclusion in a peak cluster. Example AR-target genes shown below for responsive genes in clusters with multiple AR peaks, and nonresponsive genes in clusters having only one AR peak. (F) Responsiveness of genes to BG-15n grouped by quantile of combined enhancer strength (H3K27ac deposition), either without (Left) or with AR binding to each gene’s promoter region (Right). RNA-seq was performed with DMSO or BG-15n treatment for 24 h at 20 µM in LNCaP-AR cells. (G) Model of BG15n action, causing AR to localize to enhancer–promoter regions of prostate cancer genes, but shutting down active H3K27ac and chromatin folding.

References

    1. Siegel R., Naishadham D., Jemal A., Cancer statistics, 2012. CA Cancer J. Clin. 62, 10–29 (2012), 10.3322/caac.20138. - DOI - PubMed
    1. Pirtskhalaishvili G., Hrebinko R. L., Nelson J. B., The treatment of prostate cancer—An overview of current options. Cancer Pract. 9, 295–306 (2001). - PubMed
    1. Antonarakis E. S., et al. , AR-V7 and resistance to enzalutamide and abiraterone in prostate cancer. N. Engl. J. Med. 371, 1028–1038 (2014), 10.1056/NEJMoa1315815. - DOI - PMC - PubMed
    1. Merkens L., et al. , Aggressive variants of prostate cancer: Underlying mechanisms of neuroendocrine transdifferentiation. J. Exp. Clin. Cancer Res. 41, 46 (2022), 10.1186/s13046-022-02255-y. - DOI - PMC - PubMed
    1. Chen C. D., et al. , Molecular determinants of resistance to antiandrogen therapy. Nat. Med. 10, 33–39 (2004), 10.1038/nm972. - DOI - PubMed

MeSH terms

LinkOut - more resources