. 2024 Dec 2;221(12):e20230079.
doi: 10.1084/jem.20230079. Epub 2024 Nov 19.

Immunomolecular and reactivity landscapes of gut IgA subclasses in homeostasis and inflammatory bowel disease

Affiliations

Immunomolecular and reactivity landscapes of gut IgA subclasses in homeostasis and inflammatory bowel disease

Sonia Tejedor Vaquero et al. J Exp Med. .

Abstract

The human gut includes plasma cells (PCs) expressing immunoglobulin A1 (IgA1) or IgA2, two structurally distinct IgA subclasses with elusive regulation, function, and reactivity. We show here that intestinal IgA1+ and IgA2+ PCs co-emerged early in life, comparably accumulated somatic mutations, and were enriched within short-lived CD19+ and long-lived CD19- PC subsets, respectively. IgA2+ PCs were extensively clonally related to IgA1+ PCs and a subset of them presumably emerged from IgA1+ precursors. Of note, secretory IgA1 (SIgA1) and SIgA2 dually coated a large fraction of mucus-embedded bacteria, including Akkermansia muciniphila. Disruption of homeostasis by inflammatory bowel disease (IBD) was associated with an increase in actively proliferating IgA1+ plasmablasts, a depletion in long-lived IgA2+ PCs, and increased SIgA1+SIgA2+ gut microbiota. Such increase featured enhanced IgA1 reactivity to pathobionts, including Escherichia coli, combined with depletion of beneficial A. muciniphila. Thus, gut IgA1 and IgA2 emerge from clonally related PCs and show unique changes in both frequency and reactivity in IBD.


Conflict of interest statement

Disclosures: L. Comerma reported personal fees from Roche, MSD, AstraZeneca, and Diaceutics and non-financial support from Roche, MSD, AstraZeneca, and Phillips outside the submitted work. M. Iglesias reported personal fees from Bristol Myers Squibb, Merck Sharp & Dohme, Roche, Astellas, Merck, Agilent, and Seagen outside the submitted work. No other disclosures were reported.

Figures

None
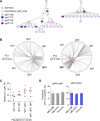
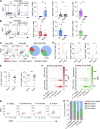
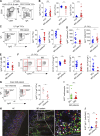
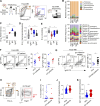
Graphical abstract
Figure 1.
Figure 1.
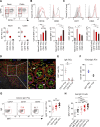
Human intestinal IgA2 emerges along with IgA1 early in life and in adults predominates in distal gut segments. (A) IFA of IgA1 (green), IgA2 (red), and nuclear DNA (blue) in prenatal (fetal) or postnatal (neonatal, infant, and child) human gut tissues. Original magnification, 20×; scale bar, 50 µm. (B) Numbers of IgA1+ and IgA2+ cells per mm2 in gut tissue from fetal (20–36 wk; n = 5), neonatal (1–12 days [d]; n = 5), infant (35–64 days; n = 3), and child (1–2 years [y], n = 3; 5–10 years; n = 3) samples. Each dot represents the mean of 1–5 fields/sample. m, months. (C) IFA of IgA1 (green), IgA2 (red), and IgM (blue) in the ileum (left) and colon (right) tissues from an adult individual. Original magnification, 20×; scale bar, 50 µm. (D) FCA of cell surface CD38, IgA, and IgA2 (left and middle graphs) and frequency of IgA2+ (right graph) cells from the total IgA+ PC pool of viable DAPILinCD38hiCD10IgA+ cells from the terminal ileum or ascending colon of adult individuals. (E) FCA (upper histograms) and mean fluorescence intensity (MFI, lower bar plots) of cell surface GPR15 and CCR9 on naive B cells, IgA1+ PCs, and IgA2+ PCs from the human terminal ileum. MFI is shown as arbitrary units (AUs) calculated in comparison to the ones of IgA1+ PCs, which were set as 1. (F) FCA of CD38, IgA, IgM, IgD, and IgA2 on CD19+ B cells from human peripheral blood. (G and H) Frequencies of β7+GPR15+ cells within IgM+, IgA1+, IgA2+, or IgG/E+ PC subsets (G) as well as naive or class-switched memory IgA1+, IgA2+, and IgG/E+ B cell subsets (H) from human peripheral blood as defined in F. Data show one of at least three experiments yielding similar results (A, C, and F) or summarize results from three to five (B), seven (D), three (E, lower left graph and G) or five (E, lower right graph and H) donors. Results are presented as mean ± SEM; Wilcoxon matched paired test (D) and one-way ANOVA with Tukey’s post-hoc test (E, G, and H). *P < 0.05, **P < 0.01, ***P < 0.001. See also Fig. S1.
Figure S1.
Figure S1.
Human Intestinal IgA1+ and IgA2+ PCs express a comparable phenotype and canonical PC properties. (A) FCA and MFI of intracellular BLIMP-1 or surface CD27, CD43, CD319, CD20, and CXCR4 in intestinal naïve B cells, IgA1+ PCs and IgA2+ PCs of a representative adult donor (top panels) or at least three donors (bottom panels). (B) FCA of IgM, IgD, IgA, IgA1, and IgA2 was performed on circulating viable DAPICD19+ B cells to validate the specificity of the staining to IgA2 subclass. IgA1+ cells were defined as IgA+ IgA2, whereas IgA2+ cells were defined as IgA+ IgA2+. (C) FCA of intracellular BLIMP-1 and surface CD27, CD319, CD20, or HLA-DR in control naive B cells (gray) as well as CD19+CD45+ (or CD19+), CD19CD45+ (or CD19), and CD19CD45 (or CD45) subsets of total viable DAPI CD10CD38hi IgA+ PCs from the terminal ileum or ascending colon of a representative adult donor (top panels) or at least three donors (bottom panels). Data show one of at least three experiments yielding similar results (B) or summarize results from three or more donors (A and C). Results are presented as mean ± SEM; one-way ANOVA with Tukey’s post-hoc test. *P < 0.05, **P < 0.01, ***P < 0.001.
Figure 2.
Figure 2.
Human intestinal long-lived CD19 PCs are enriched in IgA2 expression. (A) FCA of CD45 and CD19 on total CD10CD38hiIgA+ PCs from the terminal ileum or ascending colon of a representative adult individual (upper panel) or summaries of the frequencies of ileal or colonic CD19+CD45+ (or CD19+), CD19CD45+ (or CD19), and CD19CD45 (or CD45) PC subsets (bottom panel) within total IgA+ PCs from adult donors under study. (B and C) FCA of CD138 and CD56 (B) or CD71 and CD43 (C) on control naive B cells (gray) as well as CD19+ (pink), CD19 (red), and CD45 (brown) PC subsets from total ileal or colonic LinCD10CD38hiIgA+ PCs of adult individuals. Upper panels: overlaid histogram profiles of CD138, CD56, CD71, or CD43 on PC subsets from a representative donor; lower panels: summaries of MFI values of CD138, CD56, CD71, and CD43 on PC subsets. (D) IFA of IgA (green), CD138 (red), Ki-67 (blue), and DAPI (white) in human colonic LP. Arrows point to actively proliferating IgA+Ki-67+CD138 PBs. Original magnification, 20× (left) and 60× (right); scale bar, 50 µm. (E) FCA of the frequency of Ki67+ cells within IgA class-switched (CD10 CD38+ IgA+) CD19+, CD19, and CD45 PC subsets from the human intestine. (F) FCA of the frequency of CD138 cells within CD19+IgA+Ki67+ PBs or CD19+IgA+ Ki67 PCs. (G) FCA of IgA and IgA2 expression and frequency of IgA2+ cells within each IgA class-switched CD19+, CD19, and CD45 PC subsets from human ascending colon. Numbers in flow plots show % of IgA2+ cells within each subset. (H) Frequencies of IgA2+ cells within CD19+CD10+CD27+CD38intIgA+ GC B cells, CD19+CD10CD38+IgA+ memory (ME) B cells, and IgA class-switched CD19+, CD19, and CD45 PC subsets from the human terminal ileum. Data show one of at least three experiments yielding similar results (D) or summarize results from 10 (A, left panel), 8 (A, right panel) 20 (B, left panel) 5 (B, right panel; C), 3 (E and F), 12 (G), or 16 (H) donors. Results are presented as mean ± SEM; One-way ANOVA with Tukey’s post-hoc test (B, C, E, G, and H) and paired Student’s t test (F). *P < 0.05, **P < 0.01, ***P < 0.001. See also Fig. S1.
Figure S2.
Figure S2.
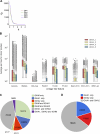
Repertoire and lineage tree features. (A) Diversity profiles showing the calculated repertoire diversity measure qD in each donor versus the diversity order q. For q = 1, qD is the “species richness,” i.e., the number of species—or clones—observed in the repertoire. For q = 2, qD is Shannon’s information, which also accounts for species abundance (clone sizes here). Higher orders give more weight to the larger clones by using higher powers of clone sizes. 34,000 clones were sampled from each repertoire, after excluding naïve B cells to avoid biases due to repertoire size. (B) Tree topological features for D#1 (red), D#2 (orange), D#3 (green), and D#4 (blue). All lengths/distances are measured in the number of tree nodes. Minima, maxima, and averages are calculated per tree, then averaged per donor. Features shown are the following. Leaves, total number of leaves in the tree; Nodes, total number of nodes in the tree; Od-avg, the average outgoing degree of all nodes; Rootd, root outgoing degree (the number of branches going out of the root node); Trunk, trunk length; Pl-min, the minimum path length from the root to a leaf, including the trunk; Dasn-min, the minimum distance between adjacent split nodes (“forks”), i.e., an inverse measure of tree branching; Drsn-min, the minimum distance from the root to any split node; Dlfsn-avg, the average distance from a leaf node (branch end) back to the first split node. (C and D) Pie chart and numbers of lineage trees containing sequences of the indicated isotypes (C) or only of IgA isotype (D) in all four donors.
Figure 3.
Figure 3.
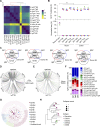
Human intestinal IgA2+ B cells express a post-GC mutational profile and are extensively clonally related to IgA1+ B cells. (A) Pearson’s correlation coefficient matrix of IGHV gene segment usage by naïve B cells and paired IgM+, IgA1+, and IgA2+ memory (ME) B cells and PCs from human terminal ileum (IL) and ascending colon (CO) grouped according to their correlation patterns by hierarchical clustering, based on the Ward.D2 method. (B) Mean numbers (#) of IGHV gene mutations per sequence (upper panel) and proportions of unmutated IGHV gene sequences (lower panel) in naïve B cells and IgA1+ or IgA2+ B cell subsets as in A. Each color represents a different donor (D); D#1, blue, D#2 red, D#3 green, and D#4, purple. (C) Venn diagrams showing the numbers of IGHV clones unique to each isotype as well as the numbers of IGHV clones shared by two or three isotypes in each donor. (D and E) Circos plots from D#3 depicting clonal relationships between PCs and ME B cells (D) or between PCs from different tissues (E) expressing different isotypes. The reference cell subset is shown in bold. (F) Bar plots depicting the isotype and population composition of clones containing IgA2 sequences from D#1, D#2, and D#3. (G) Honeycomb plot generated from single-cell V(D)J RNA sequencing data obtained from a histologically normal ileal sample. Single cells are represented as dots and each clonotype is represented as a hexagonal cluster of cells. Cells were colored according to their isotype. (H) Representative lineage tree from sequencing data as in G built using the maximum likelihood method. Each tree represents a B cell clone, and each dot, a leaf node. The size of each dot reflects the number of B cells (sharing the same sequence) that the node represents. Data show one donor (G and H), one representative result from four biological replicates (D and E), or summarize results from three (F) or four different donors (A–C). Error bars, SEM; and one-way ANOVA with Tukey’s post-hoc test (B). ***P < 0.001. See also Fig. S2.
Figure 4.
Figure 4.
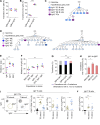
A fraction of human intestinal IgA2+ B cells may originate from mutated IgA1+ clones via sequential IgA1-to-IgA2 CSR uncoupled from SHM. (A and B) Frequencies of transitions into IgA1 or IgA2 out of all transitions from IgM to IgA (A) and from IgM or IgA1 out of all transitions into IgA2 (B) quantified by lineage tree analysis. Donor (D)#1, blue; D#2, red; D#3, green; D#4, purple. (C and D) Lineage trees from two distinct donors. Color codes are shown above or below each tree. Trees were colored using a custom script and drawn with a local version of Graphviz. Numbers indicate mutations; edges with no attached number indicate one mutation. ME, memory. (E) Average numbers of IGVH mutations per clone in IgM+, IgA1+, and IgA2+ clones (excluding clones with more than one Ig class or subclass), counted on lineage trees along each path from the root (germline sequence) to each leaf sequence, then averaged for each tree, and again for each donor. D#1, blue; D#2, red; D#3, green; D#4, purple. (F) Average numbers of mutations in IgA2 sequences belonging to clones sharing other Ig classes and/or subclasses, counted as in E. D#1, blue; D#2, red; D#3, green; D#4, purple. (G) Relative proportions of transitions with up to two mutations and transition with >2 mutations. The numbers of mutations were calculated by measuring the number of edges separating distinct isotypes in each lineage tree. (H) Frequencies of IgA1 to IgA2 transitions with >2 mutations within or between different cell populations. (I) FCA of IgA1 and IgA2 on in vitro induced IgA+ PCs and frequencies of in vitro induced total CD27+CD38+ PCs, IgA+ cells (shown as % of total PCs), and IgA2+ PCs (shown as % of IgA+ PCs) after culturing splenic IgD+ B cells with TD (CD40L + IL-21) or TI (CpG-DNA) stimuli supplemented with IgA-inducing signals (TGF-β, IL-10, BAFF, APRIL) for 6 days. Ctrl (control), medium alone. (J) Frequency of in vitro induced IgA2+ PCs (shown as % of IgA+ PCs) gated as in J after culturing ileal IgA1+ B cells with TD (CD40L + IL-21) or TI (CpG-DNA) stimuli supplemented with IgA-inducing signals (TGF-β, IL-10, BAFF, and APRIL) for 6 days. Ctrl (control), medium alone. Data show two representative results out of four biological replicates (C and D) or summarize results from four different donors (A, B, and E–H) or from eight (I) or five (J) independent experiments. Error bars, SEM; two-tailed paired Student’s t test (A and B), one-way ANOVA with Tukey’s post-hoc test (E–H and I, left panel), two-tailed Mann–Whitney U test (I, middle and right panels) and Kruskal–Wallis test (J). *P < 0.05, **P < 0.01, ***P < 0.001. See also Fig. S3.
Figure S3.
Figure S3.
Some human intestinal IgA2 may derive from both GC and extra-GC IgA1+ B cells. (A) Lineage trees from a representative donor. Color codes correspond to specific B cell and PC subsets. Trees were colored using a custom script and drawn using a local version of Graphviz. ME, memory; IL, ileum. Numbers indicate mutations; edges with no attached number indicate one mutation. (B) Circos plots from donor D#3 depicting clonal relationships between GC B cells and PCs and expressing IgA1 (left) or IgM (right) as isotype of reference (shown in bold). (C) Average numbers of mutations of IgA1 sequences in clones sharing other antibody classes or subclasses as indicated. D#1, blue; D#2, red; D#3, green; D#4, purple. (D) Frequencies of transitions from IgM to IgA1 (left) or from IgM to IgA2 (right) with >2 mutations generated during ME B cell-to-ME B cell, ME B cell-to-PC or PC-to-PC maturation events. Results are presented as mean ± SEM.
Figure 5.
Figure 5.
Human intestinal SIgA2 mostly targets mucus-embedded bacteria dually coated by SIgA1. (A and B) Representative FCA (left) and frequency of SIgM+SIgA, SIgM+SIgA+, and SIgMSIgA+ (A) or SIgA1+SIgA2, SIgA1+SIgA2+, and SIgA1SIgA2+ (B) SytoBC+ fecal MB of HCs and SIgAD patients. (C) Representative FCA (left) and summary pie charts (right) of mucus-embedded SIgA1+SIgA2 (red), SIgA1+SIgA2+ (blue), and SIgA1SIgA2+ (green) gut MB from histologically normal ileal or colonic gut segments. (D) Frequencies of mucus-embedded SIgA1+SIgA2 (red), SIgA1+SIgA2+ (blue), and SIgA1SIgA2+ (green) gut MB in ileal versus colonic gut segments. (E) Abundances of free SIgA1 (left) or free SIgA2 (right) in ileal versus colonic gut mucus secretions, measured by ELISA. (F) Heatmap visualization of the reactivity of free SIgA1 and free SIgA2 from terminal ileum or ascending colon for B. fragilis, R. lactatiformans, A. muciniphila, and B. longum. (G) Representative flow cytometric analysis of the reactivity of free SIgA1 and free SIgA2 for B. fragilis, R. lactatiformans, A. muciniphila, and B. longum. Red contour plots, viable SSC+SytoBC+ bacteria bound by free gut SIgA1 and/or SIgA2 from mucus supernatant and incubated with fluorochrome-labeled antibodies. Gray contour plots, control SSC+SytoBC+ bacteria incubated only with fluorochrome-labeled antibodies. (H) Bar plot showing the frequency of colonic mucus samples (n = 14) with the different binding profiles of free SIgA1 and free SIgA2. Positivity was defined as a 25% increase in MFI compared to negative controls, i.e., bacterial isolates incubated only with fluorochrome-labeled antibodies. Data summarize results from 9 (A) or 8 (B) HCs and 5 SIgAD patients (A and B), 8 (C and D), 18 or 17 (E, IgA1 and IgA2, respectively) or 9 (F) or 14 (H) samples. Error bars, SEM; two-tailed Mann–Whitney U test (A and B) and Wilcoxon matched paired test (D and E). *P < 0.05, **P < 0.01, ***P < 0.001.
Figure 6.
Figure 6.
Human gut inflammation elicits de novo induction of actively proliferating IgA1+ PBs while depleting late-stage IgA2+ PCs. (A and B) FCA of CD38, CD27, IgA, and IgM expression on DAPICD10 B cells from human colonic LP cells (A) and frequency of IgM+, IgA+, and IgG+ (defined as IgAIgM) PCs from total colonic LP CD27+CD38++CD10 PCs of HCs and IBD patients (B). UC, bright red symbols; CD, open pink symbols. (C) FCA of IgA and IgA2 expression and frequencies of IgA1+ (IgA+IgA2) and IgA2+ cells from colonic LP CD27+CD38++CD10 PCs from HCs and IBD patients. UC, bright red symbols; CD, open pink symbols. (D) IgA2+ (left panel) and IgA1+ (right panel) cells per mm2 in colonic LP from HCs or IBD patients were calculated by tissue inspection through IFA. UC, bright red symbols; CD, open pink symbols. (E) FCA-derived frequencies of IgA2+ cells within total colonic LP memory (ME) IgA+ B cells from HCs and IBD patients. UC, bright red symbols; CD, open pink symbols. (F) FCA of CD45 and CD19 expression and frequencies of CD19+, CD19, and CD45 PC subsets from colonic LP DAPICD10CD27+CD38++IgA+ PCs of HCs and IBD patients. UC, bright red symbols; CD, open pink symbols. (G) Representative FCA of IgA and IgA2 expression and percentage of IgA2+ PCs on colonic LP IgA+ PCs from both inflamed and non-inflamed gut segments from UC patients (n = 5). (H) IFA of IgA1 (green), IgA2 (red), Ki-67 (white), and nuclear DNA (blue) in gut LP from HC and IBD donors. Arrows point to actively proliferating IgA1+Ki-67+ PBs. Original magnification, 20×. Scale bars, 50 µm. (I) Frequencies of actively proliferating Ki-67+ cells from total IgA1+ or IgA2+ PCs in gut LP from IBD patients. (J) Numbers of actively proliferating Ki-67+IgA1+ cells per microscopic field in gut LP from HCs and IBD patients. UC, bright red symbols; CD, open pink symbols. For each sample, 2–12 microscopic fields were analyzed. Data show one of more than three experiments yielding similar results (A, C left, F left, G, and I) or summarize results from at least 12 HCs and at least 14 IBD patients (B, C right graphs, D, E, F right graphs, and H) or from 7 HCs to 18 IBD patients (J). Error bars, SEM; Wilcoxon matched paired test (G and H) and two-tailed Mann–Whitney U test (B–F and J). *P < 0.05, **P < 0.01, ***P < 0.001. See also Fig. S4.
Figure S4.
Figure S4.
Human gut inflammation induces expansion of mucosal IgA1+ PB along with depletion of mucosal and circulating IgA2+ memory B cells and PCs. (A) FCA of IgA and IgA2 expression on total circulating switched memory (SM) B cells and frequencies of IgA2+ memory (ME) B cells from total circulating CD19+ B cells of HCs and UC patients. (B) Pearson’s correlations between the frequency of intestinal IgA1+ or IgA2+ PCs and the frequency of CD19+, CD19, and CD45 IgA+ PCs. (C) Representative FCA (left plots) and frequency of CD19+, CD19, and CD45 PCs (right graphs) on colonic LP IgA+ PCs from both inflamed and non-inflamed gut segments from UC patients (n = 5). (D) FCA of IgD and CD71 expression on total circulating CD19+ B cells and frequencies of recently activated IgDlowCD71+ B cells out of total circulating CD19+ B cells in HCs and UC patients. (E) Representative FCA of CD71 expression in circulating IgA+ memory B cells and frequencies of recently activated CD71+ B cells out of total IgA1+ memory B cells from HCs and UC patients. Data show one of more than three experiments yielding similar results (A left, C left, and D left) or summarize results from 17 HCs to 13 UC patients (A right, B, D, and E) or 5 UC patients (C). Error bars, SEM; Mann–Whitney U test (A, D, and E), Wilcoxon matched paired test (C). *P < 0.05, **P < 0.01.
Figure 7.
Figure 7.
Gut inflammation increases the frequency of intestinal bacteria dually coated by SIgA1 and SIgA2 and alters SIgA-mediated MB selection. (A) Strategy adopted to profile the fecal MB from HCs and UC patients by 16S rRNA sequencing following SIgA1/SIgA2-based sorting of single positive SIgA1+, single positive SIgA2+, double-positive SIgA1+SIgA2+ (DP), and double-negative SIgA1SIgA2 (DN) bacteria. Total input SytoBC+ bacteria were also sorted as control. (B) Relative abundance of phyla (upper panel) and genera (lower panel) in bacterial fractions sorted from the fecal MB of HC as in A. (C–E) EI for g_A. muciniphilia (C), c_Gammaproteobacteria (D), and c_Clostridia (E) in bacterial fractions obtained from the fecal MB of HCs as in A. (F and G) FCA of SIgA1 and SIgA2 and frequencies of total SIgA+ (SIgA1+, SIgA1+SIgA2+, and SIgA2+) or dually coated SIgA1+SIgA2+ (right panels) from SytoBC+ fecal MB of HCs and patients with UC (F) or transient gastrointestinal infection (G) (see Table S2). (H) Strategy adopted to profile the fecal MB from HCs and UC patients by 16S rRNA sequencing following SIgA1-based sorting of SIgA1+ bacteria, which include SIgA1+ single positive and DP SIgA1+SIgA2+ bacteria. Total input SytoBC+ bacteria were also sorted as control. (I) Relative abundance of A. muciniphila in the input fraction obtained from the fecal MB of HCs and patients with UC as in H. (J and K) IgA1 EI (J) and probability index (K) for f_Erysipelotrichaceae from the fecal MB of HCs and UC patients as in H. Data show one representative donor out of 6 (B), or 28 (H) or summarize the results of 6 HCs (C–E), 10 HC donors or 6 UC donors (F), 4 HC or 20 gut infection donors (G), 14 HC and UC donors (I–K). For each fecal sample, EI values were plotted only when a given bacteria was present in all fractions. Error bars, SEM (F and G); two-tailed Mann–Whitney U test (F, G, and I–K) and one-way ANOVA with Tukey’s post hoc test (C–E); *P < 0.05, **P < 0.01. See also Fig. S5.
Figure S5.
Figure S5.
The fecal bacterial MB from HCs and UC patients does not show major compositional differences. (A and B) Frequencies of phyla (A) and genera (B) in fecal bacterial inputs obtained from fecal MB of HCs and UC patients as in Fig. 7 H (left plot). (C) Phylogenetic richness (left), shown as Faith_PD index, and species diversity (right), shown as Shannon index, of fecal MB input samples obtained as depicted in Fig. 7 H (left plot) from HCs and UC patients. (D) PCA shows the β diversity of fecal MB input samples from HCs and UC patients. (E) EI for Firmicutes, Bacteroidetes, Actinobacteria, Proteobacteria, and Verrucomicrobia in bacterial IgA1+ and IgA1 fractions obtained from the fecal MB of HCs and UC patients as in Fig. 7 H (left plot). (F) IgA1 EI in Firmicutes, Actinobacteria, Bacteroidetes, and Proteobacteria in bacterial fractions obtained from the fecal MB of HCs and UC patients as in Fig. 7 H (left plot). Data summarize the results of 14 HC and 14 UC. Error bars, SEM (C); two-tailed Mann–Whitney U test (C, E, and F); *P < 0.05.
Figure 8.
Figure 8.
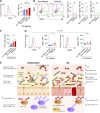
IBD increases dual SIgA1 and SIgA2 coating of gut MB and augments SIgA1 and SIgA2 reactivity to E. coli. (A) Representative flow cytometric profile (left) and frequencies (right) of SIgA1-bound mucus-embedded ileal MB from CD patients (red) and non-IBD controls (blue). CD samples included MB from inflamed (dark red) and non-inflamed (light red) segments of the gut mucosa. (B) Representative flow cytometry (left) and frequencies (right) of mucus-embedded SytoBC+ gut bacteria, including SIgA1+SIgA2 (red), SIgA1+SIgA2+ (blue), and SIgA1SIgA2+ (green) bacteria inhabiting non-inflamed versus inflamed segments of the gut mucosa from CD patients. (C) ELISA of free SIgA from ileal mucus secretions of CD patients and non-IBD controls as in A. (D) Representative flow cytometric profiles and MFI of SIgA1 (left) and SIgA2 (right) bound to E. coli. SIgA1 and SIgA2 were obtained from gut mucus secretions of CD patients or non-IBD controls as in C and all samples were adjusted to a total IgA concentration of 10 µg/ml. (E) Schematic representation of proposed gut MB selection by SIgA1 and SIgA2 in homeostasis and IBD. In gut homeostasis, balanced IgA1 and IgA2 responses to the gut MB involve clonally related IgA1+ and IgA2+ PCs, including long-lived-enriched IgA2+ PCs. These responses induce dual coating of intraluminal mucus-embedded commensal bacteria, including beneficial A. muciniphila, by SIgA1 and SIgA2 and preferential coating of R. lactatiformans and Gammaproteobacteria by SIgA2 and SIgA1, respectively. In IBD, the expansion of short-lived IgA1+ PCs, including IgA1+ PBs, combined with the relative reduction of long-lived IgA2+ PCs associate with a global decrease of A. muciniphila, a general increase in dually coated bacteria, with increased SIgA1 binding to potentially pathogenic bacteria such as E. coli and members of the Erysipelotrichaceae family. Data summarize results from 8 non-IBD controls and 9 CD donors (A and B) or 9 non-IBD controls and 10 CD donors (C and D). SEM (A, C, and D); to compare non-IBD controls to IBD donors, two-tailed Mann–Whitney U test was used (A, C, and D); to compare noninflamed versus inflamed IBD segments, Wilcoxon matched paired test was used (A–D); *P < 0.05, **P < 0.01.

References

    1. Ansaldo, E., Slayden L.C., Ching K.L., Koch M.A., Wolf N.K., Plichta D.R., Brown E.M., Graham D.B., Xavier R.J., Moon J.J., and Barton G.M.. 2019. Akkermansia muciniphila induces intestinal adaptive immune responses during homeostasis. Science. 364:1179–1184. 10.1126/science.aaw7479 - DOI - PMC - PubMed
    1. Barak, M., Zuckerman N.S., Edelman H., Unger R., and Mehr R.. 2008. IgTree: Creating immunoglobulin variable region gene lineage trees. J. Immunol. Methods. 338:67–74. 10.1016/j.jim.2008.06.006 - DOI - PubMed
    1. Berkowska, M.A., Driessen G.J.A., Bikos V., Grosserichter-Wagener C., Stamatopoulos K., Cerutti A., He B., Biermann K., Lange J.F., van der Burg M., et al. . 2011. Human memory B cells originate from three distinct germinal center-dependent and -independent maturation pathways. Blood. 118:2150–2158. 10.1182/blood-2011-04-345579 - DOI - PMC - PubMed
    1. Bolyen, E., Rideout J.R., Dillon M.R., Bokulich N.A., Abnet C.C., Al-Ghalith G.A., Alexander H., Alm E.J., Arumugam M., Asnicar F., et al. . 2019. Reproducible, interactive, scalable and extensible microbiome data science using QIIME 2. Nat. Biotechnol. 37:852–857. 10.1038/s41587-019-0209-9 - DOI - PMC - PubMed
    1. Brandtzaeg, P., Farstad I.N., Johansen F.E., Morton H.C., Norderhaug I.N., Yamanaka T., Brandtzaeg P., Farstad I.N., Johansen F., Morton H.C., et al. . 1999. The B-cell system of human mucosae and exocrine glands. Immunol. Rev. 171:45–87. 10.1111/j.1600-065X.1999.tb01342.x - DOI - PMC - PubMed

Substances

Supplementary concepts