

Decoding VExUS: a practical guide for excelling in point-of-care ultrasound assessment of venous congestion
- PMID: 39560910
- PMCID: PMC11576717
- DOI: 10.1186/s13089-024-00396-z
Decoding VExUS: a practical guide for excelling in point-of-care ultrasound assessment of venous congestion
Abstract
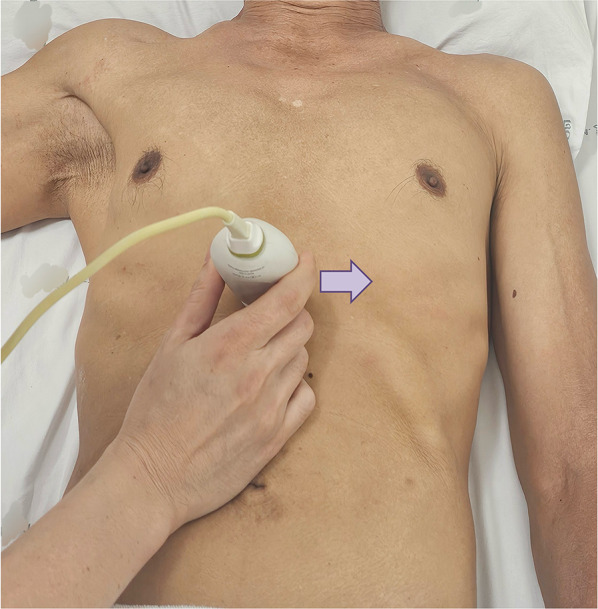
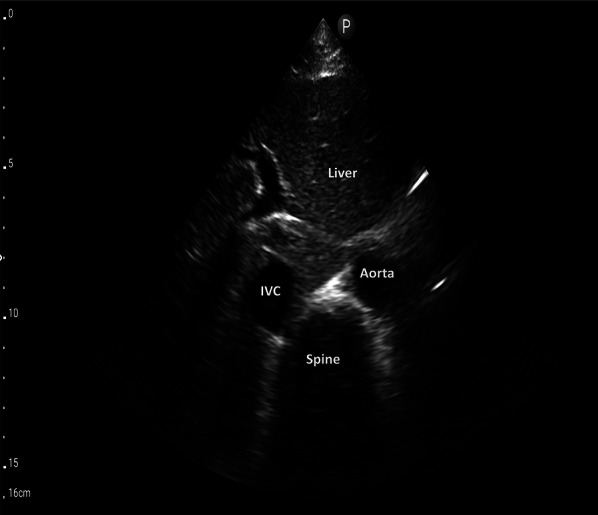
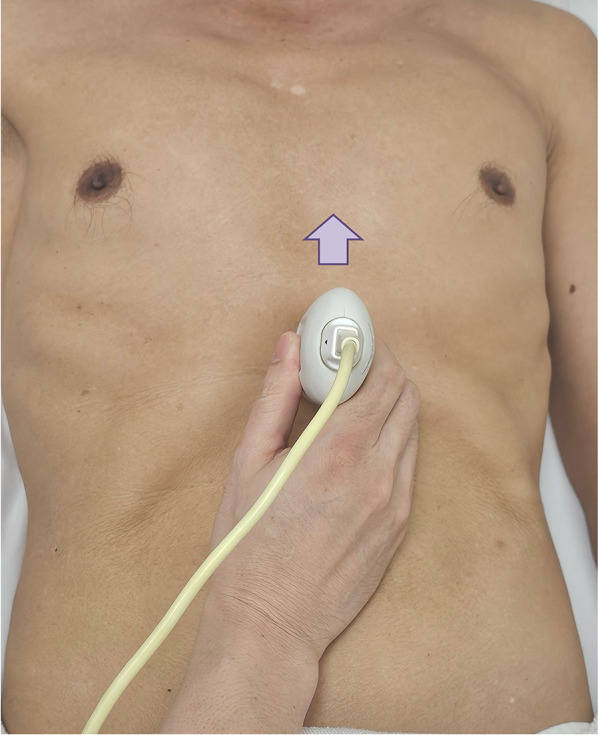
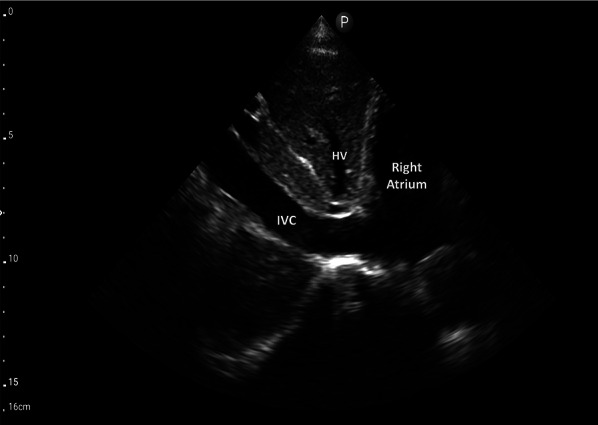
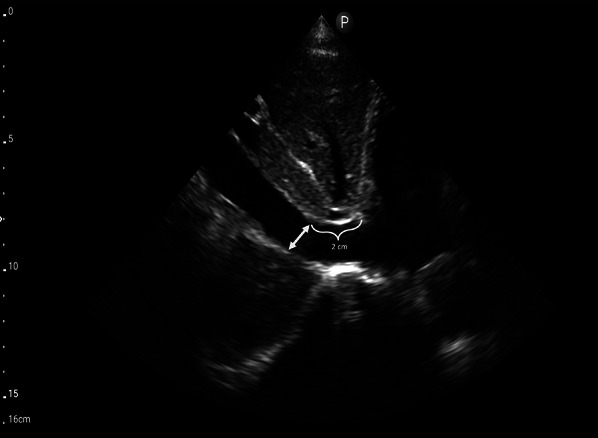
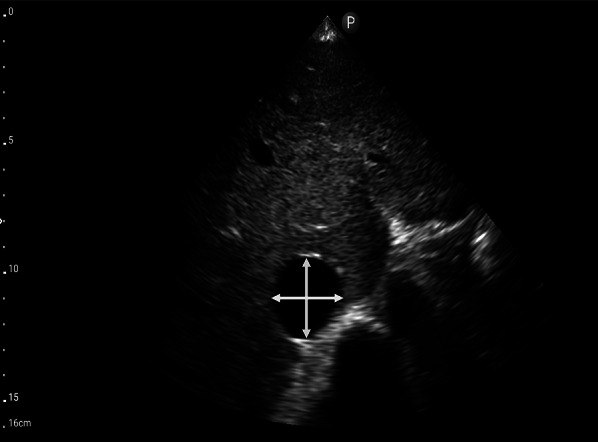
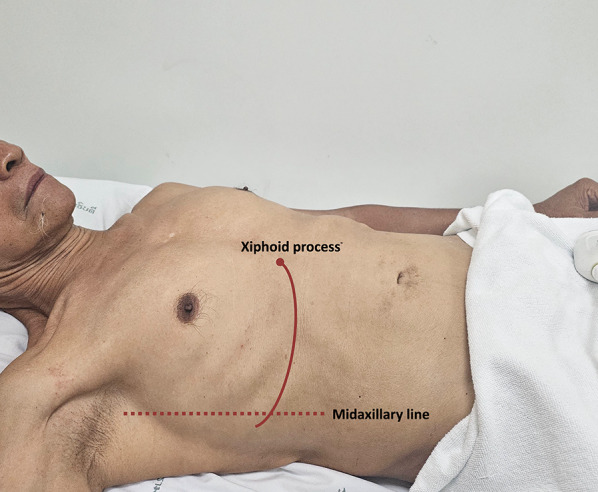
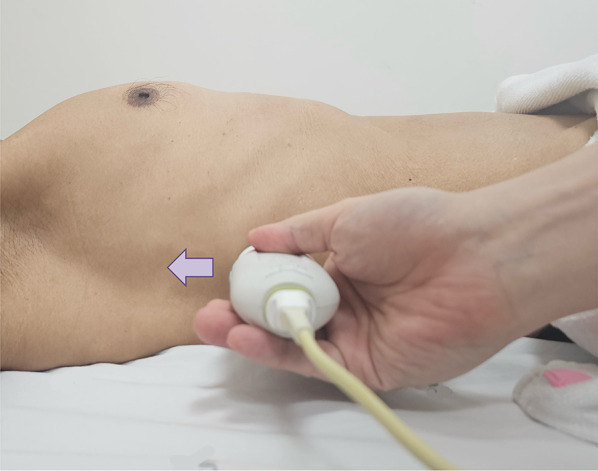
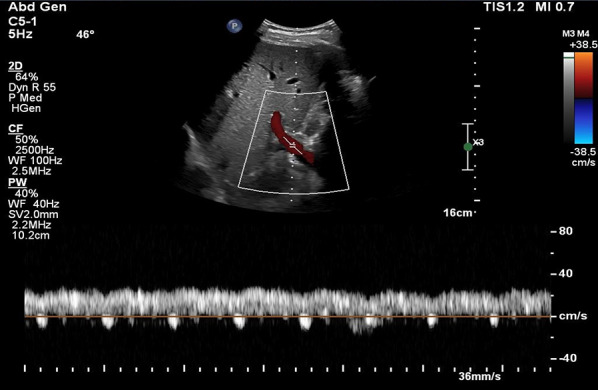
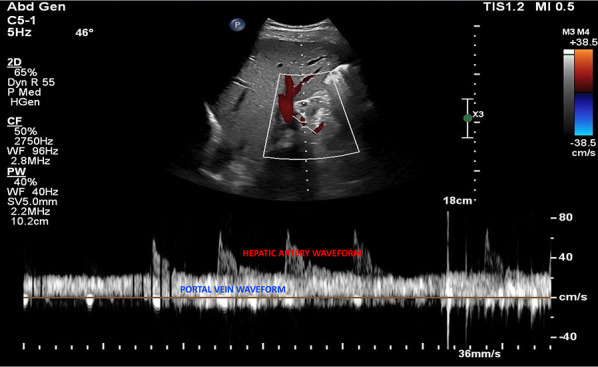
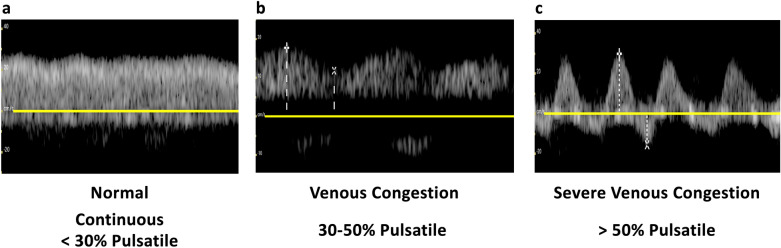
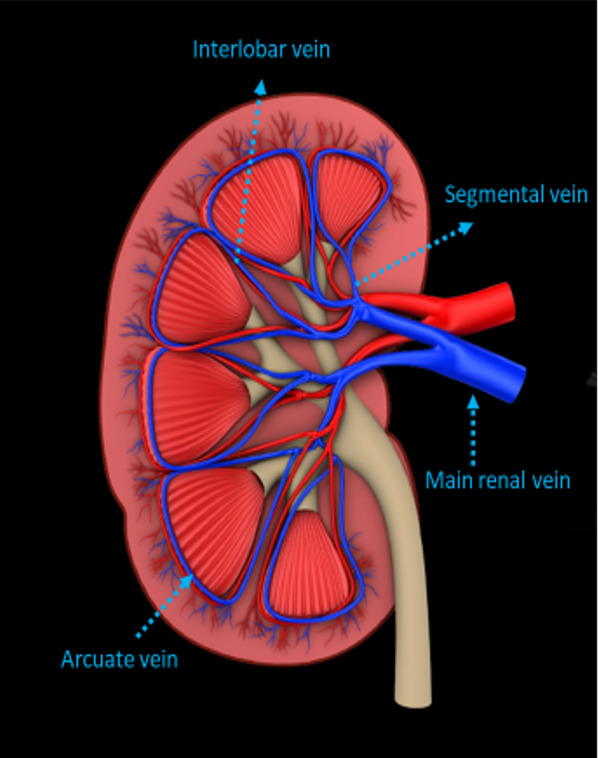
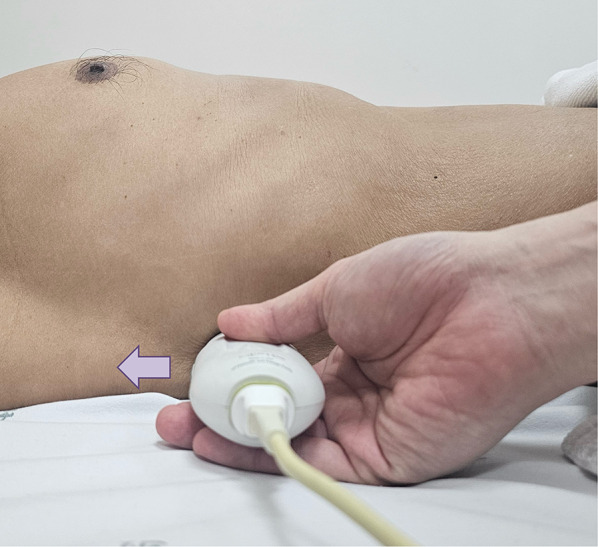
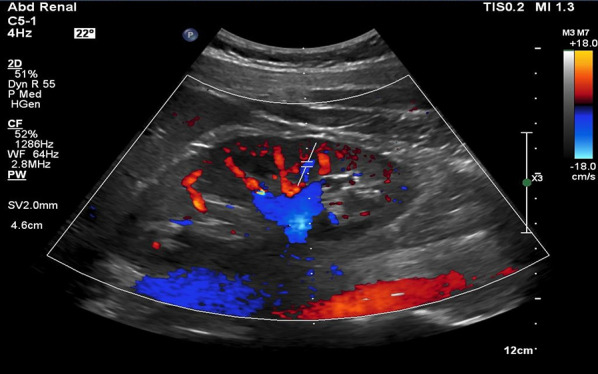
Venous congestion, often associated with elevated right atrial pressure presents a clinical challenge due to its varied manifestations and potential organ damage. Recognizing the manifestations of venous congestion through bedside physical examination or laboratory tests can be challenging. Point-of-care ultrasound (POCUS) is emerging as a valuable bedside tool for assessing venous congestion, with the Venous Excess Ultrasound (VExUS) technique gaining prominence. VExUS facilitates non-invasive quantification of venous congestion, relying on measurements of the inferior vena cava (IVC) size and Doppler assessments of the hepatic vein (HV), portal vein (PV), and intrarenal vein, thereby providing real-time insights into hemodynamic status and guiding therapeutic interventions. The grading system outlined in VExUS aids in stratifying the severity of congestion. However, achieving proficiency in VExUS requires a comprehensive understanding of Doppler techniques and their clinical applications. This review article provides practical guidance on performing VExUS, encompassing equipment requirements, preparation, machine settings, and examination techniques for assessing the inferior vena cava (IVC), hepatic vein (HV), portal vein (PV), and intrarenal vein. Potential pitfalls and troubleshooting strategies are discussed to ensure accurate interpretation of Doppler waveforms.
Keywords: Point-of-care ultrasound; VExUS; Venous congestion; Venous excess ultrasound.
© 2024. The Author(s).
Conflict of interest statement
Figures
Similar articles
-
Unlocking the Potential of VExUS in Assessing Venous Congestion: The Art of Doing It Right.Cardiorenal Med. 2024;14(1):350-374. doi: 10.1159/000539469. Epub 2024 May 30. Cardiorenal Med. 2024. PMID: 38815571 Review.
-
Venous Excess Ultrasound for Fluid Assessment in Complex Cardiac Patients With Acute Kidney Injury.Cureus. 2024 Aug 2;16(8):e66003. doi: 10.7759/cureus.66003. eCollection 2024 Aug. Cureus. 2024. PMID: 39221348 Free PMC article.
-
VExUS to Guide Ultrafiltration in Hemodialysis: Exploring a Novel Dimension of Point of Care Ultrasound.POCUS J. 2024 Apr 22;9(1):16-19. doi: 10.24908/pocus.v9i1.16985. eCollection 2024. POCUS J. 2024. PMID: 38681164 Free PMC article.
-
Combination of Inferior Vena Cava Diameter, Hepatic Venous Flow, and Portal Vein Pulsatility Index: Venous Excess Ultrasound Score (VEXUS Score) in Predicting Acute Kidney Injury in Patients with Cardiorenal Syndrome: A Prospective Cohort Study.Indian J Crit Care Med. 2020 Sep;24(9):783-789. doi: 10.5005/jp-journals-10071-23570. Indian J Crit Care Med. 2020. PMID: 33132560 Free PMC article.
-
Current appraisal of venous excess ultrasound (VExUS) and its applications in the treatment of cardiovascular disease.Future Cardiol. 2025 Aug;21(10):829-839. doi: 10.1080/14796678.2025.2530339. Epub 2025 Jul 29. Future Cardiol. 2025. PMID: 40728266 Review.
Cited by
-
Ten Questions on Using Lung Ultrasonography to Diagnose and Manage Pneumonia in Hospital-at-Home Model: Part II-Confounders and Mimickers.Diagnostics (Basel). 2025 May 9;15(10):1200. doi: 10.3390/diagnostics15101200. Diagnostics (Basel). 2025. PMID: 40428193 Free PMC article. Review.
-
A Pragmatic Approach to Acute Cardiorenal Syndrome: Diagnostic Strategies and Targeted Therapies to Overcome Diuretic Resistance.J Clin Med. 2025 Apr 26;14(9):2996. doi: 10.3390/jcm14092996. J Clin Med. 2025. PMID: 40364029 Free PMC article. Review.
-
Cardio-Renal Syndrome: Latest Developments in Device-Based Therapy.J Clin Med. 2024 Dec 20;13(24):7814. doi: 10.3390/jcm13247814. J Clin Med. 2024. PMID: 39768738 Free PMC article. Review.
-
VExUS Protocol Along Cardiorenal Syndrome: An Updated Review.J Clin Med. 2025 Feb 17;14(4):1334. doi: 10.3390/jcm14041334. J Clin Med. 2025. PMID: 40004865 Free PMC article. Review.
-
Point-of-Care Ultrasound in Early Identification of Tamponade: A Case Series.Cureus. 2025 Feb 10;17(2):e78823. doi: 10.7759/cureus.78823. eCollection 2025 Feb. Cureus. 2025. PMID: 40078251 Free PMC article.
References
-
- Guyton AC (1955) Determination of cardiac output by equating venous return curves with cardiac response curves. Physiol Rev 35(1):123–129 - PubMed
-
- Guyton AC, Lindsey AW, Abernathy B, Richardson T (1957) Venous return at various right atrial pressures and the normal venous return curve. Am J Physiol 189(3):609–615 - PubMed
-
- Nagueh SF, Kopelen HA, Zoghbi WA (1996) Relation of mean right atrial pressure to echocardiographic and Doppler parameters of right atrial and right ventricular function. Circulation 93(6):1160–1169 - PubMed
-
- Duerinckx AJ, Grant EG, Perrella RR, Szeto A, Tessler FN (1990) The pulsatile portal vein in cases of congestive heart failure: correlation of duplex Doppler findings with right atrial pressures. Radiology 176(3):655–658 - PubMed
Publication types
LinkOut - more resources
Full Text Sources