. 2024 Nov 19;10(1):e180287.
doi: 10.1172/jci.insight.180287.

Aiolos promotes CXCR3 expression on Th1 cells via positive regulation of IFN-γ/STAT1 signaling

Affiliations

Aiolos promotes CXCR3 expression on Th1 cells via positive regulation of IFN-γ/STAT1 signaling

Melissa R Leonard et al. JCI Insight. .

Abstract

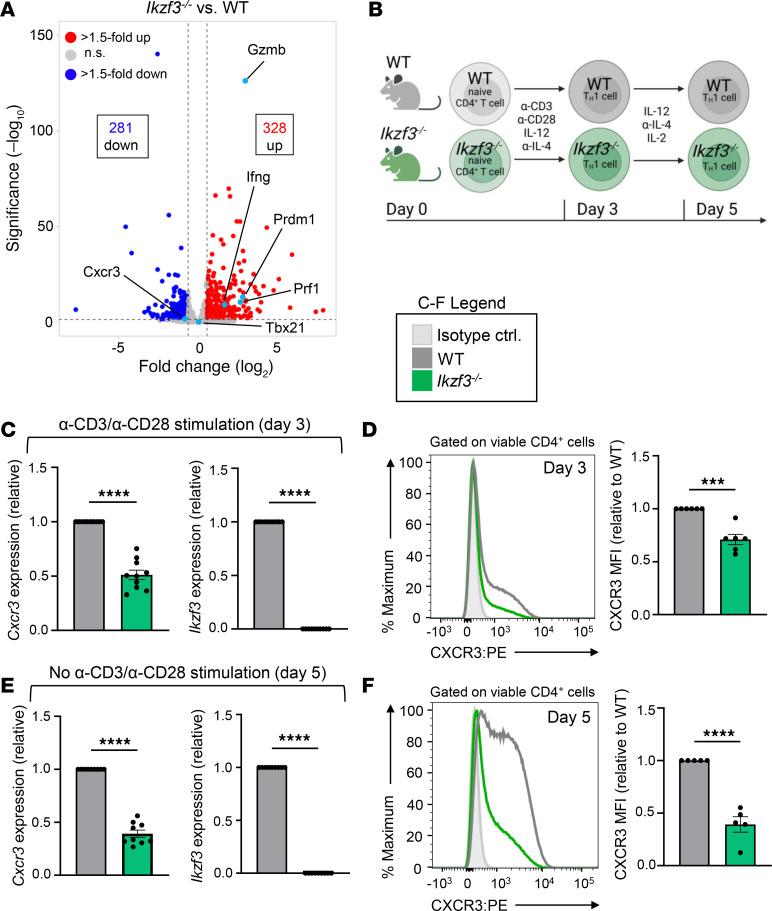
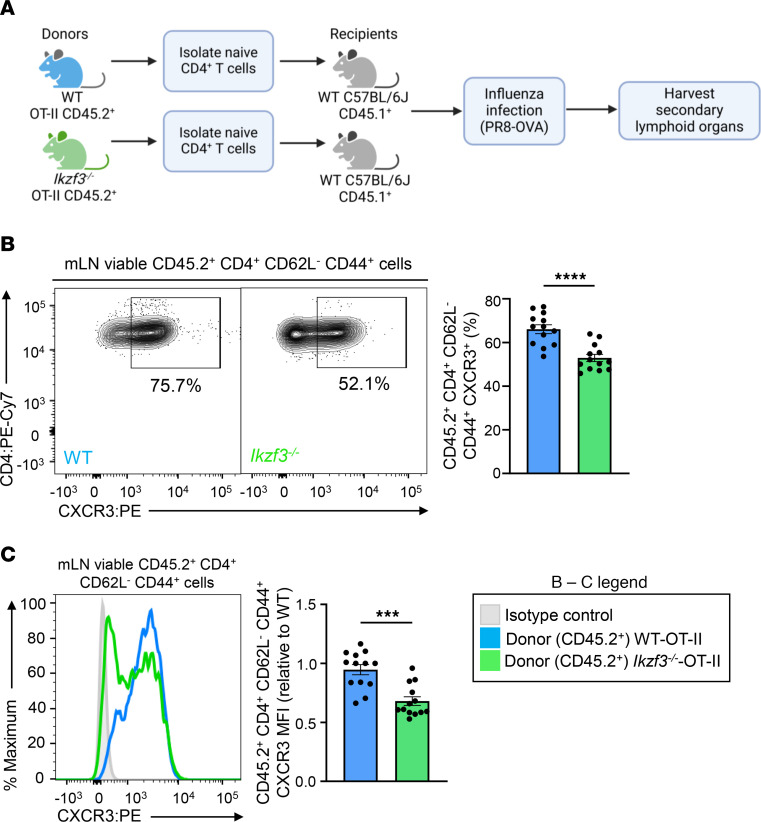
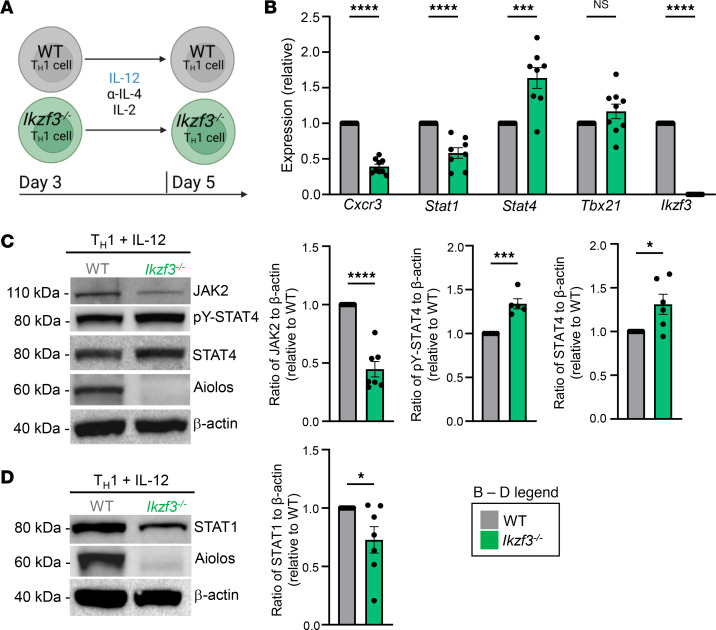
CD4+ T helper 1 (Th1) cells coordinate adaptive immune responses to intracellular pathogens, including viruses. Key to this function is the ability of Th1 cells to migrate within secondary lymphoid tissues, as well as to sites of inflammation, which relies on signals received through the chemokine receptor CXCR3. CXCR3 expression is driven by the Th1 lineage-defining transcription factor T-bet and the cytokine-responsive STAT family members STAT1 and STAT4. Here, we identify the Ikaros zinc finger (IkZF) transcription factor Aiolos (Ikzf3) as an additional positive regulator of CXCR3 both in vitro and in vivo using a murine model of influenza virus infection. Mechanistically, we found that Aiolos-deficient CD4+ T cells exhibited decreased expression of key components of the IFN-γ/STAT1 signaling pathway, including JAK2 and STAT1. Consequently, Aiolos deficiency resulted in decreased levels of STAT1 tyrosine phosphorylation and reduced STAT1 enrichment at the Cxcr3 promoter. We further found that Aiolos and STAT1 formed a positive feedback loop via reciprocal regulation of each other downstream of IFN-γ signaling. Collectively, our study demonstrates that Aiolos promotes CXCR3 expression on Th1 cells by propagating the IFN-γ/STAT1 cytokine signaling pathway.

Keywords: Cytokines; Immunology; Infectious disease; T cells; Th1 response.


Conflict of interest statement

Conflict of interest: The authors have declared that no conflict of interest exists.

Figures

Figure 1
Figure 1. CXCR3 expression is reduced on Aiolos-deficient Th1 cells.
(A) Published RNA-Seq data (GSE203065) from in vitro–generated WT and Ikzf3–/– Th1 cells were assessed for differentially expressed genes (DEGs). A volcano plot displays gene expression changes at day 3. Genes are color-coded: no significant changes (gray), upregulated genes with > 1.5-fold change with P < 0.05 (red), downregulated genes with > 1.5-fold change with P < 0.05 (blue), and selected genes of interest (turquoise). (B) Schematic of Th1 cell culturing system. Naive CD4+ T cells were stimulated with anti-CD3/CD28 (α-CD3/CD28) under Th1-polarizing conditions (IL-12, α-IL-4). On day 3, cells were harvested or removed from stimulation and placed into fresh Th1 conditions with IL-2 for an additional 2 days. (C) At day 3, transcript analysis was performed via quantitative reverse transcription PCR (qRT-PCR). Transcript was normalized to Rps18 and presented as fold-change compared with WT control (n = 10 biological replicates from 10 independent experiments, mean ± SEM; ****P < 0.0001, 2-tailed unpaired Student’s t test). (D) Representative flow cytometric analysis for CXCR3 on day 3 Th1 cells. Data displayed as median fluorescence intensity (MFI) fold-change compared with WT controls (n = 6 biological replicates from 6 independent experiments, mean ± SEM; ***P < 0.001, 2-tailed unpaired Student’s t test). (E) At day 5, transcript analysis was performed as in C (n = 9 biological replicates from 9 independent experiments, mean ± SEM; ****P < 0.0001, 2-tailed unpaired Student’s t test). Note: Cxcr3 and Ikzf3 transcript data presented here are the same as in Figure 5B. (F) Representative flow cytometric analysis for CXCR3 on day 5 Th1 cells. Data displayed as MFI fold-change compared with WT controls (n = 5 biological replicates from 5 independent experiments, mean ± SEM; ****P < 0.0001, 2-tailed unpaired Student’s t test).
Figure 2
Figure 2. CXCR3 expression is reduced on Aiolos-deficient CD4+ T cells responding to IAV infection.
(A) Schematic of murine model of IAV infection. WT or Ikzf3–/– mice were infected intranasally with 30 PFU of IAV (A/PR/8/34; PR8). After 8 days, mediastinal lymph nodes (mLN) and lungs were harvested and stained for flow cytometric analysis. Fluorochrome-labeled MHC class II tetramers were used to identify IAV nucleoprotein-specific (NP-specific) CD4+ T cells. (B) Representative flow cytometric analysis for CXCR3 expression in NP-specific CD4+ T cells isolated from the mLNs of WT or Ikzf3–/– mice. Data are compiled from 4 independent experiments and displayed as percentage positive for CXCR3. (C) Representative histogram overlay for CXCR3. Data are displayed as MFI fold-change compared with WT controls (n = 16 for WT and n = 15 for Ikzf3–/–, mean ± SEM; ****P < 0.0001, 2-tailed unpaired Student’s t test).
Figure 3
Figure 3. CXCR3 expression is reduced on Aiolos-deficient CD4+ T cells in a cell-intrinsic manner.
(A) Schematic of adoptive transfer system. Naive CD4+ T cells were harvested from the mLNs of WT OT-II or Ikzf3–/– OT-II mice. A total of 500,000 cells/animal were adoptively transferred into CD45.1+ recipients. Recipient mice were then infected with 40 PFU of OVA323–339–expressing A/PR/8/34 (PR8-OVA) influenza virus 24 hours after transfer. At 8 days after infection, mLNs were harvested, and viable CD45.2+CD4+CD62LCD44+ (antigen-specific, donor effector) cells were analyzed via flow cytometry. (B) Representative flow cytometric analysis for CXCR3 expression in CD45.2+CD4+CD62LCD44+ cells in the mLN. Data are compiled from 3 independent experiments and displayed as percentage positive for CXCR3. (C) Representative histogram overlay for CXCR3. Data are displayed as MFI fold-change compared with WT OT-II control cells (n = 13, mean ± SEM; ***P < 0.001, ****P < 0.0001, 2-tailed unpaired Student’s t test).
Figure 4
Figure 4. Aiolos-deficient Th1 cells exhibit altered expression of components of IFN-γ/STAT1 and IL-12/STAT4 signaling pathways.
(A) Publicly available chromatin immunoprecipitation sequencing (ChIP-Seq) data for STAT1 (GSM994528), STAT4 (GSM550303), and T-bet (GSM836124) were examined at Cxcr3. Sequencing tracks were viewed using the Integrative Genomics Viewer (IGV). Regulatory regions of interest with transcription factor enrichment are indicated by the blue boxes. (B) Published RNA-Seq data (GSE203065) from in vitro–generated WT and Ikzf3–/– Th1 cells were analyzed for DEGs. A heatmap of DEGs associated with IFN-γ/STAT1 and IL-12/STAT4 signaling in Th1 cells is shown, as well as additional genes involved in both pathways and Th cell differentiation. Gene names color-coded in blue are downregulated in Ikzf3–/– Th1 cells. Note: Cxcr3 transcript data presented here are the same as in Supplemental Figure 3D. (C) Schematic of proposed model in which Aiolos may regulate CXCR3 via impacts on components of the IFN-γ/STAT1 and IL-12/STAT4 cytokine signaling pathways. The downward arrows in blue indicate genes that are downregulated in the absence of Aiolos.
Figure 5
Figure 5. IFN-γ/STAT1 signaling, but not IL-12/STAT4, is diminished in IL-12–treated, Aiolos-deficient Th1 cells.
(A) Schematic of culturing system. Naive CD4+ T cells were stimulated with α-CD3/CD28 under Th1-polarizing conditions (IL-12, α–IL-4). On day 3, cells were removed from stimulation and placed back into fresh Th1-polarizing conditions (IL-12, α–IL-4) with IL-2 for an additional 2 days. (B) At day 5, transcript analysis was performed via qRT-PCR. Transcript was normalized to Rps18 and presented as fold-change compared with WT control (n = 8–9 biological replicates from 8–9 independent experiments. Data are presented as mean ± SEM; ***P < 0.001, ****P < 0.0001, 2-tailed unpaired Student’s t test). Note: Cxcr3 and Ikzf3 transcript data presented here are the same as in Figure 1E. (C and D) An immunoblot was performed to assess the relative abundance of the indicated proteins. β-Actin serves as a loading control (n = 5–7 independent experiments, mean ± SEM; *P < 0.05, ***P < 0.001, ****P < 0.0001, 2-tailed unpaired Student’s t test).
Figure 6
Figure 6. IFN-γ/STAT1 signaling is compromised in IFN-γ–treated, Aiolos-deficient Th1 cells.
(A) Schematic of culturing system. Naive CD4+ T cells were stimulated with α-CD3/CD28 and cultured under Th1-polarizing conditions (IL-12, α–IL-4). On day 3, cells were removed from stimulation and given IFN-γ, α–IL-4, and IL-2 for an additional 2 days. (B) At day 5, transcript analysis was performed via qRT-PCR. Transcript was normalized to Rps18 and presented as fold-change compared with WT control (n = 4 biological replicates from 4 independent experiments, mean ± SEM; **P < 0.01, ***P < 0.001, ****P < 0.0001, 2-tailed unpaired Student’s t test). (C) Representative flow cytometric analysis for CXCR3 on IFN-γ–treated Th1 cells at day 5. Data are displayed as MFI fold-change compared with WT controls (n = 3 biological replicates from 3 independent experiments, mean ± SEM; **P < 0.01, 2-tailed unpaired Student’s t test). (D) An immunoblot was performed to assess the relative abundance of the indicated proteins. β-Actin serves as a loading control (n = 4 independent experiments, mean ± SEM; *P < 0.05, ***P < 0.001, 2-tailed unpaired Student’s t test). (E) ChIP assays were performed to assess STAT1 association with Cxcr3 in WT and Ikzf3–/– Th1 cells. Publicly available ChIP-Seq data for STAT1 (GSM994528) were examined to identify potential regions of STAT1 enrichment. Sequencing tracks were viewed using IGV, and regulatory regions of interest are indicated by blue boxes. Approximate ChIP primer locations at the Cxcr3 promoter (prom.) and 3′ enhancer (enhc.) are indicated with gray arrows. (F) The indicated regions were analyzed for STAT1 enrichment. Data were normalized to total input. Percentage enrichment relative to input was divided by IgG, and data are presented as fold-change relative to IgG. (n = 4 biological replicates from 4 independent experiments, mean ± SEM; **P < 0.01, ***P < 0.001, 1-way ANOVA with Tukey’s multiple comparisons test.)
Figure 7
Figure 7. IFN-γ/STAT1 signaling induces Aiolos expression.
(A) Schematic of culturing system. WT naive CD4+ T cells were stimulated with α-CD3/CD28 under Th1-polarizing conditions (IL-12, α–IL-4). Some cells were also treated with α–IFN-γ to inhibit IFN-γ/STAT1 signaling. (B) At day 3, transcript analysis was performed via qRT-PCR. Transcript was normalized to Rps18 and presented as fold-change compared with WT control (n = 4 biological replicates from 4 independent experiments, mean ± SEM; **P < 0.01, ****P < 0.0001, 2-tailed unpaired Student’s t test). (C) Representative flow cytometric analysis at day 3 for CXCR3 expression on WT Th1 cells treated with or without α–IFN-γ. Data are displayed as percentage positive for CXCR3 (n = 3 biological replicates from 3 independent experiments, mean ± SEM; *P < 0.05, 2-tailed unpaired Student’s t test). (D) An immunoblot was performed to assess the relative abundance of the indicated proteins. β-Actin serves as a loading control (n = 4 independent experiments, mean ± SEM; *P < 0.05, **P < 0.01, ****P < 0.0001, 2-tailed unpaired Student’s t test). (E) At day 3, transcript and flow cytometric analyses were performed for Ikzf3 and Aiolos protein expression, respectively. Flow cytometric data are displayed as MFI fold-change compared with WT controls (n = 3 biological replicates from 3 independent experiments, mean ± SEM; **P < 0.01, 2-tailed unpaired Student’s t test).
Figure 8
Figure 8. Aiolos and STAT1 engage in reciprocal regulation.
(A) Publicly available ATAC-Seq data (GSE203064) from WT and Ikzf3–/– Th1 cells were assessed for alterations in chromatin accessibility at the Stat1 promoter. Publicly available ChIP-Seq data for Aiolos (GSM5106065) were examined at Stat1. Sequencing tracks were viewed using IGV. The Stat1 promoter region of significant differential accessibility is indicated by a blue box (Padj = 0.0302). A ~500 bp region encompassing the indicated Aiolos DNA binding motifs within the Stat1 promoter was subcloned into a reporter plasmid. (B) Schematic depicting the zinc finger (ZF) domains of WT Aiolos and a DNA-binding mutant (AiolosDBM). (C) EL4 T cells were transfected with a Stat1 promoter-reporter and WT Aiolos, AiolosDBM, or empty vector control. Cells were also transfected with SV40-Renilla as a control for transduction efficiency. Luciferase promoter-reporter values were normalized to Renilla control and presented relative to the empty vector control. Aiolos was assessed via immunoblot with an antibody for the V5 epitope tag. β-Actin serves as a loading control. Data are representative of 3 independent experiments (n = 3, mean ± SEM; *P < 0.05, 1-way ANOVA with Tukey’s multiple comparisons test). (D) Publicly available ATAC-Seq data (GSE203064) from Th1 cells and ChIP-Seq data for STAT1 (GSM994528) were viewed using IGV to identify regions of STAT1 enrichment (blue box) at Ikzf3. Approximate ChIP primer locations are indicated with a gray arrow. (E) The Ikzf3 promoter (prom.) and a negative control region (neg. ctrl.) were analyzed for STAT1 enrichment via ChIP. Data were normalized to total input. Percentage enrichment relative to input was divided by IgG, and data are presented as fold-change relative to IgG. (n = 4 biological replicates from 4 independent experiments, mean ± SEM; *P < 0.05, **P < 0.01, 1-way ANOVA with Tukey’s multiple comparisons test.)

References

    1. O’Shea JJ, Paul WE. Mechanisms underlying lineage commitment and plasticity of helper CD4+ T cells. Science. 2010;327(5969):1098–1102. doi: 10.1126/science.1178334. - DOI - PMC - PubMed
    1. Bonelli M, et al. Helper T cell plasticity: impact of extrinsic and intrinsic signals on transcriptomes and epigenomes. Curr Top Microbiol Immunol. 2014;381:279–326. - PMC - PubMed
    1. Kanno Y, et al. Transcriptional and epigenetic control of T helper cell specification: molecular mechanisms underlying commitment and plasticity. Annu Rev Immunol. 2012;30:707–731. doi: 10.1146/annurev-immunol-020711-075058. - DOI - PMC - PubMed
    1. Christie D, Zhu J. Transcriptional regulatory networks for CD4 T cell differentiation. Curr Top Microbiol Immunol. 2014;381:125–172. - PMC - PubMed
    1. Meitei HT, Lal G. T cell receptor signaling in the differentiation and plasticity of CD4+ T cells. Cytokine Growth Factor Rev. 2023;69:14–27. doi: 10.1016/j.cytogfr.2022.08.001. - DOI - PubMed