. 2024 Nov 19;135(2):e175680.
doi: 10.1172/JCI175680.

Low tristetraprolin expression activates phenotypic plasticity and primes transition to lethal prostate cancer in mice

Affiliations

Low tristetraprolin expression activates phenotypic plasticity and primes transition to lethal prostate cancer in mice

Katherine L Morel et al. J Clin Invest. .

Abstract

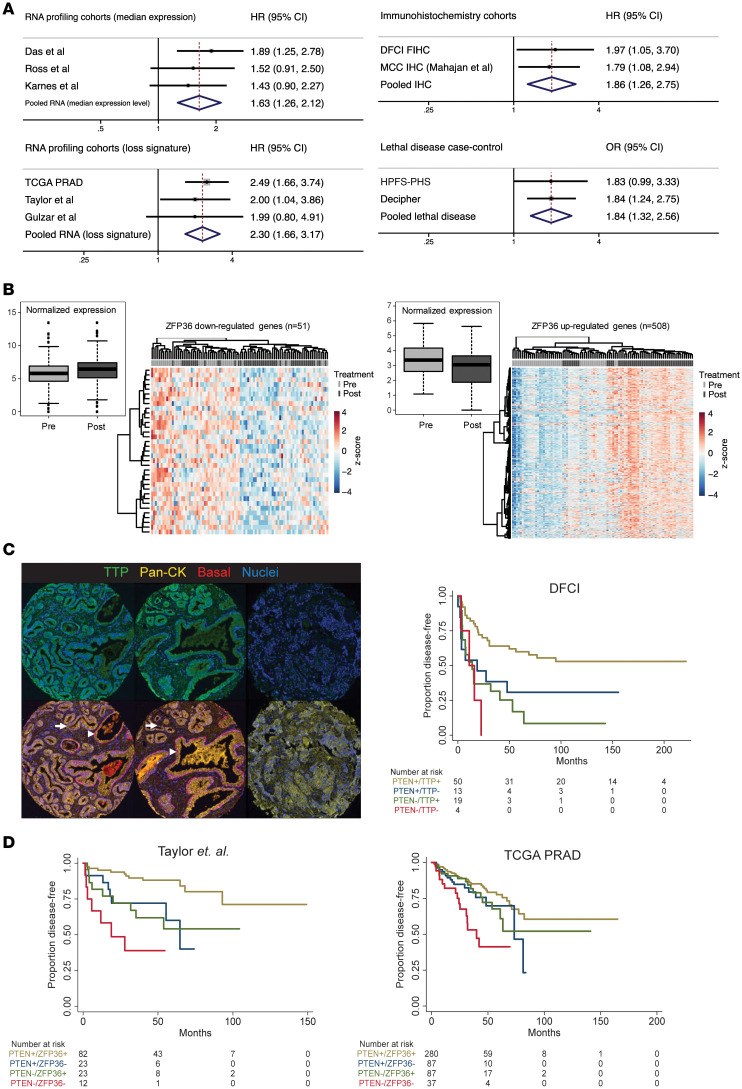
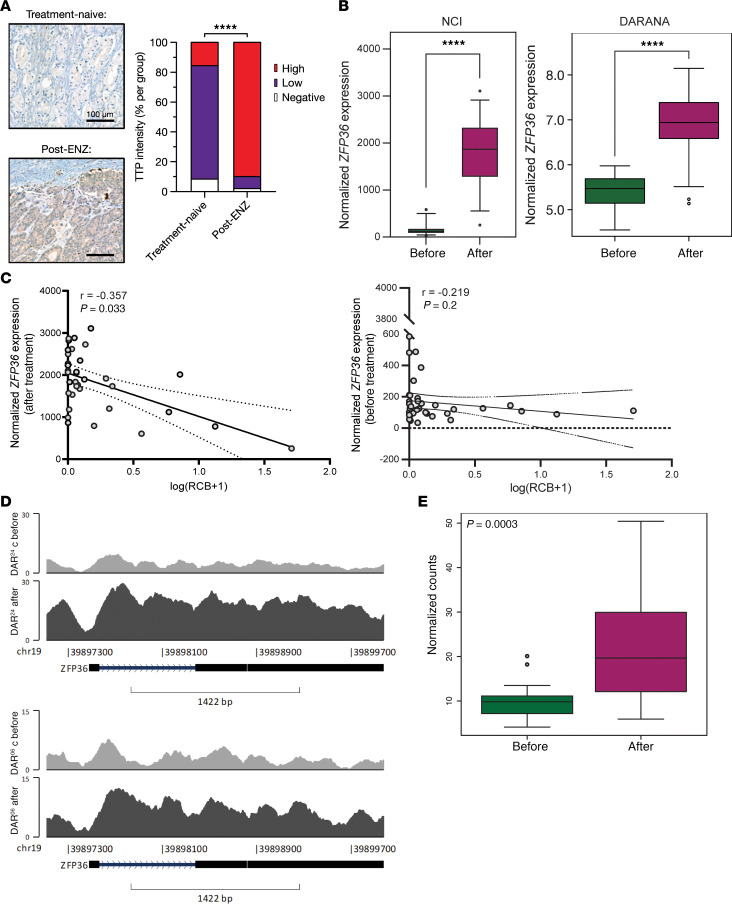
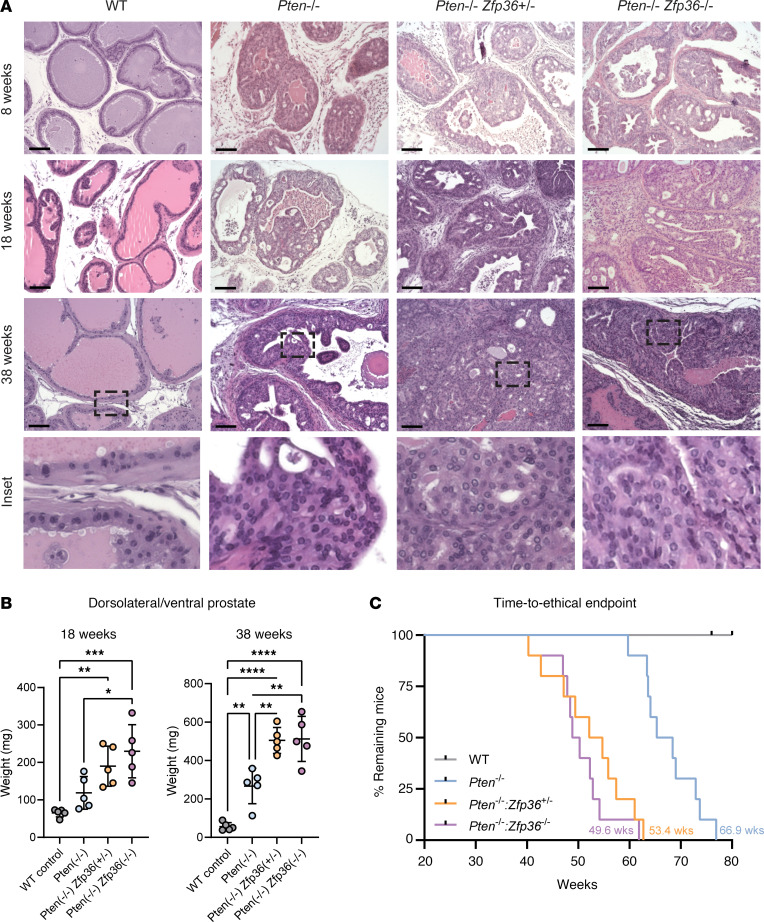
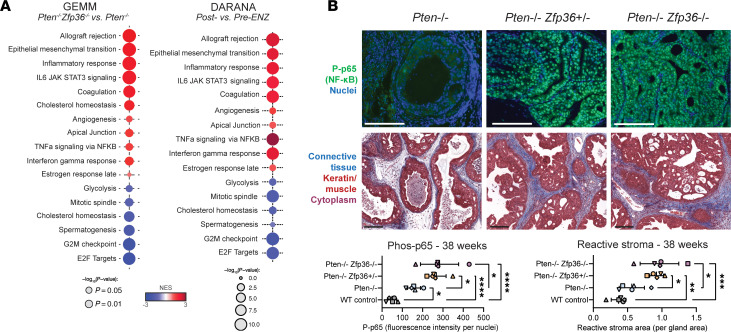
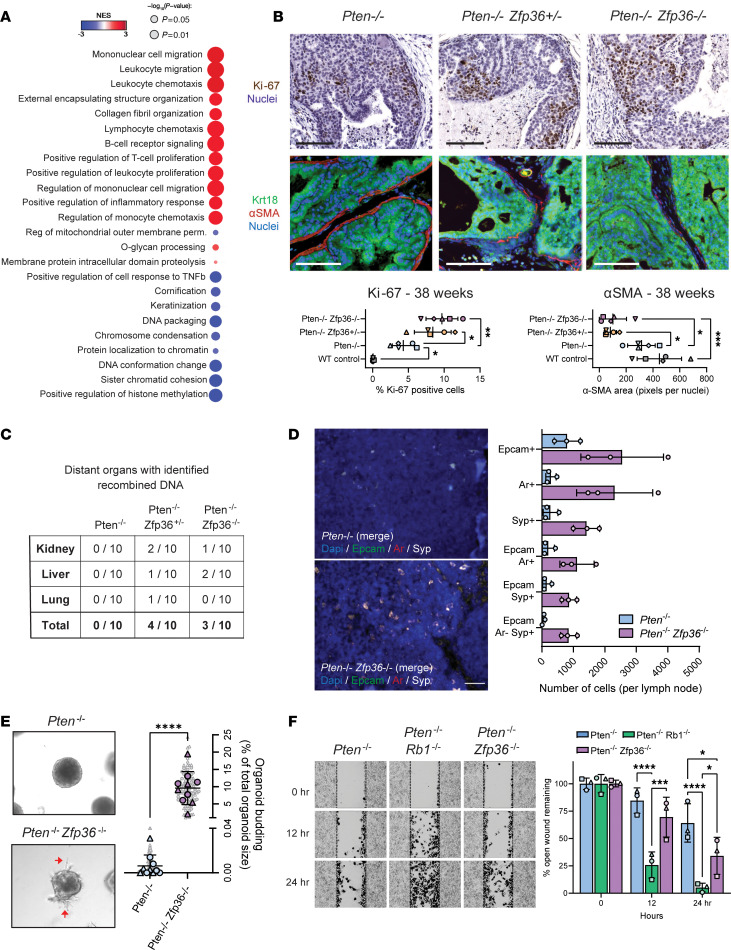
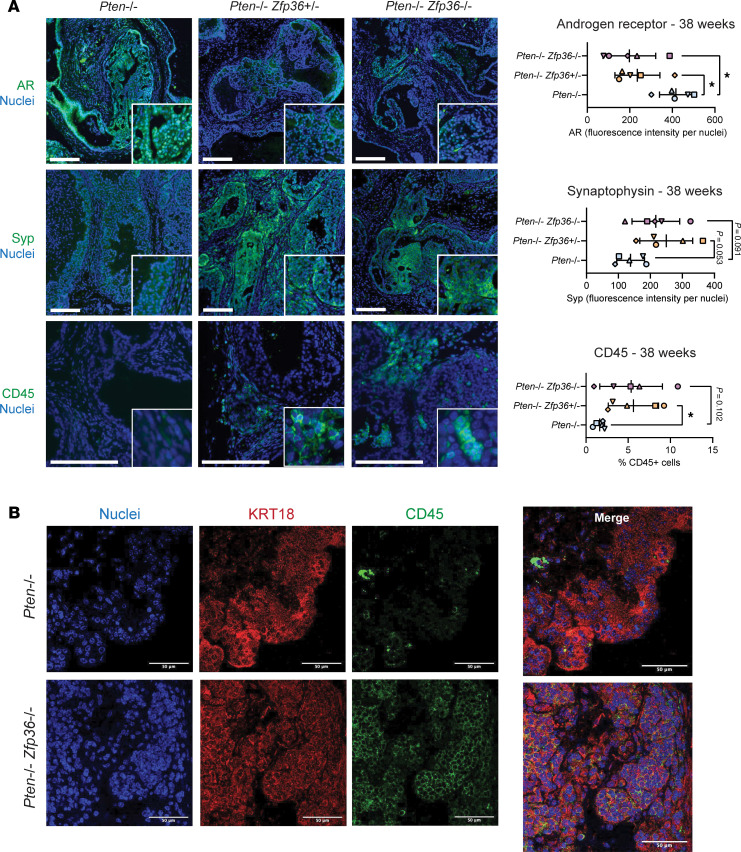
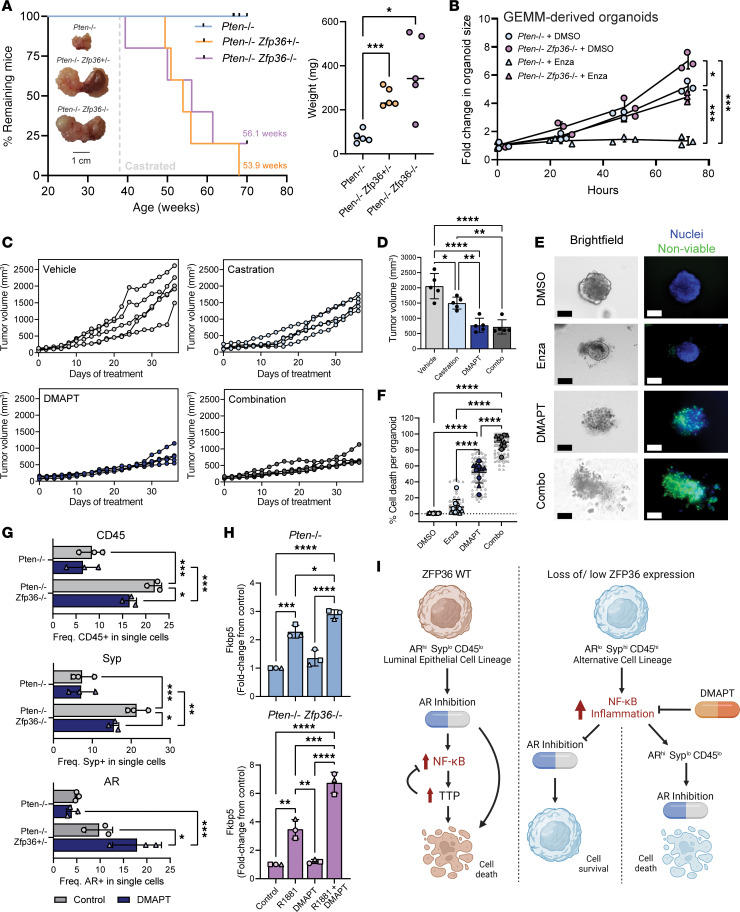
Phenotypic plasticity is a hallmark of cancer and is increasingly realized as a mechanism of resistance to androgen receptor-targeted (AR-targeted) therapy. Now that many prostate cancer (PCa) patients are treated upfront with AR-targeted agents, it is critical to identify actionable mechanisms that drive phenotypic plasticity, to prevent the emergence of resistance. We showed that loss of tristetraprolin (TTP; gene ZFP36) increased NF-κB activation, and was associated with higher rates of aggressive disease and early recurrence in primary PCa. We also examined the clinical and biological impact of ZFP36 loss with co-loss of PTEN, a known driver of PCa. Analysis of multiple independent primary PCa cohorts demonstrated that PTEN and ZFP36 co-loss was associated with increased recurrence risk. Engineering prostate-specific Zfp36 deletion in vivo induced prostatic intraepithelial neoplasia, and, with Pten codeletion, resulted in rapid progression to castration-resistant adenocarcinoma. Zfp36 loss altered the cell state driven by Pten loss, as demonstrated by enrichment of epithelial-mesenchymal transition (EMT), inflammation, TNF-α/NF-κB, and IL-6-JAK/STAT3 gene sets. Additionally, our work revealed that ZFP36 loss also induced enrichment of multiple gene sets involved in mononuclear cell migration, chemotaxis, and proliferation. Use of the NF-κB inhibitor dimethylaminoparthenolide (DMAPT) induced marked therapeutic responses in tumors with PTEN and ZFP36 co-loss and reversed castration resistance.

Keywords: Cell biology; Mouse models; Oncology; Prostate cancer.


Figures

Figure 1
Figure 1. ZFP36/TTP and clinical outcomes.
(A) RNA- and IHC-based forest plots depicting ZFP36/TTP expression related to clinical outcomes (biochemical recurrence and disease-free survival) and risk of lethal PCa (case-control cohorts). TCGA PRAD, The Cancer Genome Atlas Prostate Adenocarcinoma data set; DFCI FIHC, Dana-Farber Cancer Institute Fluorescent IHC; HPHS-PHS, Health Professionals Follow-up Study and Physicians’ Health Study. (B) Upregulated and downregulated genes were identified by differential expression analysis of TCGA PRAD cases divided by lower-quartile expression of ZFP36. (C) Representative images of immunofluorescent (IF) staining for pan-cytokeratin (yellow) and basal (red) markers, as well as TTP (green) in human PCa used for expression analysis. Benign glands (arrowheads) costain for pan-cytokeratin and basal cocktails; tumor cells (arrows) demonstrate absent basal expression. Far right images display diffuse prostate tumor with absent TTP expression. (D) Kaplan-Meier survival analysis demonstrating that TTP deficiency, measured by protein expression (DFCI, refs. 40, 69) and ZFP36 mRNA expression (TCGA PRAD, ref. ; Taylor et al., ref. 34), results in shorter disease-free-survival, and even shorter disease-free survival in combination with PTEN deficiency.
Figure 2
Figure 2. ZFP36/TTP expression in response to enzalutamide.
(A) Representative images and quantification of TTP IHC staining intensity in DARANA patient tissues comparing treatment-naive and post-enzalutamide samples. ****P < 0.0001 (Fisher’s exact test). Scale bars: 100 μm. (B) ZFP36 expression from RNA-Seq before and after enzalutamide in the NCI and DARANA clinical studies. n = 36–52, ****P < 0.0001 (2-tailed paired-samples t test). (C) Correlation of normalized ZFP36 expression versus volume of post-treatment residual cancer burden (RCB) in pre- and post-enzalutamide samples. n = 36 patients (non-parametric Spearman’s correlation). (D) Representative H3K27 acetylation tracks at the ZFP36 locus from 2 DARANA patients, comparing pre- and post-enzalutamide samples. (E) Quantification of H3K27 acetylation signal at the ZFP36 locus before and after enzalutamide treatment (paired-samples t test).
Figure 3
Figure 3. Zfp36 loss accelerates progression of prostate cancer in Pten-null murine tumors.
(A) H&E staining of murine tumors highlighting morphological progression of wild-type (WT), Ptenf/f Zfp36+/+ (Pten–/–), Ptenf/f Zfp36f/+ (Pten–/– Zfp36+/–), and Ptenf/f Zfp36f/+ (Pten–/– Zfp36–/–) dorsolateral prostate tissue at 8, 18, and 38 weeks. Scale bars: 100 μm. (B) Comparative weight of dorsolateral and ventral prostate tissue in GEMMs at 18 and 38 weeks. n = 5 mice per genotype, **P < 0.005, ***P < 0.0005, ****P < 0.0001 (1-way ANOVA with Tukey’s post hoc). (C) Kaplan-Meier graphs from GEMM aging studies show that prostate-specific deletion of Zfp36 significantly reduces time to ethical endpoint in PCa driven by loss of Pten n = 10 mice per genotype (Mantel-Cox log-rank test).
Figure 4
Figure 4. Zfp36 loss increases an inflammatory prostate cancer phenotype in Pten-null murine tumors.
(A) GSEA from RNA-Seq of endpoint GEMM PCa tumors comparing Pten–/– and Pten–/– Zfp36–/– GEMMs, highlighting positively and negatively enriched Hallmark pathways. (B) Phospho-p65 IF and Masson’s trichrome staining PCa in Pten–/–, Pten–/– Zfp36+/–, and Pten–/– Zfp36–/– GEMM dorsolateral prostate tissue at 38 weeks, with corresponding quantification. Scale bars: 100 μm. n = 5 mice per genotype; each mouse has been assigned a unique symbol for comparison across IHC analyses; *P < 0.05, **P < 0.005, ***P < 0.0005, ****P < 0.0001 (1-way ANOVA with Tukey’s post hoc).
Figure 5
Figure 5. Increased metastatic potential occurs with Zfp36 loss in Pten-null murine tumors.
(A) GSEA from RNA-Seq of endpoint GEMM PCa tumors comparing Pten–/– and Pten–/– Zfp36–/– GEMMs, highlighting significant positively and negatively enriched GOBP pathways. (B) Ki-67 IHC and Krt18 and αSMA IF staining PCa in Pten–/–, Pten–/– Zfp36+/–, and Pten–/– Zfp36–/– GEMM dorsolateral prostate tissue at 38 weeks, with corresponding quantification. Increased tumor cell proliferation and basement membrane breakdown are observed with loss of Zfp36. n = 5 mice per genotype, *P < 0.05, **P < 0.005, ***P < 0.0005 (1-way ANOVA with Tukey’s post hoc). Scale bar: 100 μm. (C) Number of mice that displayed PCa cells in distant organs by recombination PCR in Pten–/–, Pten–/– Zfp36+/–, and Pten–/– Zfp36–/– GEMMs. (D) Representative images and quantification of the full scan in FFPE sections of tumor-adjacent pelvic lymph nodes (LNs) in Pten–/– and Pten–/– Zfp36–/– mice. LNs were stained by multiplex IHC for Epcam (green), AR (red), and synaptophysin (Syp; white). Positive cells identify epithelial/tumoral cells metastasizing LNs (n = 3 mice per genotype). Scale bar: 50 μm. (E) Representative images and quantification of budding in GEMM-derived organoids highlighting increased invasive and metastatic potential of Pten–/– Zfp36–/– organoids. n = 5 unique organoid lines per genotype with experiment repeated once; experiments 1 and 2 are denoted by different symbols (technical replicates are underlaid in gray); ****P < 0.0001 (2-tailed Student’s t test). (F) Scratch assay in GEMM-derived 2D cells, comparing Pten–/– and Pten–/– Zfp36–/– wound healing with that of Pten–/– Rb1–/–, a previously described metastatic, neuroendocrine PCa murine cell line (32). Representative images of scratch assay have been overlaid with areas identified as wound infiltrate in black. n = 1 cell line per genotype with experiment repeated twice; experiments 1, 2, and 3 are denoted by unique symbols; *P < 0.05, ***P < 0.001, ****P < 0.0001 (2-way ANOVA with Tukey’s post hoc).
Figure 6
Figure 6. Loss of Zfp36 induces phenotypic plasticity in Pten-null murine prostate tumors.
(A) AR, synaptophysin (Syp), and CD45 IF staining PCa in Pten–/–, Pten–/– Zfp36+/–, and Pten–/– Zfp36–/– GEMM dorsolateral prostate tissue at 38 weeks, with corresponding quantification. Scale bars: 100 μm. n = 5 mice per genotype, *P < 0.05 (1-way ANOVA with Tukey’s post hoc). (B) Dual Krt8 and CD45 IF staining in Pten–/– and Pten–/– Zfp36–/– GEMM dorsolateral prostate tissue at 38 weeks. Scale bars: 50 μm.
Figure 7
Figure 7. Zfp36 loss drives castration resistance in Pten-null murine tumors, which is counteracted with the NF-κB inhibitor DMAPT.
(A) Kaplan-Meier graph aged GEMMs (Mantel-Cox log-rank test). Whole prostate weights 12 weeks after castration. n = 5 mice per genotype, *P < 0.05, ***P < 0.0005 (1-way ANOVA with Tukey’s post hoc). (B) GEMM-derived organoid growth with and without enzalutamide (10 μM). n = 1 unique organoid line per genotype, repeated twice; experiments are denoted by unique symbols; *P < 0.05, ***P < 0.0005 (2-tailed multiple t test). (C) Allograft tumor growth in mice treated with DMAPT (100 mg/kg/d) or vehicle with or without surgical castration. n = 5 mice per treatment group. (D) Allograft endpoint tumor volumes. n = 5 mice per treatment group, *P < 0.05, **P < 0.005, ****P < 0.0001 (1-way ANOVA with Tukey’s post hoc). (E and F) Representative images (E) and quantification (F) of cell death (green) in GEMM-derived PCa organoids treated with DMAPT (5 μM), enzalutamide (10 μM), or the combination of both for 72 hours. n = 5 unique organoid lines per genotype, repeated once; experiments 1 and 2 are denoted by unique symbols (technical replicates are underlaid in gray); ****P < 0.0001 (1-way ANOVA with Tukey’s post hoc). Scale bars: 100 μm. (G) Flow cytometry quantification for CD45, synaptophysin, and AR expression in GEMM-derived PCa organoids treated with DMAPT (5 μM) or DMSO vehicle for 72 hours. n = 3 per genotype. *P < 0.05; **P < 0.005; ***P < 0.0005 (2-way ANOVA with Fisher’s least significant difference (LSD) test). (H) Fold change of Fkbp5 in GEMM-derived 2D cell lines treated with DMAPT (5 μM) or DMSO vehicle for 72 hours with or without R1881 (10 nM) stimulation. n = 1 organoid line per genotype, repeated twice; experiments 1, 2, and 3 are denoted by unique symbols; *P < 0.05, **P < 0.005, ***P < 0.0005, ****P < 0.0001 (1-way ANOVA with Tukey’s post hoc). (I) Schematic overview with ZFP36 intact, epithelial cells present with a luminal lineage phenotype and sensitivity to AR inhibition. In response to increased NF-κB expression, ZFP36/TTP increases as part of a negative-feedback loop. Loss of ZFP36 results in an alternative epithelial cell lineage phenotype, with uncontrolled NF-κB activation and reduced response to AR inhibition. DMAPT treatment restores a more luminal epithelial cell type and sensitivity to AR inhibition.

Similar articles

References

    1. de Bono JS, et al. Prostate carcinogenesis: inflammatory storms. Nat Rev Cancer. 2020;20(8):455–469. doi: 10.1038/s41568-020-0267-9. - DOI - PubMed
    1. Sfanos KS, et al. The inflammatory microenvironment and microbiome in prostate cancer development. Nat Rev Urol. 2018;15(1):11–24. doi: 10.1038/nrurol.2017.167. - DOI - PubMed
    1. Jin R, et al. NF-κB gene signature predicts prostate cancer progression. Cancer Res. 2014;74(10):2763–2772. doi: 10.1158/0008-5472.CAN-13-2543. - DOI - PMC - PubMed
    1. Jin RJ, et al. The nuclear factor-κB pathway controls the progression of prostate cancer to androgen-independent growth. Cancer Res. 2008;68(16):6762–6769. doi: 10.1158/0008-5472.CAN-08-0107. - DOI - PMC - PubMed
    1. Ammirante M, et al. B-cell-derived lymphotoxin promotes castration-resistant prostate cancer. Nature. 2010;464(7286):302–305. doi: 10.1038/nature08782. - DOI - PMC - PubMed

MeSH terms