. 2024 Nov 19;135(2):e177824.
doi: 10.1172/JCI177824.

Tumor cell-derived spermidine promotes a protumorigenic immune microenvironment in glioblastoma via CD8+ T cell inhibition

Affiliations

Tumor cell-derived spermidine promotes a protumorigenic immune microenvironment in glioblastoma via CD8+ T cell inhibition

Kristen E Kay et al. J Clin Invest. .

Abstract

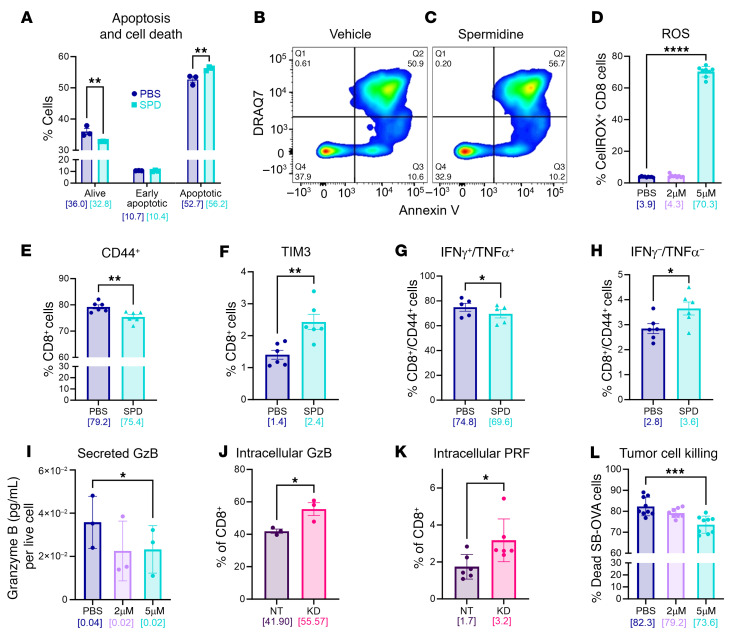
The glioblastoma (GBM) microenvironment is enriched in immunosuppressive factors that potently interfere with the function of cytotoxic T lymphocytes. Cancer cells can directly affect the immune system, but the mechanisms driving these interactions are not completely clear. Here, we demonstrate that the polyamine metabolite spermidine (SPD) was elevated in the GBM tumor microenvironment. Exogenous administration of SPD drove tumor aggressiveness in an immune-dependent manner in preclinical mouse models via reduction of CD8+ T cell frequency and reduced cytotoxic function. Knockdown of ornithine decarboxylase, the rate-limiting enzyme in SPD synthesis, did not affect cancer cell growth in vitro but did result in extended survival. Furthermore, patients with GBM with a more favorable outcome had a significant reduction in SPD compared with patients with a poor prognosis. Our results demonstrate that SPD functions as a cancer cell-derived metabolite that drives tumor progression by reducing CD8+ T cell numbers and function.

Keywords: Adaptive immunity; Brain cancer; Immunology; Oncology; Polyamines.


Conflict of interest statement

Conflict of interest: JDL reports being named as a coinventor on pending and issued patents held by the Cleveland Clinic relating to cancer therapies (“Cancer treatment using CX26 blocking peptides”; patent number 11136368). SLH and ZW report being named as coinventors on pending and issued patents held by the Cleveland Clinic relating to cardiovascular diagnostics and therapeutics, and being eligible to receive royalty payments for inventions or discoveries related to cardiovascular diagnostics or therapeutics from Cleveland HeartLab, a wholly owned subsidiary of Quest Diagnostics, Procter & Gamble, and Zehna Therapeutics. SLH also reports being a paid consultant for Zehna Therapeutics and having received research funds from Zehna Therapeutics.

Figures

Figure 1
Figure 1. SPD levels are increased in mouse GBM models and drive GBM progression.
(A) Polyamine biosynthesis pathway. ARG, arginase; ODC, ornithine decarboxylase; PAOX, polyamine oxidase; SMOX, spermidine oxidase; SRM, spermidine synthase; SMS, spermine synthase; SSAT, spermidine/spermine acetyltransferase. (BD) Liquid chromatography–mass spectrometry was performed on tumors removed from male B6 mice 17 days after intracranial injection of mouse GBM cell lines (25,000 GL261 cells per injection). (E) Experimental paradigm for subsequent mouse experiments receiving tumor implantation followed by 50 mg/kg SPD i.p. treatment or PBS vehicle. (F) Liquid chromatography–tandem mass spectrometry of tumor-bearing hemisphere of mice treated with i.p. SPD. (G and H) Survival analysis was performed after intracranial injection of mouse GBM cell lines (25,000 GL261 cells per injection, 20,000 SB28 cells per injection) in B6 mice. Median survival days and number of animals are indicated in the graphs. Data combined from 3 independent experiments. Statistical significance for BD and F was determined by unpaired, 2-tailed t test (*P < 0.05, **P < 0.01). Statistical significance for G and H was determined by log-rank test, considering P values less than 0.05 to be significant. Bracketed numbers indicate the mean.
Figure 2
Figure 2. SPD interacts with the immune system to drive GBM progression.
(A and B) Mouse glioma cells treated with 5 μM SPD in vitro for 72 hours; data are representative of 3 independent experiments. (C and D) Survival analysis was performed after intracranial injection of mouse GBM cell lines (25,000 GL261 cells per injection, 20,000 SB28 cells per injection) in immunocompromised male NSG mice, followed by 50 mg/kg SPD i.p. treatment or PBS vehicle. Median survival days and number of animals are indicated in the graphs. Statistical significance was determined by log-rank test, considering P values less than 0.05 to be significant.
Figure 3
Figure 3. Lymphocyte subsets are affected by SPD.
(A and B) Splenocyte-derived lymphocyte subsets were treated with physiological levels of SPD in vitro; data are representative of 3 independent experiments. (C and D) Survival analysis was performed after intracranial injection of mouse GBM cell lines (25,000 GL261 cells per injection, 20,000 SB28 cells per injection) in male Rag1-knockout mice, followed by 50 mg/kg SPD i.p. treatment or PBS vehicle. Median survival days and number of animals are indicated in the graphs. Data combined from 2 independent experiments. Statistical significance for A and B was determined by 1-way ANOVA (*P < 0.05). Statistical significance for C and D was determined by log-rank test, considering P values less than 0.05 to be significant.
Figure 4
Figure 4. Exogenous treatment with SPD decreases cytotoxicity of CD8+ T cells.
After intracranial injection of mouse GBM cell line SB28 (20,000 cells per injection) into male B6 mice followed by 50 mg/kg SPD i.p. treatment or PBS vehicle, the tumor-bearing hemisphere was collected and processed for flow cytometry immune phenotyping. (A) Ratio of CD8+ T cells to CD4+ Tregs. (B and C) Proportion of T cells in CD45+ cells. (D and E) Exhaustion markers of CD8+ T cells. Statistical significance for AE was determined by unpaired, 2-tailed t test (*P < 0.05, **P < 0.01).
Figure 5
Figure 5. Knockdown of the polyamine biosynthesis pathway extends survival.
(A) mRNA expression of ODC1 in shRNA knockdown mouse glioma cells compared with non-targeted control. (B) Conditioned medium SPD measurement via mass spectrometry. (C) Cell count after 72 hours of growth. (D) Survival analysis was performed after intracranial injection of shRNA-modified mouse GBM cells (20,000 non-target or ODC1-knockdown [KD] SB28 cells) in B6 mice. Median survival days and number of animals are indicated in the graph. Data combined from 2 independent experiments. (E and F) Immune phenotyping via flow cytometry was performed on tumors removed from B6 mice 14 days after intracranial injection of shRNA-modified mouse GBM cells (20,000 non-target or ODC1-KD SB28 cells). (E) Percentage of CD8+ cells in tumor. (F) Proliferation marker in CD8+ T cells. (G) Survival analysis was performed after intracranial injection of shRNA-modified mouse GBM cells (20,000 non-target or ODC1-KD SB28 cells) in B6 mice, followed by SPD or PBS vehicle treatment as described in Figure 1E. Median survival days and number of animals are indicated on the graph. Statistical significance for D and G was determined by log-rank test, considering P values less than 0.05 to be significant (*P < 0.05, **P < 0.01). Statistical significance for A, C, E, and F was determined by unpaired, 2-tailed t test (*P < 0.05, ****P < 0.0001).
Figure 6
Figure 6. CD8+ T cells have reduced viability and functionality in the presence of SPD.
(AC) Splenocyte-derived CD8+ T cells were treated with 5 μM SPD in vitro. (A) Apoptotic cells and cell death were measured via annexin V and DRAQ7 staining, respectively, and analyzed via flow cytometry; data are representative of 3 independent experiments. (B and C) Visual representation of gain in double-positive cells under SPD treatment. (D) ROS levels in CD8+ T cells treated with varying concentrations of SPD measured via CellROX flow cytometry assay; data are representative of 3 independent experiments. (E and F) T cell markers in CD8+ population treated with PBS or 5 μM SPD. (G and H) IFN-γ+TNF-α+ (G) and IFN-γTNF-α (H) subsets in the CD8+CD44+ T cell population. (I) Granzyme B (GzB) levels measured via ELISA in conditioned medium from CD8+ T cells treated in vitro with varying concentrations of SPD; data are representative of 3 independent experiments. (J and K) Intracellular flow cytometry measurement of GzB (J) and perforin (PRF) (K) in CD8+ T cells treated with conditioned medium from non-target or ODC1-KD cells; data are representative of 3 independent experiments. (L) Viability of tumor cells after Transwell coculture with SPD-treated CD8+ T cells via cell killing assay; data combined from 3 experiments. Statistical significance in A was determined by 2-way ANOVA (**P < 0.01). Statistical significance in D, I, and L was determined by 1-way ANOVA (*P < 0.05, ***P < 0.001, ****P < 0.0001). Statistical significance in EH, J, and K was determined by unpaired, 2-tailed t test (*P < 0.05, **P < 0.01). Bracketed numbers indicate the mean.
Figure 7
Figure 7. Patients with GBM have increased ODC1 expression and high SPD levels that are correlated with poorer prognosis.
(A) mRNA expression of ODC1 from GTEX non-neoplastic and TCGA lower-grade gliomas and GBM tumor tissue, as notated in 2011 WHO classification. FPKM, fragments per kilobase of transcript per million mapped reads. (B) Single-cell RNA-Seq correlation of ODC1 expression in tumor cells and number of CD8+ cells in the tumor microenvironment. (C) Schematic of Visium single-cell analysis; heatmap showing that presence of CD8+ T cells correlates with surrounding polyamine pathway gene expression by tumor cells. ARG1, arginase 1; ODC1, ornithine decarboxylase; PAOX, polyamine oxidase; SAT1, spermidine/spermine acetyltransferase 1; SMOX, spermidine oxidase; SRM, spermidine synthase. (D) Long-term versus short-term survivor SPD levels in tumor tissue at primary resection of patients with GBM; metabolites measured via liquid chromatography–tandem mass spectrometry. Statistical significance in A was determined by 1-way ANOVA (****P < 0.001). Statistical significance in B was determined by linear regression. Statistical significance in D was determined by unpaired, 2-tailed t test (*P < 0.05).

Update of

References

    1. Stupp R, et al. High-grade glioma: ESMO Clinical Practice Guidelines for diagnosis, treatment and follow-up. Ann Oncol. 2014;25(suppl 3):iii93–iii101. doi: 10.1093/annonc/mdu050. - DOI - PubMed
    1. Bell EH, et al. Molecular-based recursive partitioning analysis model for glioblastoma in the temozolomide era: a correlative analysis based on NRG oncology RTOG 0525. JAMA Oncol. 2017;3(6):784–792. doi: 10.1001/jamaoncol.2016.6020. - DOI - PMC - PubMed
    1. Furnari FB, et al. Malignant astrocytic glioma: genetics, biology, and paths to treatment. Genes Dev. 2007;21(21):2683–2710. doi: 10.1101/gad.1596707. - DOI - PubMed
    1. Ries CH, et al. Targeting tumor-associated macrophages with anti-CSF-1R antibody reveals a strategy for cancer therapy. Cancer Cell. 2014;25(6):846–859. doi: 10.1016/j.ccr.2014.05.016. - DOI - PubMed
    1. Chaput N, et al. Baseline gut microbiota predicts clinical response and colitis in metastatic melanoma patients treated with ipilimumab. Ann Oncol. 2017;28(6):1368–1379. doi: 10.1093/annonc/mdx108. - DOI - PubMed

MeSH terms