. 2024 Nov 19;20(11):e1011479.
doi: 10.1371/journal.pgen.1011479. eCollection 2024 Nov.

RAD52 and ERCC6L/PICH have a compensatory relationship for genome stability in mitosis

Affiliations

RAD52 and ERCC6L/PICH have a compensatory relationship for genome stability in mitosis

Beth Osia et al. PLoS Genet. .

Abstract

Mammalian RAD52 is a DNA repair factor with strand annealing and recombination mediator activities that appear important in both interphase and mitotic cells. Nonetheless, RAD52 is dispensable for cell viability. To query RAD52 synthetic lethal relationships, we performed genome-wide CRISPR knock-out screens and identified hundreds of candidate synthetic lethal interactions. We then performed secondary screening and identified genes for which depletion causes reduced viability and elevated genome instability (increased 53BP1 nuclear foci) in RAD52-deficient cells. One such factor was ERCC6L, which marks DNA bridges during anaphase, and hence is important for genome stability in mitosis. Thus, we investigated the functional interrelationship between RAD52 and ERCC6L. We found that RAD52 deficiency increases ERCC6L-coated anaphase ultrafine bridges, and that ERCC6L depletion causes elevated RAD52 foci in prometaphase and interphase cells. These effects were enhanced with replication stress (i.e. hydroxyurea) and topoisomerase IIα inhibition (ICRF-193), where post-treatment effect timings were consistent with defects in addressing stress in mitosis. Altogether, we suggest that RAD52 and ERCC6L co-compensate to protect genome stability in mitosis.


Conflict of interest statement

The authors have declared that no competing interests exist.

Figures

Fig 1
Fig 1. Genome-wide CRIPSR knockout screen identifies pathways that are synthetic lethal with RAD52.
a) The RAD52 knockout (RAD52KO) cell line using p53KO Cas9-FLAG-expressing RPE-1 hTERT (RAD52WT). Shown is a schematic of RAD52 with blue arrows depicting two sgRNAs used to generate a deletion in the RAD52 gene, which was assessed by PCR using primers OL1 and OL2 (left gel), along with Immunoblot (right blot). *non-specific band. b) Schematic of genome-wide CRISPR knockout screen to identify RAD52 synthetic lethal interactors. c) Shown are synthetic lethal hits (orange data points) identified under each screening condition by applying cutoffs of 1.5x the standard deviation from the diagonal axis, x = 0 and y = 0 of the Beta (selectivity) scores generated by MAGeCKFlute. The IR screen hit, ERCC6L, is highlighted in teal to show its position on all three plots as it is the topic of downstream analysis later in this study. d) Heatmap of normalized beta scores for genes known to be linked to IR (NHEJ/ATM genes) and Cis-Pt (FA-pathway genes) sensitivity.
Fig 2
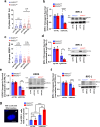
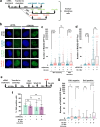
Fig 2. Secondary screen of 59 genes identifies 16 genes for which depletion causes G1-phase 53BP1 foci in RAD52KO cells.
a) Strategy for selecting 59 genes for secondary screening. Gene set enrichment analysis (GSEA) was performed on gene hits (orange text) from each screen independently and enriched ontologies (blue text) were selected based on false discovery rate (FDR) cutoff. Combined enriched ontologies from the 3 screens were then filtered by cutoffs for normalized enrichment score (NES) and minimum number of enriched genes. The 59 genes selected for the subscreen were chosen from the 67 ontologies (232 genes) that represent processes/pathways in the nucleus (at least 1 gene/ontology). b) 53BP1 foci assay. Shown is an illustration that DSBs that persist through mitosis (M) form G1 53BP1 nuclear bodies (left), along with a representative immunofluorescence image of 53BP1 and Cyclin A. Scale bar is 20 μm. Image taken at 20x magnification. c) Effects of siRNAs targeting the 59 genes (pool of 4 siRNAs per gene) in (a) on G1 53BP1 foci in RAD52KO cells, compared to non-targeting control siRNA (siCTRL). Highlighted in red are the siRNAs that caused a significant, i.e., p<0.05 by Kolmogorov-Smirnov (K-S) test and >1.5-fold mean, increase in G1 53BP1 foci. N>50 total nuclei (G1 and S/G2) per siRNA. d) Heatmap of normalized beta scores from the genome-wide screens (Fig 1B) for the 5 hits selected by the siRNA subscreen.
Fig 3
Fig 3. ERCC6L/PICH depletion causes elevated G1-phase 53BP1 foci and micronuclei formation, and reduced clonogenic survival in RAD52KO cells.
a) G1 53BP1 foci increase with depletion of ERCC6L by siERCC6L (pool of 4 siRNAs) treatment in RAD52KO, but not RAD52WT RPE-1 cells. ns = not significant, * = p<0.05 by K-S test. Bars show mean foci value. Mean fold-increase is shown for significant comparisons. The total number of nuclei analyzed per condition was >50, with the number of G1 nuclei (N) analyzed per condition at N = 29–75. b) Clonogenic survival is reduced in RAD52KO RPE-1 cells with depletion of ERCC6L by siERCC6L. Clonogenic survival after siERCC6L treatment is normalized to each respective siCTRL treated line (siCTRL = 1). **** = p<0.0001 by unpaired t-test. N = 6 replicates. Immunoblot confirming ERCC6L depletion via siERCC6L in RAD52KO and RAD52WT RPE-1 cell lines is shown at right. *non-specific band. c) G1 53BP1 foci increase with knock-down of ERCC6L by sgERCC6L treatment in RAD52KO and RAD52WT RPE-1 cells. **** = p<0.0001 by K-S test, bars show mean foci value. Mean fold-increase is shown for significant comparisons. Number of G1 nuclei (N) analyzed per condition is N = 214–276. d) Clonogenic survival and Immunoblot as in (b) but with ERCC6L knock-down by sgERCC6L. * = p<0.05 by unpaired t-test. N = 6 replicates. e) Clonogenic survival and Immunoblot as in (b) but in RAD52KO and RAD52WT U2OS cells. ** = p<0.01 by unpaired t-test. N = 6 replicates. f) Clonogenic survival and Immunoblot as in (b) but with BRCA2 depletion by siBRCA2 in RPE-1 cells. *** = p<0.001 by unpaired t-test. N = 6 replicates. g) (Left) Example of micronucleus in RPE-1 cell (white arrowhead). Scale bar is 10μm, and images were taken at 40x magnification (Right) Frequency of micronuclei increases with siERCC6L treatment in RAD52KO cells, but not with siCTRL treatment in RAD52KO cells as compared to RAD52WT. ns = not significant, ** = p<0.01, and *** = p<0.001 by unpaired t-test. N = 3 coverslips analyzed per condition, with at least 10 fields per coverslip.
Fig 4
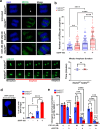
Fig 4. RAD52 suppresses the accumulation of ERCC6L Ultra-Fine DNA bridges in anaphase.
a) ERCC6L UFBs in RPE-1 cells. Shown are examples of anaphase cells stained with ERCC6L for RAD52WT and RAD52KO cells with and without exposure to ICRF-193 [200 mM, 6-hour treatment]. White arrowhead indicates ERCC6L-UFBs in untreated RAD52WT cells. Scale bar is 10 μm, and images were taken at 60x magnification. b) Anaphase ERCC6L-UFBs are increased in RAD52KO cells as compared to RAD52WT cells, which is amplified by exposure to ICRF-193 as shown in (a). Bars show mean value. The number of anaphases (N) analyzed per condition are N = 140–159. Significance determined by K-S test, ** = p<0.01, **** = p<0.0001. c) Live cell imaging of mitotic cells shows no significant difference in anaphase timing between RAD52WT and RAD52KO RPE-1 cells. (Left) Example of imaging of anaphase duration. Cells were labeled with H2B-GFP and imaged at a rate of 2min per frame. Scale bar is 20 μm, and images were taken at 20x magnification. (Right) Quantification of average anaphase duration for each cell line. Bars show average duration across N = 3 experiments, where at least 50 cells were analyzed per experiment. Significance determined by unpaired t-test. ns = not significant. d) (Left) Example of DAPI-staining chromatin bridge in RPE-1 cells. Images were taken at 20x magnification, and scale bar is 10μm. (Right) Frequency of DAPI/chromatin bridges increases in RAD52KO cells as compared to RAD52WT cells with DMSO and ICRF-193 treatment. * = p<0.05 and **** = p<0.0001 by unpaired t-test. N = 3 coverslips analyzed per condition, with at least 4 independent fields per coverslip. e) ICRF-193 exposure significantly impacts viability in siERCC6L-treated (pool of 4 siRNAs) RAD52WT and RAD52KO cells but does not significantly impact viability in RAD52KO cells without siERCC6L. ICRF-193 treatments were for 55-hours. ns = not significant, * = p<0.05, *** = p<0.001, and **** = p<0.0001. Unpaired t-test. N = 6 replicates.
Fig 5
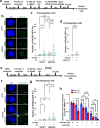
Fig 5. RAD52 forms foci in prometaphase cells in response to ERCC6L depletion.
a) Schematic of treatments used to examine RAD52-GFP foci in prometaphase cells. b) Shown are representative images of prometaphase cells with RAD52-GFP foci, after treatments as shown in (a). Scale bars are 10 μm, and images were taken at 40x magnification. c) Treatments with siERCC6L (pool of 4 siRNAs) and HU each induce significant increases in RAD52-GFP foci in prometaphase cells. Cells were treated as in (a) and analyzed as in (b). Bars indicate mean foci values, and fold increases are shown. * = p<0.05, ** = p<0.01, and *** = p<0.001, K-S test. The number of nuclei (N) analyzed per condition are N = 210–218. d) Treatment with CRISPR-Cas9 guides targeting ERCC6L (sgERCC6L, pool of 3 guides) induces a similar increase in RAD52-GFP foci as seen in (c). Cells were treated as in (S6A Fig). Bars show mean foci values, and fold increase is indicated. **** = p<0.0001, K-S test. The number of nuclei (N) analyzed per condition are N = 323–336. e) Schematic of treatments to examine RAD52-GFP foci without using the CDK1 inhibitor RO3306 (i.e., no induction of G2/M arrest). f) Shown are representative images of RAD52-GFP foci from the treatments as shown in (e). Scale bars are 10 μm and images were taken at 40x magnification. g) Without RO3306-induced G2/M arrest, RAD52-GFP foci are increased with siERCC6L treatment, but not HU treatment. Cells were treated as in (e) and analyzed as in (f). Shown are mean foci values and fold increases. N = 225–237. ns = not significant, * = p<0.05, ** = p<0.01, K-S test. h) RO3306 exposure significantly impacts survival in RAD52KO cells with and without ERCC6L depletion, and ERCC6L-depleted RAD52WT cells at the high (3 μM), but not low (1 μM) concentration. Clonogenic survival assay was performed with two concentrations of RO3306 (1 μM or 3 μM) for 48 hours in RAD52WT and RAD52KO cell lines. Clonogenic survival is normalized to DMSO and siCTRL treated RAD52WT and RAD52KO cell lines (DMSO siCTRL = 1). ns = not significant, * = p<0.05, ** = p<0.01, *** = p<0.001, unpaired t-test. N = 6 replicates.
Fig 6
Fig 6. RAD52 foci induced by ERCC6L depletion are distinct from sites of mitotic DNA synthesis (MiDAS).
a) Schematic of treatments used for MiDAS detection in prometaphase cells expressing RAD52-GFP. b) Shown are representative images of APH-treated cells with RAD52-GFP and EdU foci. Merge and zoom images show individual RAD52-GFP (green arrow), EdU (red arrow), and colocalized foci (white arrow). Scale bars are 10 μm, and images were taken at 40x magnification. c) RAD52-GFP foci are induced by treatments with aphidicolin (APH, 46 hours) and siERCC6L (pool of 4 siRNAs), but are not further increased with combined treatment of siERCC6L and APH. Treatments were performed as in (a). Bars show mean foci value. The number of nuclei (N) analyzed per condition are N = 158–162. ns = not significant, *** = p<0.001, and **** = p<0.0001, K-S test. d) EdU foci increase with APH treatment, but not with siERCC6L treatment. Treatments were as in (a). Bars show mean foci value. N = 158–162. ns = not significant, **** = p<0.0001, K-S test. e) No significant difference in the percentage of cells with 5 or more EdU foci between siCTRL and siERCC6L treated cells after APH exposure. Analysis of the data shown in (c) and (d). N = 3 independent experiments. ns = not significant, unpaired t-test. f) The percentage of EdU foci that colocalize with RAD52-GFP foci in cells that have ≥5 EdU foci is not significantly different in cells treated with siCTRL or siERCC6L after APH exposure. Analysis of the data shown in (c) and (d). N = 3 independent experiments. ns = not significant, unpaired t-test.
Fig 7
Fig 7. Replication Stress induces delayed RAD52-GFP foci in interphase cells with ERCC6L depletion.
a) Schematic of treatments to examine RAD52-GFP foci in interphase cells. b) Shown are representative images of interphase cells to detect RAD52-GFP foci. Treatments were performed as shown in (a). Scale bars are 10 μm and images were taken at 40x magnification. c) RAD52-GFP foci in interphase cells significantly increase with siERCC6L treatment (pool of 4 siRNAs) both without HU treatment, and when combined with a 4 hr HU treatment followed by recovery for 16 hr. Bars show mean foci value, and fold-increases are shown. The number of nuclei (N) analyzed per condition are N = 372–462. ns = not significant, *** = p<0.001, and **** = p<0.0001, K-S test. d) RAD52-GFP foci in interphase cells are significantly increased by 16-hour HU exposure, which is not further increased with siERCC6L treatment. Bars and fold-increases are as in (c). N = 349–380. ns = not significant, *** = p<0.001, and **** = p<0.0001, K-S test. e) Schematic of experiment to examine RAD52-GFP foci in interphase cells with EdU labeling after DMSO or HU treatment and recovery. f) siERCC6L and HU treatments shown in (e) do not alter the percentage of cells undergoing DNA synthesis (EdU-positive cells). ns = not significant, unpaired t-test. N = 3 independent coverslips analyzed. g) RAD52-GFP foci in interphase cells significantly increase with siERCC6L treatment in EdU-negative cells with and without HU treatment but are only significantly increased in EdU-positive cells after HU treatment and recovery. Bars show mean foci value. The number of nuclei (N) analyzed per condition are N = 330–342. ns = not significant, * = p<0.05, and *** = p<0.001, K-S test.
Fig 8
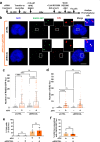
Fig 8. ERCC6L depletion induces RAD51 foci in interphase cells that co-localize with RAD52-GFP foci.
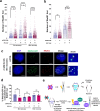
a-b) RAD51 foci in interphase cells significantly increase with siERCC6L treatment (pool of 4 siRNAs) both with and without HU treatment. Experiments were performed with the same conditions shown in Fig 7A for ERCC6L depletion and HU exposure. Bars show mean foci value. The number of nuclei (N) analyzed per condition are N = 456–480 (a) and N = 457–468 (b). ns = not significant (p-value shown), ** = p<0.01, and **** = p<0.0001, K-S test. c) Shown are representative images of interphase cells to detect co-localization of RAD52-GFP and RAD51 foci. Scale bars are 10 μm and images were taken at 40x magnification. White boxes on merge show location of zoom. d) The percentage of RAD52-GFP foci that colocalize with RAD51 foci in cells with ≥10 RAD52-GFP foci is not significantly different in cells treated with siCTRL or siERCC6L with or without HU exposure. Treatment conditions are identical to those shown in (a). N = 3 independent experiments. ns = not significant, unpaired t-test. e) Speculative model of the co-compensatory relationship between RAD52 and ERCC6L to mitigate genotoxic stress.

Update of

Similar articles

References

    1. Saotome M, Saito K, Yasuda T, Ohtomo H, Sugiyama S, Nishimura Y, et al.. Structural Basis of Homology-Directed DNA Repair Mediated by RAD52. iScience. 2018;3: 50–62. doi: 10.1016/j.isci.2018.04.005 - DOI - PMC - PubMed
    1. Jalan M, Olsen KS, Powell SN. Emerging Roles of RAD52 in Genome Maintenance. Cancers. 2019;11: 1038. doi: 10.3390/cancers11071038 - DOI - PMC - PubMed
    1. Liang C-C, Greenhough LA, Masino L, Maslen S, Bajrami I, Tuppi M, et al.. Mechanism of single-stranded DNA annealing by RAD52–RPA complex. Nature. 2024; 1–7. doi: 10.1038/s41586-024-07347-7 - DOI - PMC - PubMed
    1. Stark JM, Pierce AJ, Oh J, Pastink A, Jasin M. Genetic steps of mammalian homologous repair with distinct mutagenic consequences. Mol Cell Biol. 2004;24: 9305–9316. doi: 10.1128/MCB.24.21.9305-9316.2004 - DOI - PMC - PubMed
    1. Motycka TA, Bessho T, Post SM, Sung P, Tomkinson AE. Physical and Functional Interaction between the XPF/ERCC1 Endonuclease and hRad52 *. Journal of Biological Chemistry. 2004;279: 13634–13639. doi: 10.1074/jbc.M313779200 - DOI - PubMed

MeSH terms

Substances

LinkOut - more resources