

Identification and quantification of the molecular species of bilirubin BDG, BMG and UCB by LC‒MS/MS in hyperbilirubinemic human serum
- PMID: 39561208
- PMCID: PMC11575834
- DOI: 10.1371/journal.pone.0313044
Identification and quantification of the molecular species of bilirubin BDG, BMG and UCB by LC‒MS/MS in hyperbilirubinemic human serum
Abstract
Background and aims: Unconjugated bilirubin (UCB) is a byproduct of the heme group that indicates irregularities in the metabolism of several important biological molecules, such as hemoglobin. UCB is processed by hepatic UGT1A1, which catalyzes its conjugation to the metabolites bilirubin diglucuronide (BDG) and bilirubin monoglucuronide (BMG). The serum concentrations of BDG and BMG may indicate liver injury or dysfunction. The aim of this study was to standardize and validate a method for the identification and simultaneous quantification of BMG, BDG and UCB by LC‒MS/MS.
Methods: Liquid‒liquid extraction allows the separation of UCB, BMG and BDG from the serum of healthy subjects or patients with liver injury. Detection and quantification were performed using an LC‒MS/MS method. Compound separation was achieved with a BEH-C18 column at 40°C. The mobile phase was prepared with 5 mM ammonium acetate (pH 6) and acetonitrile, and a flow gradient was applied.
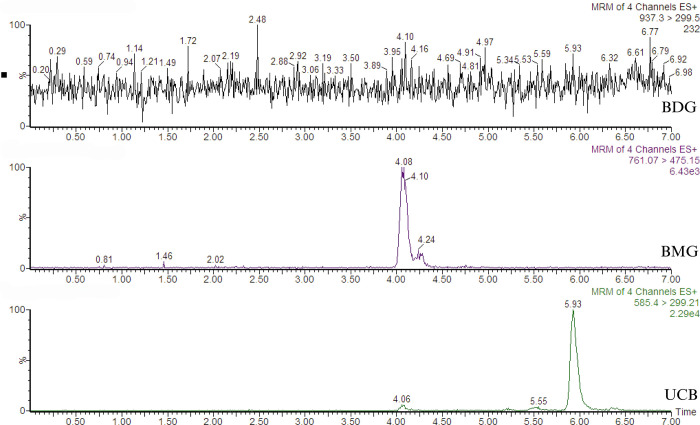
Results: This is the first study to directly quantify BMG and UCB levels in human serum; no postcalculations or correction factors are needed. However, BDG quantification requires calculations and a correction factor. We identified the molecular species with ionic transitions m/z1+ 585.4 > 299.2 for UCB, 761.3 > 475.3 for BMG, 937.3 > 299.5 for BDG and mesobilirubin 589.4 > 301.3 (IS).
Conclusion: The procedures used in this study allowed the simultaneous identification and quantification of the molecular species of bilirubin, BDG, BMG and UCB. Analysis of the serum levels in patients with hyperbilirubinemia revealed that patients with acute-on-chronic liver failure had elevated levels of these species.
Copyright: © 2024 Castillo-Castañeda et al. This is an open access article distributed under the terms of the Creative Commons Attribution License, which permits unrestricted use, distribution, and reproduction in any medium, provided the original author and source are credited.
Conflict of interest statement
The authors have declared that no competing interests exist.
Figures


References
-
- Pincus MR, Tierno PM, Fenelus M, Bowne WB, Bluth MH. Evaluation of Liver Function. Henry’s Clinical Diagnosis and Management by Laboratory Methods. 2011;296–311.
-
- Méndez-Sánchez N, Vítek L, Aguilar-Olivos NE, Uribe M. Bilirubin as a Biomarker in Liver Disease. In 2016. p. 1–25.
-
- Vitek L, Hinds TD, Stec DE, Tiribelli C. The physiology of bilirubin: health and disease equilibrium. Trends Mol Med [Internet]. 2023. Apr 1 [cited 2024 May 6];29(4):315–28. Available from: https://pubmed.ncbi.nlm.nih.gov/36828710/ doi: 10.1016/j.molmed.2023.01.007 - DOI - PMC - PubMed
MeSH terms
Substances
LinkOut - more resources
Full Text Sources
Medical
