. 2024 Nov 19;20(11):e1012709.
doi: 10.1371/journal.ppat.1012709. eCollection 2024 Nov.

Sustained immune activation and impaired epithelial barrier integrity in the ectocervix of women with chronic HIV infection

Affiliations

Sustained immune activation and impaired epithelial barrier integrity in the ectocervix of women with chronic HIV infection

Mathias Franzén Boger et al. PLoS Pathog. .

Abstract

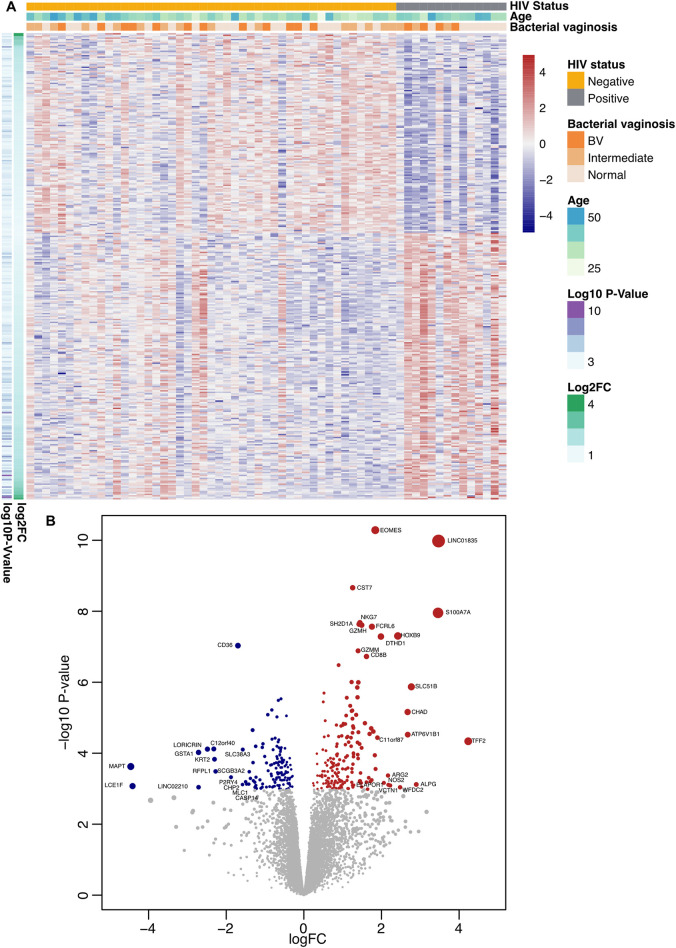
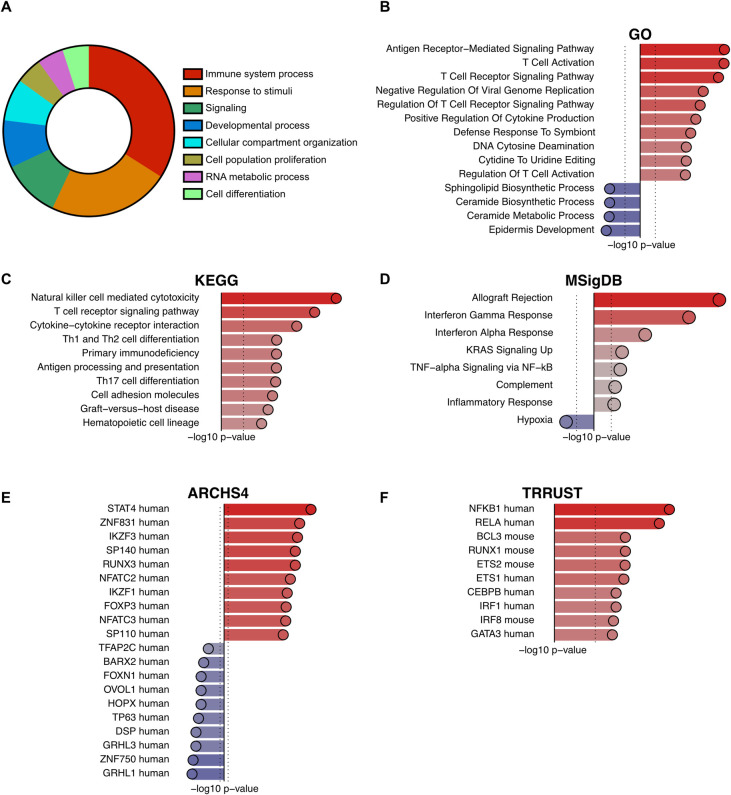
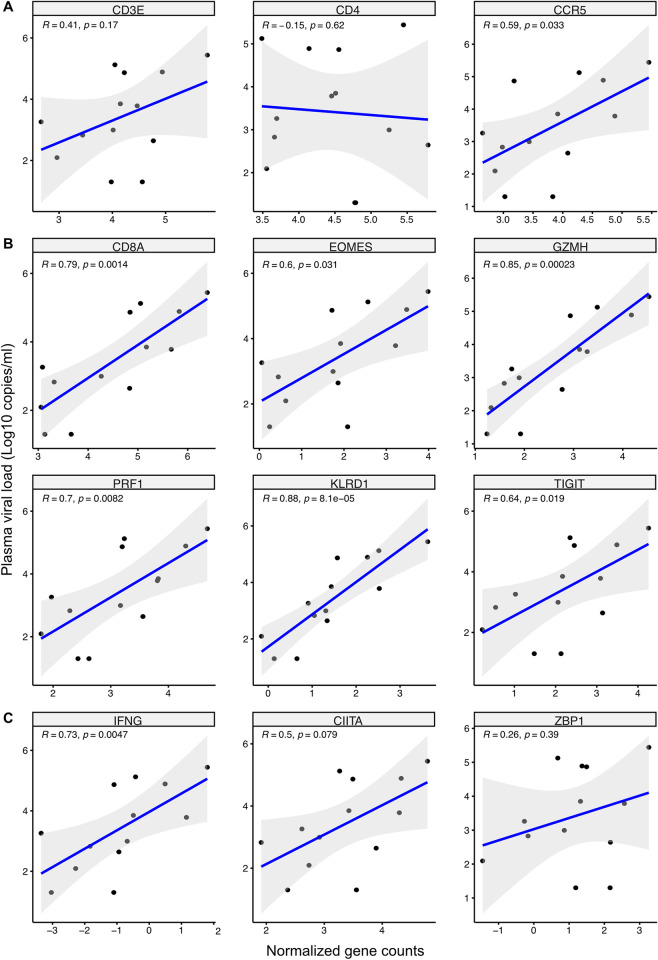
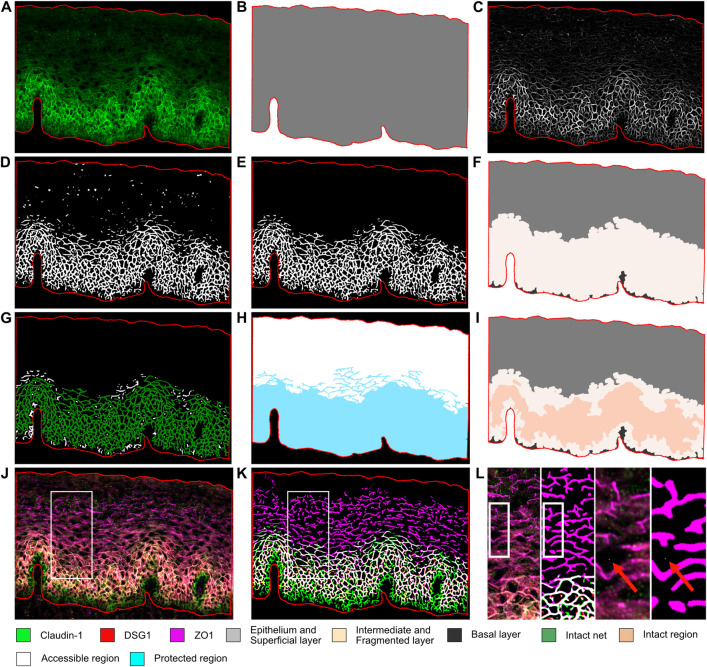
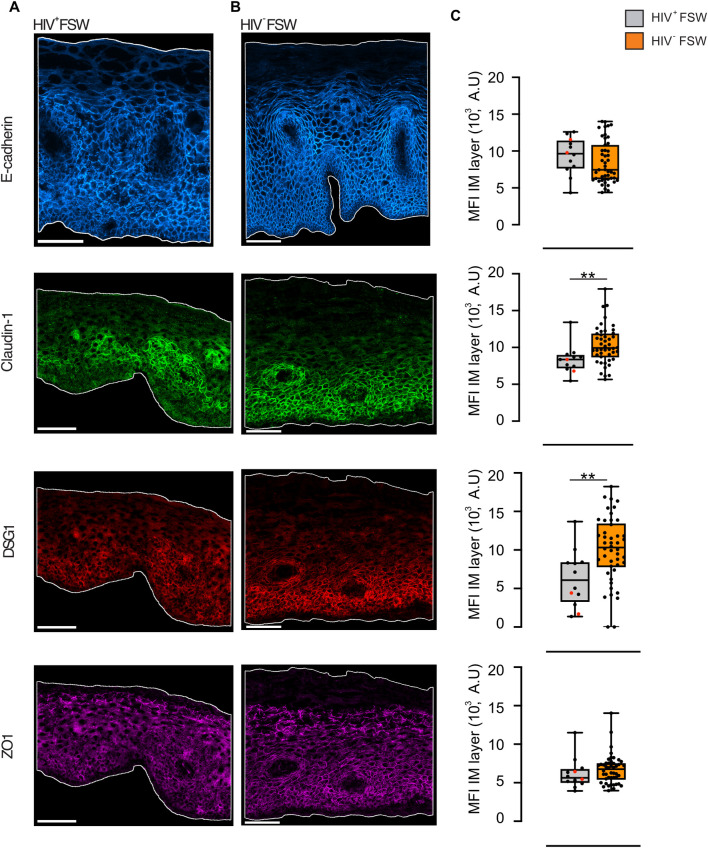
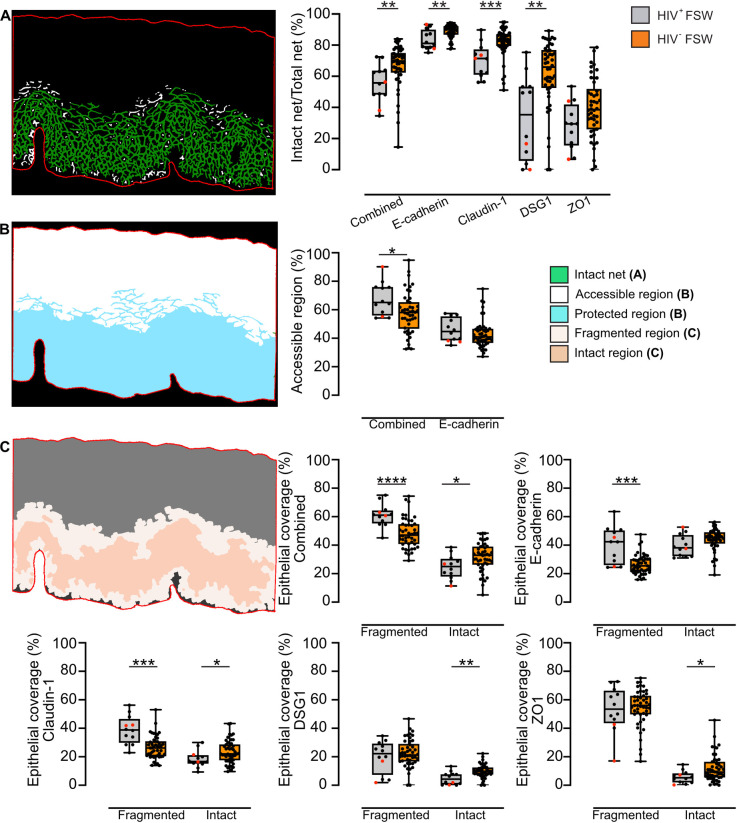
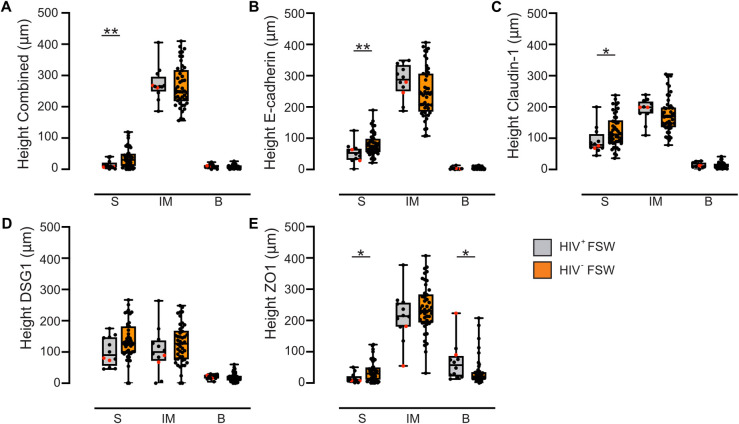
Chronic systemic immune activation significantly influences human immunodeficiency virus (HIV) disease progression. Despite evidence of a pro-inflammatory environment in the genital tract of HIV-infected women, comprehensive investigations into cervical tissue from this region remain limited. Similarly, the consequences of chronic HIV infection on the integrity of the female genital epithelium are poorly understood, despite its importance in HIV transmission and replication. Ectocervical biopsies were obtained from HIV-seropositive (n = 14) and HIV-seronegative (n = 47) female Kenyan sex workers. RNA sequencing and bioimage analysis of epithelial junction proteins (E-cadherin, desmoglein-1, claudin-1, and zonula occludens-1) were conducted, along with CD4 staining. RNA sequencing revealed upregulation of immunoregulatory genes in HIV-seropositive women, primarily associated with heightened T cell activity and interferon signaling, which further correlated with plasma viral load. Transcription factor analysis confirmed the upregulation of pro-inflammatory transcription factors, such as RELA, NFKB1, and IKZF3, which facilitates HIV persistence in T cells. Conversely, genes and pathways associated with epithelial barrier function and structure were downregulated in the context of HIV. Digital bioimage analysis corroborated these findings, revealing significant disruption of various epithelial junction proteins in ectocervical tissues of the HIV-seropositive women. Thus, chronic HIV infection associated with ectocervical inflammation, characterized by induced T cell responses and interferon signaling, coupled with epithelial disruption. These alterations may influence HIV transmission and heighten susceptibility to other sexually transmitted infections. These findings prompt exploration of therapeutic interventions to address HIV-related complications and mitigate the risk of sexually transmitted infection transmission.


Conflict of interest statement

P. Cz. is currently employed at DeepLife, located in 75013 Paris, France. None of the other authors declare any conflicts of interest.

Figures

Fig 1
Fig 1. Hierarchical clustering of DEGs illustrates the distinction between samples obtained from HIV+FSWs and HIVFSWs.
(A) Heatmap displaying all 320 DEGs (FDR-adjusted P < 0.05) identified in HIV+FSWs (n = 14) compared to HIVFSWs (n = 47). Each sample is represented by a vertical column, and each gene by a horizontal row. Gene expression values are standardized (z-score) to a mean of 0 and a standard deviation of 1. Blue indicates below-average expression and red indicates above-average expression. Samples from HIV+FSWs are gray and those from HIVFSWs are orange. The horizontal bars below the groups represent age and bacterial vaginosis (BV) diagnosis, ranging from normal (0) to intermediate (1) to BV (2), as defined by the Nugent score. (B) Volcano plot illustrating all genes in the dataset, with log2FC on the x-axis and -log10 (P-value) on the y-axis; each gene is represented by a dot. DEGs upregulated in HIV+FSWs are red and DEGs downregulated in HIV+FSWs are blue. DEG: Differentially expressed gene. FDR: False discovery rate. FSW: Female sex worker. Log2FC: log2 fold-change.
Fig 2
Fig 2. FEA reveals altered pathways associated with immune regulation and epithelial barrier function in HIV+FSWs.
(A–D) Genes with an FDR-adjusted P < 0.1 identified in HIV+FSWs (n = 14) compared to HIVFSWs (n = 47) were subjected to molecular pathway enrichment analysis using the following databases: (A) GO slim, demonstrating major pathways containing at least five distinct enriched pathways, (B) GO, (C) KEGG, and (D) MSigDB. (E) and (F) Transcription factors upregulated and downregulated in HIV+FSWs compared to HIVFSWs were identified from DEGs using the (E) TRRUST and (F) ARCHS4 databases. The most significantly upregulated (red) and downregulated (blue) pathways and transcription factors identified were sorted by -log10 P-value and displayed on the x-axis. The dotted vertical line represents a nominal P = 0.01. FDR: False discovery rate. FSW: female sex worker. Log2FC: log2 fold-change.
Fig 3
Fig 3. Plasma viral load positively correlated with genes involved in T cell signaling and IFN response.
Correlation analysis of plasma viral load and identified upregulated genes within HIV+FSWs involved in T cell activity and IFN signaling. (A) General T cells related genes CD3E, CD4 and CCR5. (B) CD8+ T cell related genes CD8A EOMES, GZMH, PRF1, KLRD1 and TIGIT. (C) IFN related genes IFNG, CIITA and ZBP1. The graphs illustrate Spearman correlations between gene count and plasma viral load (counts/ml) with a linear regression line, the 95% confidence interval, and all individual data points. The log10 plasma viral load is shown on the y axis and the normalized gene count is shown on the x axis. P<0.05 was considered significant. IFN; Interferon.
Fig 4
Fig 4. Workflow for bioimaging analysis of the ectocervical epithelial compartment.
Schematic representation of the bioimage analysis developed to evaluate ectocervical epithelial integrity. The epithelial compartment is outlined in red in all images. (A–K) Bioimage analysis of individual epithelial junction proteins (EJPs). (A) Fluorescent image of the ectocervical mucosa stained for claudin-1. (B) The outlined epithelial compartment used for subsequent analyses. (C) Curve-linear enhancement to facilitate segmentation. (D) Identification of the net-like protein structure. (E) Size exclusion to remove artifacts. (F) Division of the epithelial compartment into superficial (gray), intermediate (IM; containing the junction protein) (light beige), and basal layer (dark gray) by expanding the identified net-like structure of the protein strands. (G) Classification of the identified net-like structure as intact (green) or fragmented (white) by size exclusion. (H) Flooding watershed transformation from the cervicovaginal border towards the basal membrane to generate a theoretical protected (cyan) and accessible region (white) for an incoming virus based on the intact net. (I) Further division of the IM layer into intact (beige) and fragmented (light beige) regions based on the intact net-like structure. (J) Bioimaging analysis of the combined EJPs claudin-1 (green), DSG1 (red), and ZO1 (magenta). (K) Merging of the identified net-like structures of claudin-1, DSG1, and ZO1 to enable a combined analysis, with the analysis pipeline described in (A–I) applied to the combined layer. (L) Zoom in of the highlighted areas in J-K to illustrate the size of a pixel (white dot) as indicated by the red arrow. Brightness and contrast were enhanced in the original images in (A) and (J) for visualization purposes. DSG1: desmoglein-1. ZO1: zonula occludens 1. IM: intermediate layer.
Fig 5
Fig 5. Expression of claudin-1 and DSG1 is reduced in HIV+FSWs.
Representative images of E-cadherin (blue), claudin-1 (green), DSG1 (red), and ZO1 (magenta) in ectocervical tissue from (A) HIV+FSW (n = 12) and (B) HIV-FSW (n = 47). Brightness and contrast were enhanced in all images for visualization purposes. Scale bars represent 100 μm, and the epithelium is outlined in white. (C) Boxplots illustrating the MFI within the IM layer of E-cadherin, claudin-1, DSG1, and ZO1. Boxes represent the median and IQR, while whiskers indicate the full range. HIV+FSWs using DMPA have been highlighted in red. Statistical analysis was conducted using the Mann–Whitney U test, with significance set at P<0.05. **, P<0.01. FSW: female sex worker. DSG1: desmoglein-1. ZO1: zonula occludens 1. MFI: mean fluorescence intensity. IM: intermediate layer. IQR: interquartile range. DMPA: Depot medroxyprogesterone acetate.
Fig 6
Fig 6. The ectocervical epithelium is disrupted in HIV+FSWs.
(A) Left: Representative image showing the net-like structure formed by the segmented junction protein claudin-1, with intact net in green and fragmented net in white. Right: Boxplots indicating the percentage of the total net considered intact for combined analysis of claudin-1, DSG1, and ZO1, as well as for individual analysis of E-cadherin, claudin-1, DSG1, and ZO1. Samples from HIV+FSWs (n = 12) are gray, and samples from HIVFSWs (combined analysis, claudin-1, DSG1, and ZO1; n = 46, E-cadherin; n = 47) are orange. (B) Left: Representative image demonstrating the theoretical accessible region (white) and protected region (blue) based on the combined analysis. Right: Boxplots showing the theoretical epithelial accessibility of the combined analysis and E-cadherin. (C) Left: Representative image illustrating the fragmented (light beige) and intact (dark beige) regions within the IM layer based on claudin-1 staining. The superficial and basal layers are outlined in gray and dark gray, respectively. Right: Boxplots indicating the epithelial coverage of the identified fragmented and intact regions for the respective junction proteins. Boxes represent the median and IQR, while whiskers indicate the full range. HIV+FSWs using DMPA have been highlighted in red. Statistical analysis was conducted using the Mann–Whitney U test, with significance set at P<0.05. *, P<0.05; **, P<0.01; ***, P<0.001; ****, P<0.0001. FSW: female sex worker. DSG1: desmoglein 1. ZO1: zonula occludens 1. IM: intermediate layer. IQR: interquartile range. DMPA: Depot medroxyprogesterone acetate.
Fig 7
Fig 7. The ectocervical superficial layer is thinned in HIV+FSWs.
Boxplots demonstrate the height of the three epithelial layers: superficial (S), intermediate (IM), and basal (B) for (A) the combined analysis, (B) E-cadherin, (C) claudin-1, (D) DSG1, and (E) ZO1 in HIV+FSWs and HIVFSWs. Samples from HIV+FSWs are gray, and samples from HIVFSWs are orange. Boxes represent the median and IQR, while whiskers indicate the full range. HIV+FSWs using DMPA have been highlighted in red. Statistical analysis was conducted using the Mann–Whitney U test, with significance set at P<0.05. *, P<0.05; **, P<0.01. FSW: female sex worker. DSG1: desmoglein 1. ZO1: zonula occludens 1. IQR: interquartile range. DMPA: Depot medroxyprogesterone acetate.

Similar articles

Cited by

  • HIV-associated penile anaerobes disrupt epithelial barrier integrity.
    Buchanan LB, Shao Z, Galiwango RM, Constable S, Zuanazzi D, Biribawa VM, Ssemunywa HR, Namuniina A, Okech B, Edfeldt G, Tjernlund A, Tobian AAR, Park DE, Pham T, Aziz M, Salazar JE, Nelson S, Liu CM, Kaul R, Prodger JL. Buchanan LB, et al. PLoS Pathog. 2025 Apr 17;21(4):e1013094. doi: 10.1371/journal.ppat.1013094. eCollection 2025 Apr. PLoS Pathog. 2025. PMID: 40245064 Free PMC article.

References

    1. Kamat A, Misra V, Cassol E, Ancuta P, Yan Z, Li C, et al.. A Plasma Biomarker Signature of Immune Activation in HIV Patients on Antiretroviral Therapy. PLoS One. 2012. Feb 17;7(2). Available from: /pmc/articles/PMC3281899/. doi: 10.1371/journal.pone.0030881 - DOI - PMC - PubMed
    1. So-Armah KA, Tate JP, Chang CCH, Butt AA, Gerschenson M, Gibert CL, et al.. Do Biomarkers of Inflammation, Monocyte Activation, and Altered Coagulation Explain Excess Mortality Between HIV Infected and Uninfected People? J Acquir Immune Defic Syndr. 2016. Jun 6;72(2):206. Available from: /pmc/articles/PMC4867134/. doi: 10.1097/QAI.0000000000000954 - DOI - PMC - PubMed
    1. Brenchley JM, Price DA, Schacker TW, Asher TE, Silvestri G, Rao S, et al.. Microbial translocation is a cause of systemic immune activation in chronic HIV infection. Nature Medicine 2006 12:12. 2006. Nov 19;12(12):1365–71. Available from: https://www.nature.com/articles/nm1511. doi: 10.1038/nm1511 - DOI - PubMed
    1. Giorgi J V., Hultin LE, McKeating JA, Johnson TD, Owens B, Jacobson LP, et al.. Shorter Survival in Advanced Human Immunodeficiency Virus Type 1 Infection Is More Closely Associated with T Lymphocyte Activation than with Plasma Virus Burden or Virus Chemokine Coreceptor Usage. J Infect Dis. 1999. Apr 1;179(4):859–70. Available from: doi: 10.1086/314660 - DOI - PubMed
    1. Nasi M, De Biasi S, Gibellini L, Bianchini E, Pecorini S, Bacca V, et al.. Ageing and inflammation in patients with HIV infection. Clin Exp Immunol. 2017. Jan 1;187(1):44. Available from: /pmc/articles/PMC5167025/. doi: 10.1111/cei.12814 - DOI - PMC - PubMed