Clinical Trial
. 2024 Nov 19:12:e64806.
doi: 10.2196/64806.

Predicting Pain Response to a Remote Musculoskeletal Care Program for Low Back Pain Management: Development of a Prediction Tool

Affiliations
Clinical Trial

Predicting Pain Response to a Remote Musculoskeletal Care Program for Low Back Pain Management: Development of a Prediction Tool

Anabela C Areias et al. JMIR Med Inform. .

Abstract

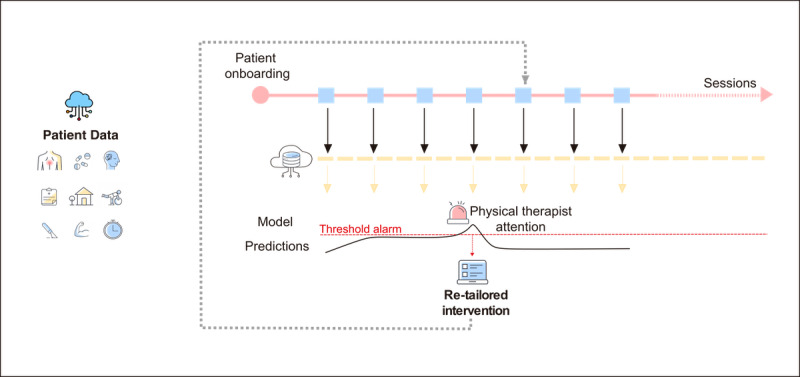
Background: Low back pain (LBP) presents with diverse manifestations, necessitating personalized treatment approaches that recognize various phenotypes within the same diagnosis, which could be achieved through precision medicine. Although prediction strategies have been explored, including those employing artificial intelligence (AI), they still lack scalability and real-time capabilities. Digital care programs (DCPs) facilitate seamless data collection through the Internet of Things and cloud storage, creating an ideal environment for developing and implementing an AI predictive tool to assist clinicians in dynamically optimizing treatment.

Objective: This study aims to develop an AI tool that continuously assists physical therapists in predicting an individual's potential for achieving clinically significant pain relief by the end of the program. A secondary aim was to identify predictors of pain nonresponse to guide treatment adjustments.

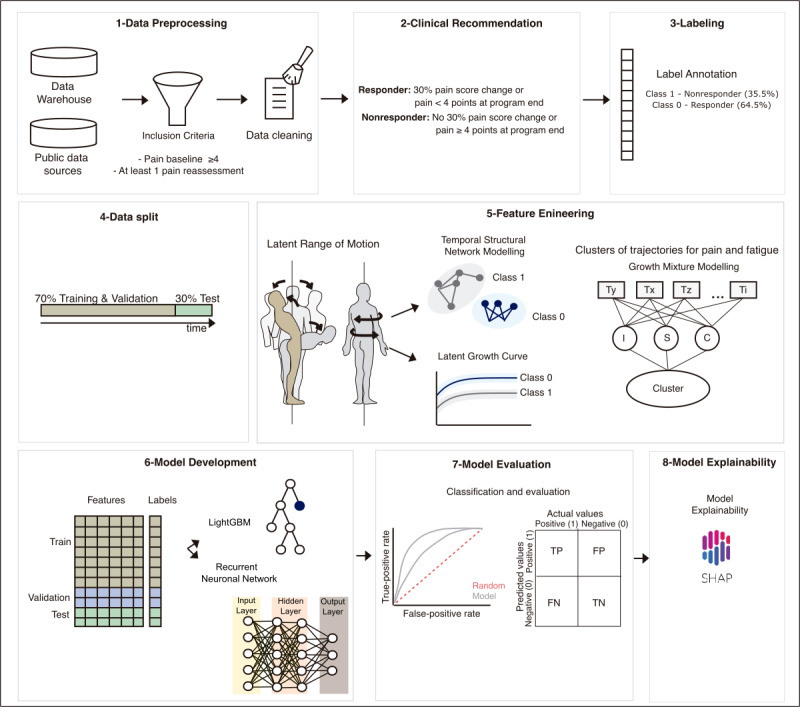
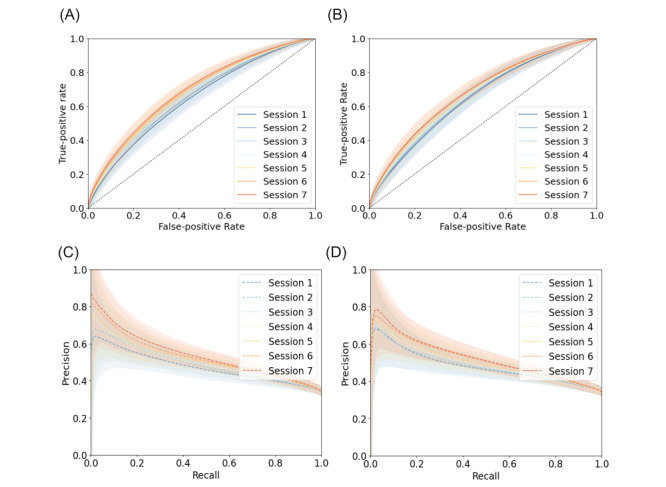
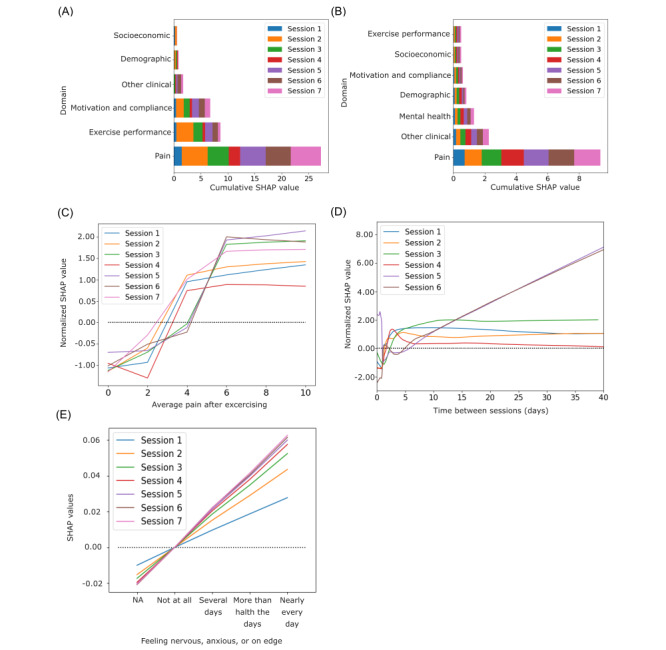
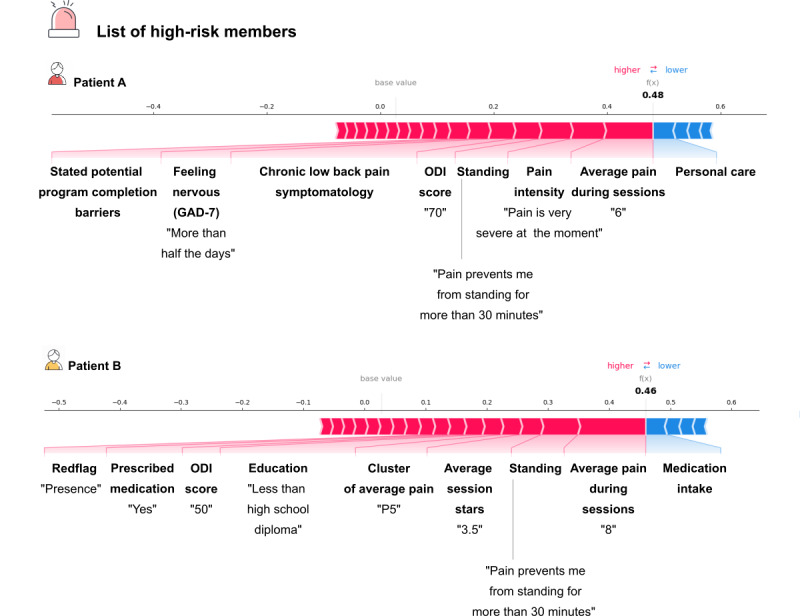
Methods: Data collected actively (eg, demographic and clinical information) and passively in real-time (eg, range of motion, exercise performance, and socioeconomic data from public data sources) from 6125 patients enrolled in a remote digital musculoskeletal intervention program were stored in the cloud. Two machine learning techniques, recurrent neural networks (RNNs) and light gradient boosting machine (LightGBM), continuously analyzed session updates up to session 7 to predict the likelihood of achieving significant pain relief at the program end. Model performance was assessed using the area under the receiver operating characteristic curve (ROC-AUC), precision-recall curves, specificity, and sensitivity. Model explainability was assessed using SHapley Additive exPlanations values.

Results: At each session, the model provided a prediction about the potential of being a pain responder, with performance improving over time (P<.001). By session 7, the RNN achieved an ROC-AUC of 0.70 (95% CI 0.65-0.71), and the LightGBM achieved an ROC-AUC of 0.71 (95% CI 0.67-0.72). Both models demonstrated high specificity in scenarios prioritizing high precision. The key predictive features were pain-associated domains, exercise performance, motivation, and compliance, informing continuous treatment adjustments to maximize response rates.

Conclusions: This study underscores the potential of an AI predictive tool within a DCP to enhance the management of LBP, supporting physical therapists in redirecting care pathways early and throughout the treatment course. This approach is particularly important for addressing the heterogeneous phenotypes observed in LBP.

Trial registration: ClinicalTrials.gov NCT04092946; https://clinicaltrials.gov/ct2/show/NCT04092946 and NCT05417685; https://clinicaltrials.gov/ct2/show/NCT05417685.

Keywords: artificial intelligence; clinical decision support; machine learning; personalized medicine; predictive modeling; rehabilitation; telerehabilitation.


Conflict of interest statement

Conflicts of Interest: The authors declare the following competing financial interests: ACA, RGM, MM, DJ, CM, VY, FDC, and FC are employees of Sword Health Inc, the sponsor of this study. FDC, VY, and VB also hold equity in Sword Health Inc. SPC is an independent scientific and clinical consultant who received advisory honoraria from Sword Health.

Figures

Figure 1
Figure 1
Machine Learning (ML) tool development within the digital care program. All patient data collected both passively and actively regarding demographic and clinical characteristics, range of motion, and session usability, as well as collected from public sources (eg, social deprivation index) are continuously stored from onboarding to the program end, enabling the creation of a data repository within the physical therapists (PTs) cloud portal. At the end of each session, data are processed through an ML model to predict an individual’s potential to achieve clinically significant pain relief at the program end. In the case of the high probability of an unfavorable outcome, an alarm is set in the PT portal for further examination and re-tailoring of the intervention.
Figure 2
Figure 2
Model development pipeline. Data from patients with low back pain (LBP) who underwent the digital intervention were collected from the data warehouse within a specific time frame. Inclusion criteria: average pain level equal to or greater than 4 on the Numerical Pain Rating Scale (NPRS) at baseline considering a 7-day recall period; and at least one pain reassessment during the intervention. Patient data were preprocessed for the tool. Patients who did not experience a pain (NPRS) reduction of at least 30% or reported pain level higher or equal to 4 at the program end were categorized as nonresponders (labeled as “1” in the data set). Considering the overarching intervention goal of promoting improvement in pain levels, a flag was triggered when patients were likely to be nonresponders to assist PTs’ clinical judgment; a split of 70/30 was performed on the data set followed by feature engineering: range of motion (ROM) was computed through temporal structural network modeling and latent growth curves, whereas pain and fatigue experienced during exercises (reported at the end of each exercise session), exercise accuracy, and time between sessions were computed using growth mixture modeling to depict changes over time. Model development consisted of a tree-based binary classifier and a recurrent neural network that were optimized using the receiver operating characteristic (ROC)-area under the curve (AUC) as the target metric. Precision-recall curves were used as evaluation metrics, and model explainability was assessed using SHAP (Shapley Additive Explanations) values. FN: false negative; FP: false positive; LightGBM: light gradient boosting machine; TN: true negative; TP: true positive.
Figure 3
Figure 3
Model performance on the test data set. Test receiver operating characteristic curve (ROC) for both (A) light gradient boosting machine (LightGBM) and (B) recurrent neural network (RNN) across the 7 sessions. True positive rate (true positives over true positives and false negatives); false positive rate (false positives over false positives and true negatives); dashed line denotes an area under the curve (AUC) of 0.5 corresponding to a random predictor; precision-recall curve for (C) LightGBM and (D) RNN models across the 7 sessions. Precision denotes true positives over true positives and false positives; recall denotes true positives over true positives and false negatives; shaded areas denote the 95% CIs.
Figure 4
Figure 4
Model explainability. Cumulative Shapley Additive Explanations (SHAP) values per domain considering the top 20 features at each session for both (A) light gradient boosting machine (LightGBM) and (B) recurrent neural network (RNN). SHAP values depicting the relationship between the outcome (ie, pain response) and the feature of interest: (C) average pain felt during exercising, (D) time between sessions (days), and (E) feeling nervous, anxious, or on edge (7-item General Anxiety Disorder Scale [GAD-7] scale). As LightGBM models differ in the number of features across time, and because we are interested in qualitative comparisons, SHAP values were normalized at each session by dividing by the SD of SHAP values.
Figure 5
Figure 5
Example of the integration of the model in the physical therapist portal. Example of model explainability for 2 patients, A and B, classified as high-risk nonresponders (recurrent neural network [RNN] precision 70%) at session 4. In the physical therapist portal, each patient's health record includes the prediction of the tool along with the variables that sustained the model's classification, providing insights into the specific factors affecting the patient's prognosis. The most influential factors contributing to a nonresponder prediction are highlighted in red, with factors positioned toward higher "base values" (ie, to the right) indicating a stronger impact. For example in the case of patient A, the pain felt during exercise and the baseline pain are the most influential for the model output. After analyzing the case, the physical therapist reevaluates the patient's program and the potential need for further support. Those adjustments will be subsequently fed into the tool reinforcing the dynamic optimization close loop. GAD-7: 7-item General Anxiety Disorder Scale; ODI: Oswestry Disability Index.

Similar articles

References

    1. Cieza A, Causey K, Kamenov K, Hanson SW, Chatterji S, Vos T. Global estimates of the need for rehabilitation based on the Global Burden of Disease study 2019: a systematic analysis for the Global Burden of Disease Study 2019. Lancet. 2021 Dec 19;396(10267):2006–2017. doi: 10.1016/S0140-6736(20)32340-0. https://linkinghub.elsevier.com/retrieve/pii/S0140-6736(20)32340-0 S0140-6736(20)32340-0 - DOI - PMC - PubMed
    1. Cholewicki J, Breen A, Popovich JM, Reeves NP, Sahrmann SA, van Dillen LR, Vleeming A, Hodges PW. Can biomechanics research lead to more effective treatment of low back pain? A point-counterpoint debate. J Orthop Sports Phys Ther. 2019 Jun;49(6):425–436. doi: 10.2519/jospt.2019.8825. https://europepmc.org/abstract/MED/31092123 - DOI - PMC - PubMed
    1. Cholewicki J, Popovich JM, Aminpour P, Gray SA, Lee AS, Hodges PW. Development of a collaborative model of low back pain: report from the 2017 NASS consensus meeting. Spine J. 2019 Jun;19(6):1029–1040. doi: 10.1016/j.spinee.2018.11.014.S1529-9430(18)31263-4 - DOI - PubMed
    1. Lin I, Wiles L, Waller R, Goucke R, Nagree Y, Gibberd M, Straker L, Maher CG, O'Sullivan PPB. What does best practice care for musculoskeletal pain look like? Eleven consistent recommendations from high-quality clinical practice guidelines: systematic review. Br J Sports Med. 2020 Jan;54(2):79–86. doi: 10.1136/bjsports-2018-099878.bjsports-2018-099878 - DOI - PubMed
    1. Booth J, Moseley GL, Schiltenwolf M, Cashin A, Davies M, Hübscher Markus. Exercise for chronic musculoskeletal pain: a biopsychosocial approach. Musculoskeletal Care. 2017 Dec;15(4):413–421. doi: 10.1002/msc.1191. - DOI - PubMed

Associated data

LinkOut - more resources