. 2025 Apr 8;9(7):1508-1521.
doi: 10.1182/bloodadvances.2024013986.

Changes in gut microbiota predict neutropenia after induction treatment in childhood acute lymphoblastic leukemia

Affiliations

Changes in gut microbiota predict neutropenia after induction treatment in childhood acute lymphoblastic leukemia

Maria Ebbesen Sørum et al. Blood Adv. .

Abstract

Delayed neutrophil recovery during acute lymphoblastic leukemia (ALL) treatment increases the risk of infection and causes delay in chemotherapy. Emerging evidence implicates gut microbiota in neutrophil reconstitution after chemotherapy. We explored the interplay between the gut microbiota and neutrophil dynamics, including neutrophil chemoattractants, in 51 children with newly diagnosed ALL. Daily absolute neutrophil count (ANC), weekly plasma chemokines (CXCL1 and CXCL8), granulocyte colony-stimulating factor (G-CSF), and fecal samples were monitored until day 29 during ALL induction treatment. Fecal sequencing using 16S ribosomal RNA revealed an overall significant reduction in bacterial diversity and Enterococcus overgrowth throughout the induction treatment. Prolonged neutropenia (ANC <0.5 × 10⁹ cells per L at day 36) and elevated chemokine levels were associated with a decreased abundance of genera from the Ruminococcaceae and Lachnospiraceae families, decreased Veillonella genus, and Enterococcus overgrowth from diagnosis and throughout induction treatment. G-CSF was upregulated in response to neutropenia but was unrelated to microbiota changes. Overall, this study revealed that a diminished abundance of specific intestinal commensals and Enterococcus overgrowth is associated with delayed neutrophil reconstitution and increased chemokine signaling, indicating that disruption of the microbiota may contribute to prolonged neutropenia. These findings lay the groundwork for future investigations into the mechanisms underlying these associations and their clinical implications for developing gut-sparring strategies to minimize the impact of gut dysbiosis on immune recovery.


Conflict of interest statement

Conflict-of-interest disclosure: The authors declare no competing financial interests.

Figures

None
Graphical abstract
Figure 1.
Figure 1.
Neutrophils, neutrophil trafficking markers, and microbiome diversity during induction treatment. ANC (A), CXCL1 plasma levels (B), CXCL8 plasma levels (C), G-CSF plasma levels (D), and gut microbiota α-diversity (E) in all patients. (F-J) grouped by neutropenia status (ANC <0.5 × 109 cells per L) at day 36. Patients with neutropenia on day 36 had significantly higher levels of CXCL1, CXCL8, and G-CSF throughout the induction period (no interaction with the time point) and lower α-diversity on day 1. Boxes show the median levels with 25th and 75th percentiles. Asterisks represent differences between day 8 levels (B-D), day 1 levels (E), and comparisons between groups (G-J). P values correspond to generalized linear mixed models without interaction between time points for panels G-I. ∗P < .05; ∗∗P < .01; ∗∗∗P < .001.
Figure 2.
Figure 2.
Gut microbiota α-diversity on day 15 correlates inversely with chemokine plasma levels. Shannon diversity index on day 15 correlated with CXCL1 and CXCL8 levels on days 15 and 22, respectively. P values correspond to Spearman rank-order correlation analysis.
Figure 3.
Figure 3.
Overall microbial composition (β-diversity) associates with prolonged neutropenia and neutrophil chemokines. PCoA plots of interindividual dissimilarities in microbial composition (β-diversity) based on Bray-Curtis dissimilarities. (A) Microbial β-diversity assessed in relation to the treatment day. (B) β-diversity on day 1 in patients compared with healthy siblings. (C) β-diversity on day 29 was assessed in relation to neutropenia status on day 36. (D-F) β-diversity at day 29 assessed in relation to same-day levels of CXCL1 (D), CXCL8 (E), and G-CSF (F) all dichotomized by the median. P values correspond to permutational multivariate analysis of variance tests. PC, principal component.
Figure 4.
Figure 4.
Relative abundances of specific genera during induction treatment associate with prolonged neutropenia. The 12 genera with a prevalence >25% and significant difference (FDR-corrected P < .05) in relative abundance between groups are shown, red: neutropenia (ANC <0.5 × 10⁹ cells per L) at day 36; blue: recovered from neutropenia at day 36. Dots and lines represent the mean value and shaded color bands represent the 95% CI of the group. P values correspond to generalized linear mixed models and ∗ represents FDR-corrected P values.
Figure 5.
Figure 5.
Relative abundances of specific genera at time of ALL diagnosis deviate from healthy siblings and determine risk of neutropenia after induction treatment. (A) Bacterial genera with a prevalence >25% and a significant difference (P < .05) in relative abundance between patient samples on day 1 and healthy siblings. (B) sPLS regression for the relative abundance of bacterial genera (prevalence >25%) on day 1 and prolonged neutropenia (n = 12/32). Bacteria are sorted from top to bottom based on their sPLS model loading (lower to higher). The brown and red bars indicate negative and positive loadings, respectively. The genera marked with darker brown and ∗∗ are shown in panel C. (C) The median (range) of AUC from 5-time repeated 10-fold cross-validation of the sPLS model. Box plots represent class predictions for the median cross-validation model. Boxes show the median level with the 25th and 75th percentiles and whiskers represent the range. (D) Relative abundance on day 1 of the 10 genera that turned out with significant difference in relative abundance between the groups (P < .05). Boxes show the median level with the 25th and 75th percentiles; whiskers and outliers represent the 5th and 95th percentiles and range, respectively. P values (A, D) correspond to Wilcoxon rank-sum tests without correction for multiple tests. ∗ represents FDR-corrected P values. CV, cross-validation.
Figure 6.
Figure 6.
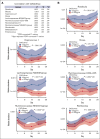
Relative abundances of specific genera associate with markers of neutrophil trafficking. (A) List of the 11 bacterial genera with prevalence >25% and significant association (FDR-corrected P < .05) throughout the induction period with maximum level of the chemokine CXCL8. The relative abundance of Enterococcus was positively associated with CXCL8, whereas the relative abundance of all other genera was inversely associated with CXCL8. (B) Bacterial genera with a prevalence of >25% and significant association (FDR-corrected P < .05) during induction treatment with maximum levels of CXCL8 and with groups: patients dichotomized according to their individual maximum level of CXCL8. Dots represent mean values and shaded color bands represent the 95% CI. P values correspond to generalized linear mixed models and ∗ represents FDR-corrected P values.

Similar articles

Cited by

References

    1. Schmiegelow K, Forestier E, Hellebostad M, et al. Long-term results of NOPHO ALL-92 and ALL-2000 studies of childhood acute lymphoblastic leukemia. Leukemia. 2010;24(2):345–354. - PubMed
    1. Afzal S, Ethier MC, Dupuis LL, et al. Risk factors for infection-related outcomes during induction therapy for childhood acute lymphoblastic leukemia. Pediatr Infect Dis J. 2009;28(12):1064–1068. - PubMed
    1. Inaba H, Pei D, Wolf J, et al. Infection-related complications during treatment for childhood acute lymphoblastic leukemia. Ann Oncol. 2017;28(2):386–392. - PMC - PubMed
    1. Kolaczkowska E, Kubes P. Neutrophil recruitment and function in health and inflammation. Nat Rev Immunol. 2013;13(3):159–175. - PubMed
    1. Balmer ML, Schürch CM, Saito Y, et al. Microbiota-derived compounds drive steady-state granulopoiesis via MyD88/TICAM signaling. J Immunol. 2014;193(10):5273–5283. - PubMed

MeSH terms

Substances