. 2025 Jan 7;37(1):154-168.e7.
doi: 10.1016/j.cmet.2024.10.007. Epub 2024 Nov 18.

Human genetics identify convergent signals in mitochondrial LACTB-mediated lipid metabolism in cardiovascular-kidney-metabolic syndrome

Affiliations

Human genetics identify convergent signals in mitochondrial LACTB-mediated lipid metabolism in cardiovascular-kidney-metabolic syndrome

Shen Li et al. Cell Metab. .

Abstract

The understanding of cardiovascular-kidney-metabolic syndrome remains difficult despite recently performed large scale genome-wide association studies. Here, we identified beta-lactamase (LACTB), a novel gene whose expression is targeted by genetic variations causing kidney dysfunction and hyperlipidemia. Mice with LACTB deletion developed impaired glucose tolerance, elevated lipid levels, and increased sensitivity to kidney disease, while mice with tubule-specific overexpression of LACTB were protected from kidney injury. We show that LACTB is a novel mitochondrial protease cleaving and activating phospholipase A2 group VI (PLA2G6), a kidney-metabolic risk gene itself. Genetic deletion of PLA2G6 in tubule-specific LACTB-overexpressing mice abolished the protective function of LACTB. Via mouse and human lipidomic studies, we show that LACTB and downstream PLA2G6 convert oxidized phosphatidylethanolamine to lyso-phosphatidylethanolamine and thereby regulate mitochondrial function and ferroptosis. In summary, we identify a novel gene and a core targetable pathway for kidney-metabolic disorders.

Keywords: GWAS; cardiovascular-kidney-metabolic syndrome; ferroptosis; genetics; kidney disease; mitochondria; phospholipase; phospholipid; serine protease.


Conflict of interest statement

Declaration of interests K. Susztak declares the following interests: research support from AstraZeneca, Bayer, Boehringer Ingelheim, Calico, Genentech, Gilead, GSK, Jnana, Lilly, Maze, Merck, Novartis, Novo Nordisk, Regeneron, Variant Bio, and Ventus; advisory board membership with Jnana Therapeutics and Pfizer; consultancy for AstraZeneca, Bayer, GSK, Jnana Therapeutics, Maze, Novo Nordisk, Pfizer, and Ventus; ownership of patents related to Jag1- and Notch-based targeting of chronic kidney disease; editorial board membership on Cell Metabolism, eBioMedicine, Journal of the American Society of Nephrology, Journal of Clinical Investigation, Kidney International, and Med. J.A.B. declares the following interests: research support from Pfizer, Elysium Health, and Metro International Biotech; consulting fees from Pfizer, Elysium Health, Cytokinetics, and Altimmune. D.J.R. declares the following interests: consultant/scientific advisory board for Alnylam, Novartis, and Verve. M.L.M. declares the following interests: shareholder and scientific adviser to Zenagem, LLC.

Figures
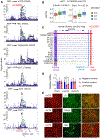
Figure 1.
Figure 1.. GWAS and eQTL analysis identifies an association between LACTB, kidney function, and metabolic disorder
(A) LocusZoom plots of eGFR GWAS, HDL GWAS, triglyceride GWAS, and kidney (tubule and glomerulus [glom]) eQTL and mQTL. Each dot represents 1 SNP. The dots are colored according to their relationship to the index SNP (rs7162825). The red dots indicate high correlation (r2 > 0.8) (linkage disequilibrium [LD]) with the index SNP. The left y axis indicates log10 (p value). (B) Boxplot: the x axis represents the SNP (rs7162825 genotype C/C C/T, T/T), and the y axis shows relative LACTB expression in human kidney sample. (C) Single-cell open chromatin (ATAC-seq) landscape of the human kidney at the LACTB locus. From top to bottom: gene browser view of the eGFR GWAS SNPs; genome browser view of chromatin accessibility for proximal tubules (PTs), loop of Henle (LOH), distal convoluted tubule (DCT), collecting duct principal cell types (PC), collecting duct intercalated cells (ICs), podocytes (Podo), endothelial cells (Endo), immune cells (Immune), lymphocytes (Lymph), whole kidney H3K4me3 and H3K27ac histone chromatin immunoprecipitation sequencing (ChIP-seq). The highlighted regions in red, blue, and purple indicate genomic regions deleted in the CRISPR-Cas9 experiments (D). (D) CRISPR-Cas9-assisted genomic deletion in HEK293 cells. Bar graphs show relative LACTB and genes near LACTB expression following guide RNA transfection for negative control, regions highlighted in (C), and positive control. (E) LACTB expression in human kidneys. Representative immunofluorescence staining of LACTB (red), and tubule-specific markers (green) in healthy adult human kidneys. Markers for proximal tubule, LTL; distal tubule, CDH16; and collecting tubule, DBA. Scale bar, 50 μm. For (D) N = 3/group. Data are shown as means ± SD. *p < 0.05. p values were calculated by one-way ANOVA followed by a Tukey post hoc test for multigroup comparison. See also Figure S1.
Figure 2.
Figure 2.. LACTB regulates lipid metabolism and kidney function
(A) Representative images of H&E-stained kidney sections of WT and LACTB-KO mice. Scale bar: 50 μm. (B and C) (B) Glucose tolerance test and (C) serum triglyceride of WT and LACTB-KO mice. (D–F) (D) Fasting glucose, (E) serum triglyceride, and (F) HDL of WT and LACTB-KO mice following 3-month HF diet. (G) BUN levels in cisplatin model. Mice were injected with cisplatin (20 mg/kg) or saline intraperitoneal (i.p.) kidneys and serum were collected 3 days after injection. (H) Relative mRNA abundance of Havcr1 in WT and LACTB mutant mice kidneys. (I) Representative images of H&E-stained kidney sections in cisplatin model. Scale bar: 50 μm. (J) BUN levels in cisplatin model. Mice with tubule-specific LACTB overexpression (LACTB-OE) was generated by crossing the Pax8rtTA mice with TRE-LACTB mice. Mice were placed on Dox chow for 4 weeks, then injected with cisplatin (25 mg/kg) or saline i.p. TRE-LACTB mice were used as control. (K) Relative mRNA abundance of Havcr1 in kidney tissue samples. (L) Representative images of H&E-stained kidney sections in cisplatin model. Scale bar: 50 μm. All experiment, N = 5–7/group. Data are shown as mean ± SD. *p < 0.05; **p < 0.01; ***p < 0.001. For (C–F, J, and K), p values were calculated by Student’s two-sided t test; for (G and H), one-way ANOVA followed by a Tukey post hoc test. For (B), KO-male vs. WT-male, **p < 0.01; KO-female vs. WT-female, #p < 0.05, ##p < 0.01, ###p < 0.001. p values were calculated by one-way ANOVA followed by a Tukey post hoc test. HZ, heterozygote; HF, high fat. See also Figure S2.
Figure 3.
Figure 3.. LACTB is a protease cleaving and activating PLA2G6 and regulating mitochondrial function
(A) Immunofluorescence staining of LACTB in primary kidney tubular cell. Cells were stained with a mitochondrial marker (COX4, green), LACTB (red), and DAPI (blue). Scale bar, 5 μm. (B) Representative transmission electron microscopy images of mitochondrial shape in LACTB-KO mice kidney. (C) The mitochondrial respiration of each component (CI–CIV) of primary tubular cell was measured by Oroboros. (D) Representative image of MitoSOX staining in primary tubular cell from different LACTB mutant mice. Scale bars, 5 μm. (E) Gel-based competitive ABPP analysis with the fluorophosphonate (FP)-rhodamine probe for serine proteases. HEK293 cells transfected with/without LACTB in the presence and absence of Z-AAD-CMK were used. (F) Mitochondrial respiration of primary tubular cell transfected with LACTB or LACTB-MutS164I (the catalytic domain) as analyzed by Seahorse analyzer. (G) LACTB-APEX2-mass spectroscopy analysis. Proteins with a ratio of >2 (measured by label-free quantification) in the experimental conditions compared with a no-labeling control (no H2O2) are sorted by spectral counts (mean of n = 3 replicates). Proteins are ranked from top to bottom based on counts value. (H) CoIP analysis. Anti-hemagglutinin (HA) antibody immunoprecipitations from HA-PLA2G6 transfected HKC8 cell. (I) Schematics of LACTB and PLA2G6 constructs. (J) Cleavage of full-length PLA2G6 in HKC8 cell transfected with LACTB or LACTB-MutS164I. Cisplatin treatment was used as positive control. LACTB-MutS164I was used as negative control. (K) Mitochondrial respiration (Seahorse analyzer) of HKC8 cell treated with small interfering RNA (siRNA)-LACTB (LACTB-KD) and/or full-length (FL) or cleaved (CL) PLA2G6, cell treated with siRNA-control and empty vector as control. For (C), N = 3/group; for (F and K), N = 6–8/group. Data are shown as mean ± SD. *p < 0.05; **p < 0.01; ***p < 0.001. For (C), p values were calculated by Student’s two-sided t test; for (F and K), one-way ANOVA followed by a Tukey post hoc test. See also Figure S3 and Table S1.
Figure 4.
Figure 4.. Kidney function and lipid GWAS and ASE prioritize PLA2G6 as a kidney and metabolic risk gene
(A) LocusZoom plots of eGFR GWAS, HDL GWAS, triglyceride GWAS, and allele-specific expression (ASE) in kidney. Each dot represents 1 SNP. The dots are colored according to their relationship to the index SNP (rs5756940). The red dots indicate high correlation (r2 > 0.8) (LD) with the index SNP. The left y axis indicates log10 (p value). (B) Genotype rs5756940 (genotype C/C C/T, T/T) effect on relative PLA2G6 expression in human kidney sample. (C) PLA2G6 protein localization in human kidneys. Representative immunofluorescence staining of PLA2G6 (red), and tubule-specific markers (green) in healthy adult human kidneys. Markers for proximal tubule, LTL; distal tubule, CDH16; and collecting tubule, DBA. Scale bar, 50 μm. (D) BUN levels in WT and PLA2G6-KO mice injected with cisplatin (20 mg/kg) or saline. (E) Relative mRNA abundance of Havcr1 in WT and PLA2G6-KO mice kidneys treated with cisplatin. (F) Representative image of H&E-stained kidney sections in WT and PLA2G6-KO mice. Scale bar: 50 μm. For (D and E), N = 5/group. Data are shown as mean ± SD. **p < 0.01; ***p < 0.001. p values were calculated by Student’s two-sided t test. See also Figure S4.
Figure 5.
Figure 5.. Consistent changes induced by LACTB and PLA2G6 in mitochondrial PE metabolism
(A) Metabolite and gene transcript analysis of 50 human kidney samples (control and CKD). (B) Correlation of kidney LACTB, PLA2G6 level, and LPE16:0 level. (C) Kidney mitochondria isolated from WT and LACTB-KO mice for lipidomics studies. (D) Metabolite set enrichment analysis using MetaboAnalyst of control and LACTB-KO mice. Horizontal bars represent pathway fold enrichment. Pathways are ranked from top to bottom based on enrichment statistical significance. (E and F) Metabolite set enrichment analysis of unbiased metabolomics of mitochondria isolated from (E) LACTB-OE and (F) LACTB-KO cells using MetaboAnalyst. The LACTB-OE group was WT cell transfected with empty vector or LACTB plasmid. (G and H) Metabolite set enrichment analysis of unbiased metabolomics of isolated mitochondria of tubule cells with (G) PLA2G6-OE and (H) PLA2G6-KD using MetaboAnalyst. Cell in the PLA2G6-OE group was transfected with empty vector or PLA2G6 plasmid. Cell in the PLA2G6-KD group was transduced with vector virus or PLA2G6 small guide RNA (sgRNA) virus. (I) The heatmap of LPE and oxPE of the following experimental groups. In rightmost group, tubule cells treated with siRNA-LACTB (LACTB-KD) and/or PLA2G6 were used, cells treated with siRNA-control and empty vector as control. (J) The simplified hydrolyzation pathway of PLA2G6. (K) Expression levels of PE-38:4;O2 and PE-40:4;O2 in different experimental groups. For (C), N = 5/group; for (E–H), N = 3/group; for (K), N = 3 or 5/group. Data are shown as mean ± SD. *p < 0.05; **p < 0.01; ***p < 0.001. For (B), p value was calculated using Pearson’s correlation; for (D–H), Fisher’s exact test; for (K), Student’s two-sided t test or one-way ANOVA followed by a Tukey post hoc test (the rightmost panel). See also Figure S5 and Table S2.
Figure 6.
Figure 6.. LACTB and PLA2G6 protect kidney tubular cells from ferroptosis
(A) Control, LACTB-OE, and LACTBOE-PLA2G6KO mice were injected with saline or cisplatin (25 mg/kg), BUN levels were shown. (B) Relative mRNA abundance of Havcr1 in experimental groups. (C) Representative image of H&E-stained kidney sections in LACTBOE ± PLA2G6 in cisplatin model. Scale bar: 50 μm. (D–F) Relative mRNA abundance of ferroptosis genes in cisplatin-injected (D) LACTB-KO mice, (E) PLA2G6-KO mice, and (F) LACTBOE ± PLA2G6 mice kidney. (G–I) The LDH level in (G) LACTB- or PLA2G6-deficient HKC-8 cells treated with low-dose RSL, (H) HKC-8 cells expressing LACTB, PLA2G6-FL, PLA2G6-CL or PLA2G6-KD cells treated with RSL, (I) LACTB-KO primary tubular cell treated with Fer-1. (J) BUN levels in LACTB-KO mice injected with cisplatin (20 mg/kg) and Fer-1 or sham. (K) Relative mRNA abundance of Havcr1 in LACTB-KO mice treated with Fer-1. (L) Representative image of H&E-stained kidney sections in LACTB-KO mice. Scale bar: 50 μm. (M) Transcript levels (RNA sequencing [RNA-seq]) of LACTB and PLA2G6 (y axis) correlate with the degree of kidney fibrosis (x axis) in 387 microdissected human kidney tubule samples. For (A, B, D–F, J, and K), N = 5/group; for (G–I), N = 3/group. Data are shown as mean ± SD. *p < 0.05; **p < 0.01; ***p < 0.001. For (A, B, and D–I), p values were calculated by one-way ANOVA followed by a Tukey post hoc test; for (J and K), Student’s two-sided t test; for (M), Pearson’s correlation. See also Figure S6.

References

    1. Park J, Shrestha R, Qiu C, Kondo A, Huang S, Werth M, Li M, Barasch J, and Suszták K (2018). Single-cell transcriptomics of the mouse kidney reveals potential cellular targets of kidney disease. Science 360, 758–763. 10.1126/science.aar2131. - DOI - PMC - PubMed
    1. Qiu C, Huang S, Park J, Park Y, Ko YA, Seasock MJ, Bryer JS, Xu XX, Song WC, Palmer M, et al. (2018). Renal compartment-specific genetic variation analyses identify new pathways in chronic kidney disease. Nat. Med 24, 1721–1731. 10.1038/s41591-018-0194-4. - DOI - PMC - PubMed
    1. Dhillon P, Park J, Hurtado Del Pozo C, Li L, Doke T, Huang S, Zhao J, Kang HM, Shrestra R, Balzer MS, et al. (2021). The Nuclear Receptor ESRRA Protects from Kidney Disease by Coupling Metabolism and Differentiation. Cell Metab. 33, 379–394.e8. 10.1016/j.cmet.2020.11.011. - DOI - PMC - PubMed
    1. Liu BC, Tang TT, Lv LL, and Lan HY (2018). Renal tubule injury: a driving force toward chronic kidney disease. Kidney Int. 93, 568–579. 10.1016/j.kint.2017.09.033. - DOI - PubMed
    1. Zheng J, and Conrad M (2020). The Metabolic Underpinnings of Ferroptosis. Cell Metab. 32, 920–937. 10.1016/j.cmet.2020.10.011. - DOI - PubMed

Substances

LinkOut - more resources