. 2025 May;66(5):635-649.
doi: 10.1111/jcpp.14069. Epub 2024 Nov 19.

Brain tissue microstructure in a prospective, longitudinal, population-based cohort of preterm and term-born young adults

Affiliations

Brain tissue microstructure in a prospective, longitudinal, population-based cohort of preterm and term-born young adults

Bradley S Peterson et al. J Child Psychol Psychiatry. 2025 May.

Abstract

Background: Fifteen million infants annually are born prematurely, placing them at high risk for life-long adverse neurodevelopmental outcomes. Whether brain tissue abnormalities that accompany preterm birth persist into young adulthood and are associated with long-term cognitive or psychiatric outcomes is not known.

Methods: From infancy into young adulthood, we followed a population-based sample of consecutively identified preterm infants and their matched term controls. The preterm group was born at an average gestational age of 31.5 ± 2.6 weeks. We obtained Diffusion Tensor Imaging scans and assessed cognitive and psychiatric outcomes in young adulthood, at a mean age of 19 (range 17.6-20.8) years. Usable data were acquired from 180 participants (89 preterm, 91 term).

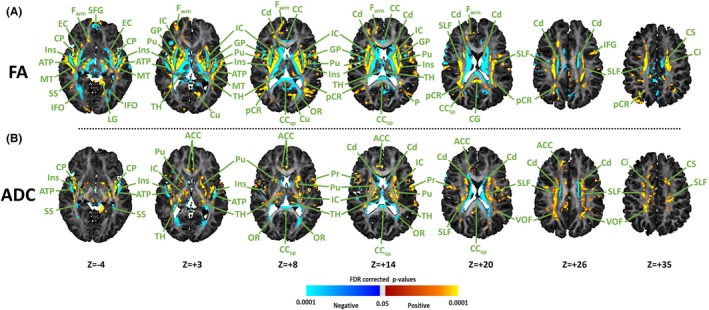
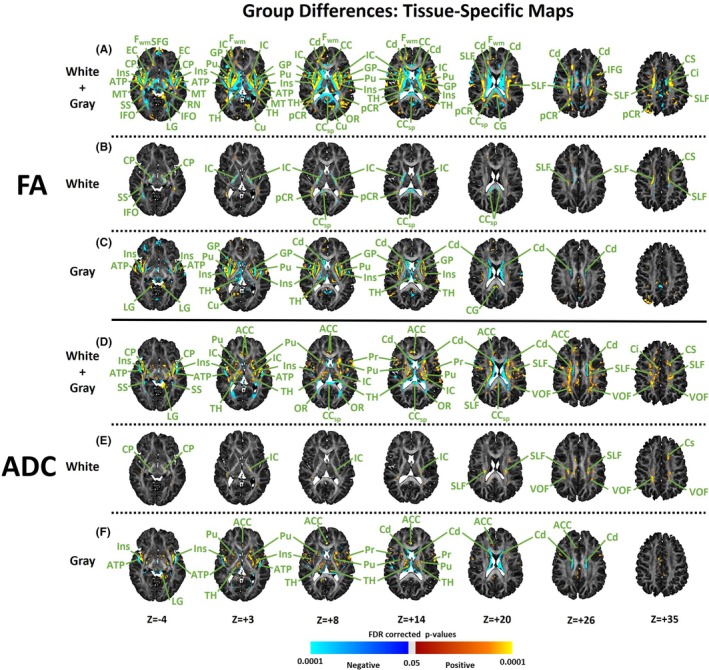
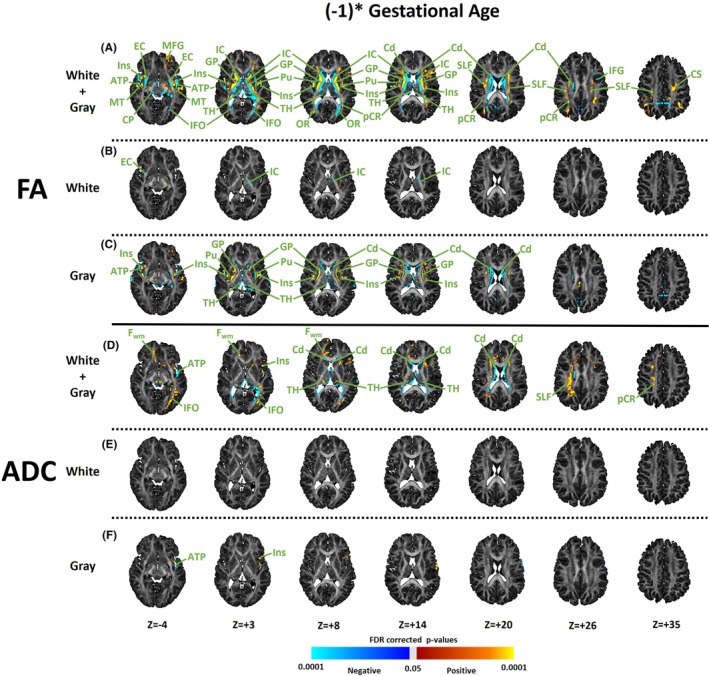
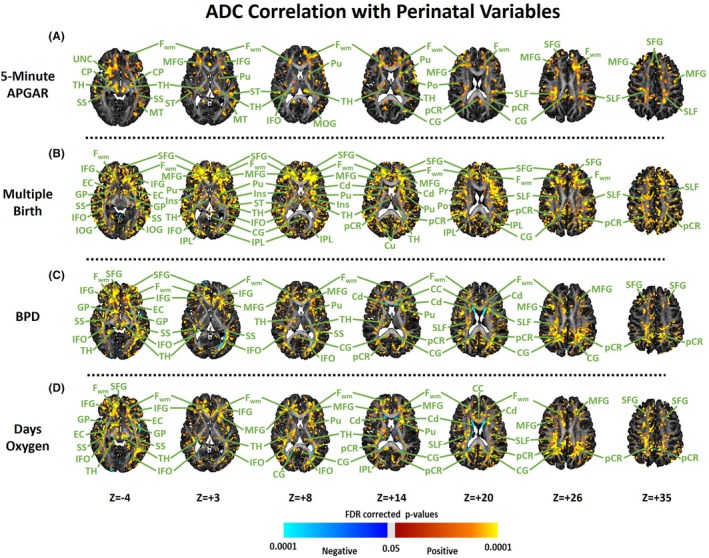
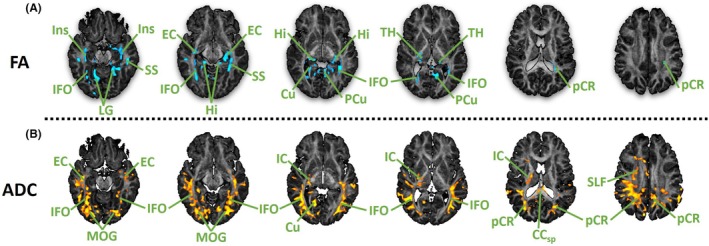
Results: Preterm birth was associated with lower fractional anisotropy (FA) and higher average diffusion coefficient (ADC) values in deep white matter tracts of the internal capsule, cerebral peduncles, inferior frontal-occipital fasciculus, sagittal stratum and splenium of the corpus callosum, as well as in grey matter of the caudate, putamen and thalamus. A younger gestational age at birth accentuated these tissue abnormalities. Perinatal characteristics, including lower 5-min APGAR score, history of bronchopulmonary dysplasia, more days of oxygen supplementation and multiple births all increased ADC values in deep white matter tracts and grey matter throughout the brain. Preterm individuals had significantly lower full-scale IQ and more frequent lifetime psychiatric disorders. Those with psychiatric illnesses had significantly higher ADC and lower FA values throughout the deep posterior white matter.

Conclusions: Abnormalities in brain tissue microstructure associated with preterm birth persist into young adulthood and likely represent disordered myelination and accompanying axonal pathology. These disturbances are associated with a higher likelihood of developing a psychiatric disorder by young adulthood. Brain tissue disturbances were accentuated in those born at younger gestational ages and in those with a history of perinatal complications associated with infection and inflammation.

Keywords: Premature birth; diffusion tensor imaging; magnetic resonance imaging; preterm birth.


Figures

Figure 1
Figure 1
Group differences in DTI measures. The statistical significance (p‐values) of the group difference in FA (Panel A) or ADC (Panel B) value at each voxel is colour‐coded, with warm colours representing larger values and cooler colours representing lower values in the preterm group. The regression model was: FAorADC=β0+β1*Group+β2*age+β3*Sex+β4*Education+ϵ. This model controls for the effects of age at the time of scan, sex and average parental years of education. p‐values for β1 that survived the procedure for False Discovery Rate at an FDR = 0.05 were colour‐coded as shown in the colour bars and then displayed on the template brain. Transaxial slices are positioned parallel to the anterior commissure–posterior commissure line, with Z levels shown from the Talairach coordinate system. ACC, anterior cingulate cortex; ATP, anterior temporal pole; CC, corpus callosum; CCsp, splenium of the corpus callosum; CG, cingulate gyrus; Cd, caudate; Ci, cingulum; Cs, centrum semiovale; CP, cerebral peduncle; Cu, cuneus; EC, external capsule; Fwm, frontal white matter; GP, globus pallidus; IC, internal capsule; IFG, inferior frontal gyrus; IFO, inferior fronto‐occipital fasciculus; Ins, insula; LG, lingual gyrus; MT, middle temporal cortex; OR, optic radiation; P, parietal cortex; pCR, posterior corona radiata; Pr, precentral gyrus; Pu, putamen; SFG, superior frontal gyrus; SLF, superior longitudinal fasciculus; SS, sagittal stratum; TH, thalamus; VOF, vertical occipital fasciculus
Figure 2
Figure 2
Tissue‐specific maps for group differences in DTI measures. Construction and colour representation in these maps are as described in the legend for Figure 1. Rows A and D are identical to the maps in Figure 1. Rows B and C (and Rows E and F) are maps for group differences in FA or ADC values within either white or grey matter, respectively, to reduce partial volume effects at tissue interfaces and aid in tissue localization. FA and ADC maps for white and grey matter show voxels where >80% of participants had usable data (Supplemental Methods). ACC, anterior cingulate cortex; ATP, anterior temporal pole; CC, corpus callosum; CCsp, splenium of the corpus callosum; CG, cingulate gyrus; Cd, caudate; Ci, cingulum; Cs, centrum semiovale; CP, cerebral peduncle; Cu, cuneus; EC, external capsule; Fwm, frontal white matter; GP, globus pallidus; IC, internal capsule; IFG, inferior frontal gyrus; IFO, inferior fronto‐occipital fasciculus; Ins, insula; LG, lingual gyrus; MT, middle temporal cortex; OR, optic radiation; P, parietal cortex; pCR, posterior corona radiata; Pr, precentral gyrus; Pu, putamen; SFG, superior frontal gyrus; SLF, superior longitudinal fasciculus; SS, sagittal stratum; TH, thalamus; VOF, vertical occipital fasciculus
Figure 3
Figure 3
Association of DTI measures with gestational age in the preterm group. Shown here is the statistical significance (p‐values) for the association of FA or ADC values at each voxel with (−1)*gestational age at birth, which was coded in this way to facilitate comparison with maps for group differences in DTI measures (i.e. this coding facilitates assessment of whether group differences in Figure 1 increase with younger gestational ages at birth in the preterm group). Using data from the preterm group only, the regression model was: FAorADC=β0+β1*1*GestationalAgeatBirth+β2*Age+β3*Sex+β4*Education+ϵ, which controls for age at the time of scan, sex, and average parental years of education. p‐values for β1 that survived the procedure for False Discovery Rate at an FDR = 0.05 were colour‐coded as shown in the colour bars and then displayed on the template brain. Panel labels and tissue‐specific maps for white and gray matter are also shown, as in Figure 2. ATP, anterior temporal pole; Cd, caudate; CP, cerebral peduncle; Cs, centrum semiovale; EC, external capsule; Fwm, frontal white matter; GP, globus pallidus; IC, internal capsule; IFG, inferior frontal gyrus; IFO, inferior fronto‐occipital fasciculus; Ins, insula; MFG, middle frontal gyrus; MT, middle temporal cortex; OR, optic radiation; pCR, posterior corona radiata; Pu, putamen; SLF, superior longitudinal fasciculus; TH, thalamus
Figure 4
Figure 4
Associations of ADC values with perinatal characteristics in the preterm group. Shown here are the statistically significant associations of ADC values with perinatal characteristics in the preterm group using the regression model: ADC=β0+β1*Perinatal Characteristic+β2*Age+β3*Sex+β4*Education+ϵ, which controls for age at the time of scan, sex, and average parental years of education. p‐values for β1 that survived the procedure for False Discovery Rate at an FDR = 0.05 were colour‐coded as shown in the colour bars and then displayed on the template brain. Separate regression models were employed for perinatal characteristics that included 5‐min APGAR scores (Panel A), multiple births (coded 0 or 1, Panel B), bronchopulmonary dysplasia (‘BPD’ coded 0 or 1, Panel C), or the number of days assisted with supplemental oxygen (Panel D). Values for 5‐min APGAR were multiplied by −1 to facilitate comparison with other maps. Cd, caudate; CG, cingulate gyrus; CP, cerebral peduncle; EC, external capsule; F wm, frontal white matter; GP, globus pallidus; IFG, inferior frontal gyrus; IFO, inferior fronto‐occipital fasciculus; Ins, insula; IOG, inferior occipital gyrus; IPL, inferior parietal lobule; MFG, middle frontal gyrus; MOG, middle occipital gyrus; MT, middle temporal cortex; pCR, posterior corona radiata; PO, post‐central gyrus; Pr, precentral gyrus; Pu, putamen; SFG, superior frontal gyrus; SLF, superior longitudinal fasciculus; SS, sagittal stratum; ST, superior temporal gyrus TH, thalamus; UNC, uncinate fasciculus
Figure 5
Figure 5
Associations of FA and ADC values with lifetime psychiatric illness in the preterm group. Shown here are the statistically significant associations of FA and ADC values comparing those in the preterm group who have a lifetime history of psychiatric illness (N = 17) versus those with no lifetime history of psychiatric illness (N = 70). The regression model was: FAorADC=β0+β1*Lifetime History+β2*Age+β3*Sex+β4*Education+ϵ, which covaried for age at the time of scan, sex, and average parental years of education, displayed at a threshold of p < .05 after FDR correction for multiple comparisons. FA and ADC maps for white and grey matter separately, to reduce the partial volume effects and as an aid to tissue localization, particularly at the interface of differing tissues, are provided in Appendix S1 (Figure S33–S36). CC, corpus callosum; Cu, cuneus; EC, external capsule; Hi, hippocampus; IFO, inferior fronto‐occipital fasciculus; Ins, insula; LG, lingual gyrus; MOG, Medial occipital gyrus; pCR, posterior corona radiata; Pcu, pre‐cuneus; SLF, superior longitudinal fasciculus; SS, sagittal stratum; TH, thalamus [Correction added on 13 December 2024, after first online publication: The first sentence of Figure 5's caption, ‘Associations of ADC values with perinatal characteristics in the preterm group’ has been corrected to ‘Associations of FA and ADC values with lifetime psychiatric illness in the preterm group’, in this version.]

Similar articles

References

    1. Abhinav, K. , Yeh, F.C. , Pathak, S. , Suski, V. , Lacomis, D. , Friedlander, R.M. , & Fernandez‐Miranda, J.C. (2014). Advanced diffusion MRI fiber tracking in neurosurgical and neurodegenerative disorders and neuroanatomical studies: A review. Biochimica et Biophysica Acta‐Molecular Basis of Disease, 1842, 2286–2297. - PubMed
    1. Alexander, A.L. , Hasan, K.M. , Lazar, M. , Tsuruda, J.S. , & Parker, D.L. (2001). Analysis of partial volume effects in diffusion‐tensor MRI. Magnetic Resonance in Medicine: An Official Journal of the International Society for Magnetic Resonance in Medicine, 45, 770–780. - PubMed
    1. Alexandrou, G. , Mårtensson, G. , Skiöld, B. , Blennow, M. , Adén, U. , & Vollmer, B. (2014). White matter microstructure is influenced by extremely preterm birth and neonatal respiratory factors. Acta Paediatrica, 103, 48–56. - PubMed
    1. Almeida, R.G. , & Lyons, D.A. (2017). On myelinated axon plasticity and neuronal circuit formation and function. The Journal of Neuroscience, 37, 10023–10034. - PMC - PubMed
    1. Assaf, Y. , & Basser, P.J. (2005). Composite hindered and restricted model of diffusion (CHARMED) MR imaging of the human brain. NeuroImage, 27, 48–58. - PubMed