. 2024 Nov 19;12(11):e009110.
doi: 10.1136/jitc-2024-009110.

Preclinical evaluation of antigen-sensitive B7-H3-targeting nanobody-based CAR-T cells in glioblastoma cautions for on-target, off-tumor toxicity

Affiliations

Preclinical evaluation of antigen-sensitive B7-H3-targeting nanobody-based CAR-T cells in glioblastoma cautions for on-target, off-tumor toxicity

Fien Meeus et al. J Immunother Cancer. .

Abstract

Background: Glioblastoma is the most common lethal primary brain tumor, urging evaluation of new treatment options. Chimeric antigen receptor (CAR)-T cells targeting B7 homolog 3 (B7-H3) are promising because of the overexpression of B7-H3 on glioblastoma cells but not on healthy brain tissue. Nanobody-based (nano)CARs are gaining increasing attention as promising alternatives to classical single-chain variable fragment-based (scFv)CARs, because of their single-domain nature and low immunogenicity. Still, B7-H3 nanoCAR-T cells have not been extensively studied in glioblastoma.

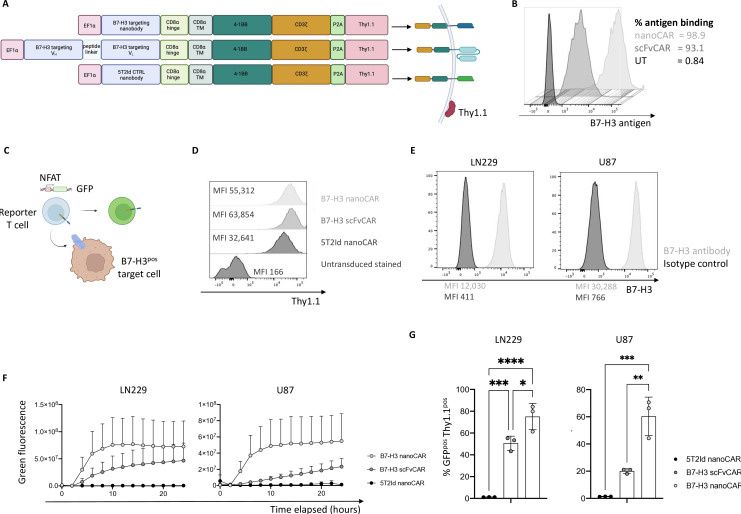
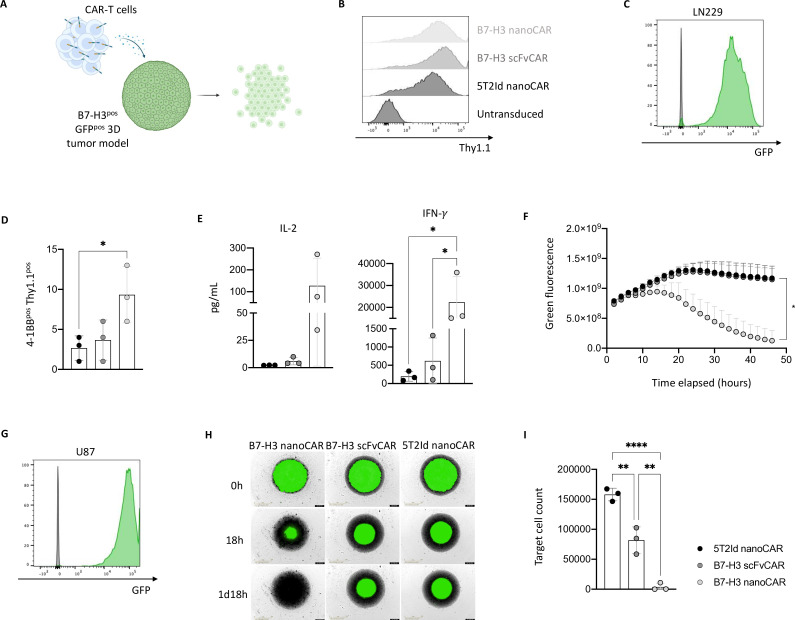
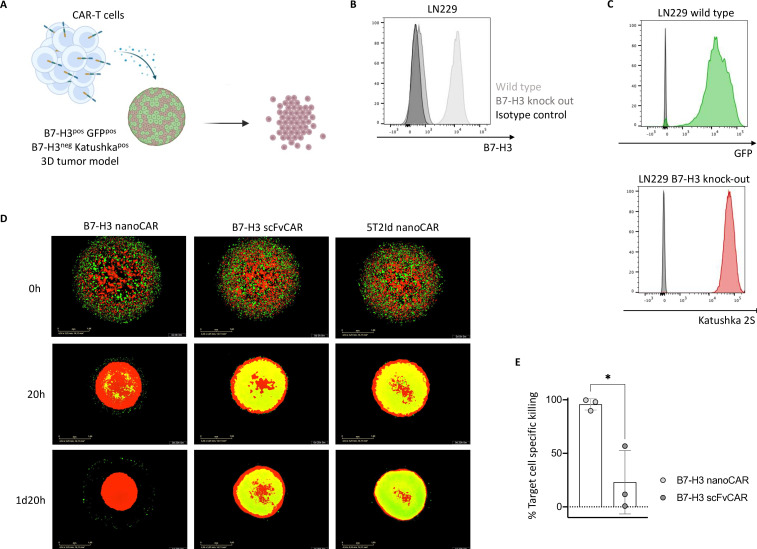
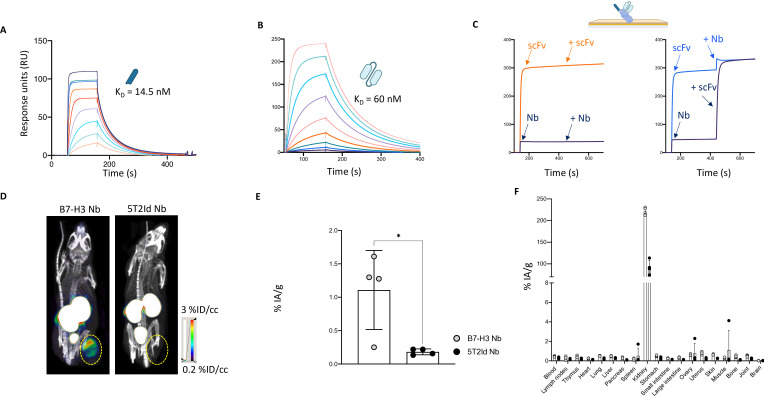
Methods: B7-H3 nanoCAR- and scFvCAR-T cells were developed and evaluated in human glioblastoma models. NanoCAR-T cells targeting an irrelevant antigen served as control. T cell activation, cytokine secretion and killing capacity were evaluated in vitro using ELISA, live cell imaging and flow cytometry. Antigen-specific killing was assessed by generating B7-H3 knock-out cells using Clustered Regularly Interspaced Short Palindromic Repeats (CRISPR)/Cas9-genome editing. The tumor tracing capacity of the B7-H3 nanobody was first evaluated in vivo using nuclear imaging. Then, the therapeutic potential of the nanoCAR-T cells was evaluated in a xenograft glioblastoma model.

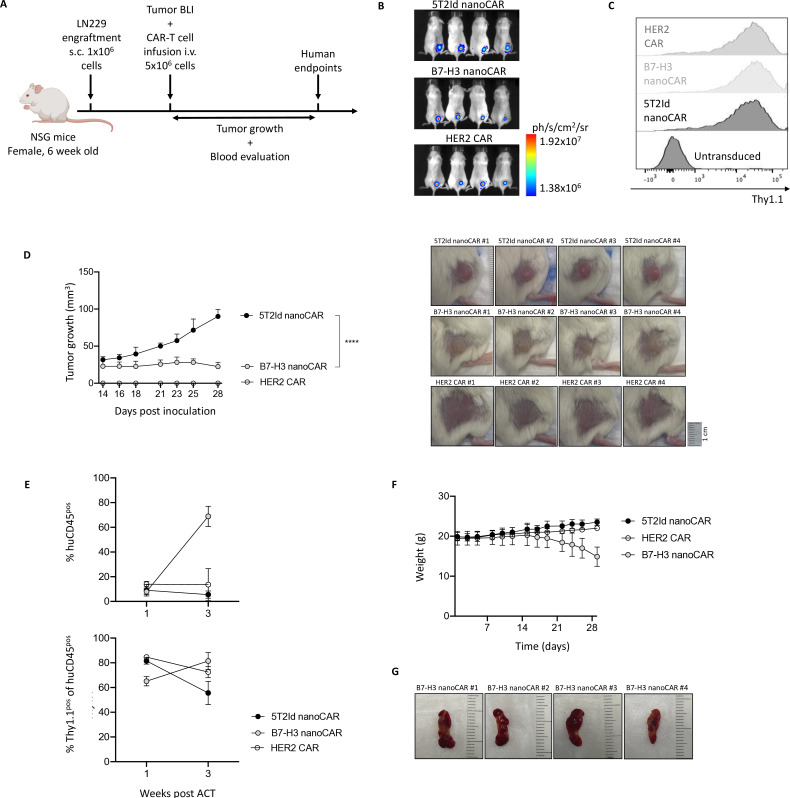
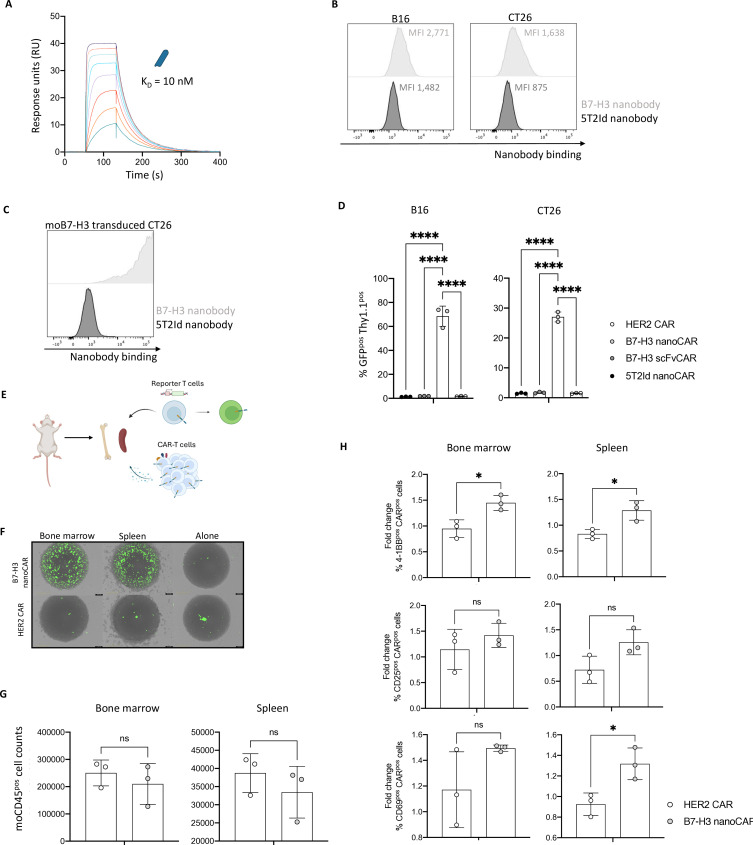
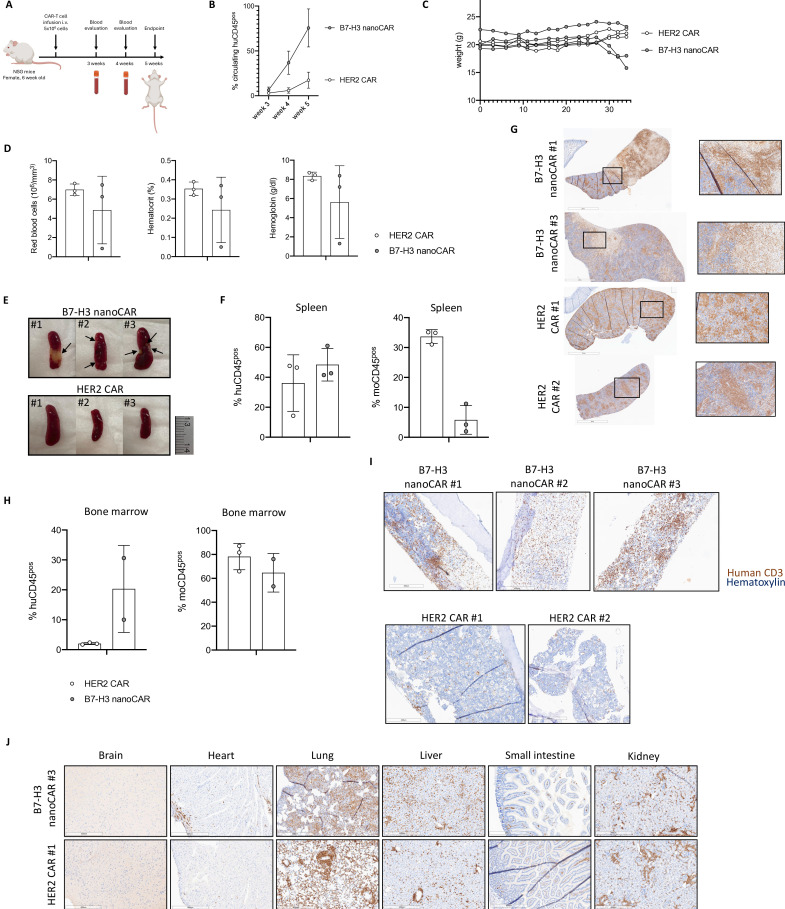
Results: We showed that B7-H3 nanoCAR-T cells were most efficient in lysing B7-H3pos glioblastoma cells in vitro. Lack of glioblastoma killing by control nanoCAR-T cells and lack of B7-H3neg glioblastoma killing by B7-H3 nanoCAR-T cells showed antigen-specificity. We showed in vivo tumor targeting capacity of the B7-H3 nanobody-used for the nanoCAR design-in nuclear imaging experiments. Evaluation of the nanoCAR-T cells in vivo showed tumor control in mice treated with B7-H3 nanoCAR-T cells in contrast to progressive disease in mice treated with control nanoCAR-T cells. However, we observed limiting toxicity in mice treated with B7-H3 nanoCAR-T cells and showed that the B7-H3 nanoCAR-T cells are activated even by low levels of mouse B7-H3 expression.

Conclusions: B7-H3 nanoCAR-T cells showed promise for glioblastoma therapy following in vitro characterization, but limiting in vivo toxicity was observed. Off-tumor recognition of healthy mouse tissue by the cross-reactive B7-H3 nanoCAR-T cells was identified as a potential cause for this toxicity, warranting caution when using highly sensitive nanoCAR-T cells, recognizing the low-level expression of B7-H3 on healthy tissue.

Keywords: Adoptive cell therapy - ACT; Chimeric antigen receptor - CAR; Immunotherapy; Solid tumor; T cell.


Conflict of interest statement

Competing interests: No, there are no competing interests.

Figures

Figure 1
Figure 1. B7-H3 nanoCARs induce strong activation signaling in T cells on recognition of glioblastoma cells. (A) Graphical representation of CAR constructs. (B) Binding capacity of cell-expressed CARs to soluble, recombinant human B7-H3 protein. (C) Graphical representation of a reporter T cell line harboring GFP under control of a NFAT-dependent promoter. (D) CAR expression as determined by Thy1.1 reporter expression on reporter T cells. (E) B7-H3 expression on two glioblastoma cell lines: LN229 and U87. (F) Quantified increase in green fluorescence of Jurkat-76 reporter T cells on co-culture with target cells, as evaluated by IncuCyte live cell imaging. (G) % GFPpos Thy1.1pos cells after 24 hours of co-culture, as determined by flow cytometry. Data represent mean±SD n=3, independent experiments. *p≤0.05; **p≤0.01; ***p≤0.001; ****p≤0.0001. Statistical significance was determined by one-way ANOVA with Tukey’s multiple comparisons correction in panel G. 5T2Id, 5T2 multiple myeloma idiotype; ANOVA, analysis of variance; B7-H3, B7 homolog 3; CAR, chimeric antigen receptor; MFI, mean fluorescence intensity; nanoCAR, nanobody-based chimeric antigen receptor; scFvCAR, single-chain variable fragment-based chimeric antigen receptor; UT, untransduced; VH, heavy-chain variable fragment; VL, light-chain variable fragment.
Figure 2
Figure 2. B7-H3 nanoCAR-T cells kill glioblastoma cells in vitro and secrete high levels of IFN-γ. (A) Graphical representation of CAR-T cell mediated cell killing of GFPpos B7-H3pos three-dimensional tumor models. (B) CAR transduction efficiency of expanded primary T cells based on Thy1.1 expression at day 10 post-transduction. (C) GFP expression in LN229 cells stably transduced with GFP-encoding lentiviral vectors. (D) 4-1BB expression on CAR-T cells on co-culturing with LN229 cells. (E) IL-2 and IFN-γ levels secreted by CAR-T cells on co-culturing with LN229 cells. (F) Quantified live cell imaging from IncuCyte showing killing of GFPpos three-dimensional LN229 tumor models by CAR-T cells. (G) GFP expression in U87 cells stably transduced with GFP-encoding lentiviral vectors. (H) Live cell images from IncuCyte showing killing of GFPpos three-dimensional U87 tumor models by CAR-T cells, as shown for one representative donor. (I) End-point flow cytometric analysis of absolute target cell counts after co-culturing with CAR-T cells. Data represent mean±SD n=3, biological repeats. Each dot represents a different donor. * p≤0.05; **p≤0.01; ****p≤0.0001. Statistical significance was determined by one-way ANOVA with Tukey’s multiple comparisons correction in panel D, E and I. Two-way ANOVA with Dunnett’s multiple comparisons test was used to determine statistical significance in panel F (significance shown on the graph for the last time point (48 hours), comparing the B7-H3 and 5T2Id nanoCAR conditions). 5T2Id, 5T2 multiple myeloma idiotype; ANOVA, analysis of variance; B7-H3, B7 homolog 3; CAR, chimeric antigen receptor; IFN-γ, interferon gamma; IL-2, interleukin-2; nanoCAR, nanobody-based chimeric antigen receptor; scFvCAR, single-chain variable fragment-based chimeric antigen receptor.
Figure 3
Figure 3. Killing by B7-H3 nanoCAR-T cells is antigen-specific. (A) Graphical representation of CAR-T cell killing of GFPpos B7-H3pos LN229 glioblastoma cells but not Katushka2Spos B7-H3neg LN229 cells. (B) B7-H3 expression on wild type LN229 cells and B7-H3 knock-out LN229 cells. (C) GFP expression in wild type LN229 cells and Katushka2S expression in B7-H3 knock-out LN229 cells, following stable transduction with lentiviral vectors. (D) Live cell images from IncuCyte showing killing of GFPpos target cells but not Katushka2Spos non-target cells in three-dimensional tumor models by CAR-T cells, as shown for one representative donor. (E) End-point flow cytometric analysis of % target cell specific killing. Data represent mean±SD n=3, biological repeats. Each dot represents a different donor. *p≤0.05. Statistical significance in panel E was determined using an unpaired t-test. 5T2Id, 5T2 multiple myeloma idiotype; B7-H3, B7 homolog 3; CAR, chimeric antigen receptor; nanoCAR, nanobody-based chimeric antigen receptor; scFvCAR, single-chain variable fragment-based chimeric antigen receptor.
Figure 4
Figure 4. Radiolabeled B7-H3 nanobody has potent in vivo tumor targeting capacity. (A) Evaluation of binding kinetics of purified B7-H3 nanobody on immobilized recombinant human B7-H3 protein using SPR. The sensorgram represents binding and dissociation of a dilution series (1/2 dilution series ranging from 500 nM to 3.9 nM) of the nanobody. Binding kinetics were calculated using the Biacore T200 V.2.0 evaluation software to calculate the KD value. (B) Evaluation of binding kinetics of purified B7-H3 scFv on immobilized recombinant human B7-H3 protein using SPR. The sensorgram represents binding and dissociation of a dilution series (1/2 dilution series ranging from 500 nM to 1.9 nM) of the scFv. Binding kinetics were calculated using the Biacore T200 V.2.0 evaluation software to calculate the KD value. (C) Competition study of the B7-H3 nanobody and scFv showing that both bind a different epitope on human B7-H3, as determined by SPR. The absence of competition is shown by the increase in signal obtained by binding of the competitor in a second association step (right panel) as compared with the signal obtained by the individual components (left panel). (D) Representative SPECT/CT images of tumor-bearing mice 1 hour postinjection with radiolabeled B7-H3 or 5T2Id nanobodies. The images are representative for three mice. Yellow circles indicate tumor positioning. (E) Graph of percentages injected activity per gram (%IA/g) for isolated tumors as determined by ex vivo γ-counting. The graph summarizes the tumor uptake of the B7-H3 and 5T2Id nanobody in four mice. (F) Graph of percentages injected activity per gram (%IA/g) for all isolated organs and tissues as determined by ex vivo γ-counting. The graph summarizes the biodistribution of the B7-H3 and 5T2Id nanobody in four mice. Data represent mean±SD n=4 mice per group. *p≤0.05. Statistical significance in panel E was determined using an unpaired t-test. 5T2Id, 5T2 multiple myeloma idiotype; B7-H3, B7 homolog 3; KD, equilibrium dissociation constant; Nb, nanobody; scFv, single-chain variable fragment; SPECT, single photon emission computed tomography; SPR, surface plasmon resonance.
Figure 5
Figure 5. B7-H3 nanoCAR-T cells control tumor growth in vivo but are associated with toxicity events. (A) Graphical overview of in vivo experimental set-up. (B) Bioluminescent images at day 3 post inoculation. (C) Thy1.1 expression of expanded CAR-T cell products at day 10 post-transduction. (D) Tumor growth curves over time (left) and tumor images at 28 days post inoculation, shown for all conditions (right). (E) Flow cytometry data of blood from mice, processed at 1 and 3 weeks of CAR-T cell treatment, showing % of circulating human CD45 cells gated within all living blood cells and Thy1.1 positive cells within the human CD45pos cell population. (F) Weight curves over time. (G) Images of spleens dissected from B7-H3 nanoCAR-treated mice. Data represent mean±SD n=4 mice per group. ****p≤0.0001. Two-way ANOVA with Bonferroni’s multiple comparisons test was used to determine statistical significance in panel D. Statistical significance shown on the graph at 28 days post inoculation. 5T2Id, 5T2 multiple myeloma idiotype; ACT, adoptive cell transfer; ANOVA, analysis of variance; B7-H3, B7 homolog 3; BLI, bioluminescence imaging; CAR, chimeric antigen receptor; HER2, human epidermal growth factor receptor 2; i.v., intravenously; nanoCAR, nanobody-based chimeric antigen receptor; s.c., subcutaneously.
Figure 6
Figure 6. In vivo toxicity of B7-H3 nanoCAR-T cells may be explained by cross-reactivity to mouse B7-H3 and sensitivity to low levels of endogenous B7-H3 expression on mouse cells. (A) Evaluation of binding kinetics of purified B7-H3 nanobody on immobilized recombinant mouse B7-H3 protein using SPR. The sensorgram represents binding and dissociation of a dilution series (1/2 dilution series ranging from 500 nM to 3.9 nM) of the nanobody. Binding kinetics were calculated using the Biacore T200 V.2.0 evaluation software to calculate the KD value. (B) B7-H3 and 5T2Id nanobody-binding to wild-type B16 and CT26 mouse cells, as determined by flow cytometry. (C) B7-H3 and 5T2Id nanobody-binding to the CT26 mouse cells overexpressing mouse B7-H3 through lentiviral transduction, as determined by flow cytometry. (D) % GFPpos Thy1.1pos cells after co-culture of CARpos Jurkat-76 reporter T cells with wild type B16 or CT26 mouse cells, as determined by flow cytometry. (E) Graphical overview of ex vivo experimental set-up. (F) Images from IncuCyte live cell imaging after 24 hours of co-culture showing GFP expression in reporter T cells on co-culturing with spleen cells, bone marrow cells, or in the absence of target cells. (G) End-point flow cytometric analysis of absolute target cell counts after co-culturing with CAR-T cells. (H) 4-1BB, CD25 and CD69 expression on CAR-T cells on co-culturing with spleen or bone marrow cells from NSG mice. Data are shown as fold change in activation marker expression of CAR-T cells cultured with target cells relative to the CAR-T cells without target cells, for each separate donor. Data represent mean±SD n=3, independent experiments, in panel D. n=3, biological repeats (from three different donors, and cells pooled from three different mice), in panel G and H. Each dot represents a different donor in panel G and H. *p≤0.05; ****p≤0.0001. Statistical significance was determined by one-way ANOVA with Tukey’s multiple comparisons correction in panel D. Statistical significance was determined by unpaired t-tests with Welch’s correction in panel G and H. 5T2Id, 5T2 multiple myeloma idiotype; ANOVA, analysis of variance; B7-H3, B7 homolog 3; CAR, chimeric antigen receptor; HER2, human epidermal growth factor receptor 2; KD, equilibrium dissociation constant; MFI, mean fluorescence intensity; nanoCAR, nanobody-based chimeric antigen receptor; scFvCAR, single-chain variable fragment-based chimeric antigen receptor; SPR, surface plasmon resonance.
Figure 7
Figure 7. Reactivity of B7-H3 nanoCAR-T cells in non-tumor-bearing mice confirm the occurrence of on-target, off-tumor toxicity. (A) Graphical overview of in vivo experimental set-up. (B) Flow cytometry data of blood from mice, processed at 3, 4 and 5 weeks of CAR-T cell treatment, showing % of circulating human CD45 cells gated within all living blood cells. (C) Weight curves over time. (D) Hematological analysis of blood after 5 weeks of B7-H3 nanoCAR or HER2-CAR therapy evaluating red blood cell, hemoglobin and hematocrit levels as determined by the scil Vet abc Plus. (E) Images of spleens dissected from mice after 5 weeks of B7-H3 nanoCAR or HER2-CAR therapy. (F) Flow cytometry data of spleens from mice, processed at 5 weeks of CAR-T cell treatment, showing % of human and mouse CD45 cells gated within all living spleen cells (G) Immunohistochemical staining of spleens from the indicated mice, assessing CAR-T infiltration based on human CD3 staining. (H) Flow cytometry data of bone marrow cells from mice, processed at 5 weeks of CAR-T cell treatment, showing % of human and mouse CD45 cells gated within all living bone marrow cells. (I) Immunohistochemical staining of femurs from the indicated mice, assessing CAR-T infiltration based on human CD3 staining. (J) Representative Immunohistochemical staining of brain, heart, lung, liver, small intestine and kidney of mice with human CD3 antibody to detect CAR-T infiltration. Data represent mean±SD n=3 mice per group. B7-H3, B7 homolog 3; CAR, chimeric antigen receptor; HER2, human epidermal growth factor receptor 2; i.v., intravenously; nanoCAR, nanobody-based chimeric antigen receptor.

References

    1. Tan AC, Ashley DM, López GY, et al. Management of glioblastoma: State of the art and future directions. CA Cancer J Clin. 2020;70:299–312. doi: 10.3322/caac.21613. - DOI - PubMed
    1. Verma A, Rafiq S. Chimeric Antigen Receptor (CAR) T Cell Therapy for Glioblastoma. Cancer Treat Res. 2022;183:161–84. doi: 10.1007/978-3-030-96376-7_5. - DOI - PubMed
    1. Medikonda R, Dunn G, Rahman M, et al. A review of glioblastoma immunotherapy. J Neurooncol. 2021;151:41–53. doi: 10.1007/s11060-020-03448-1. - DOI - PubMed
    1. Lim M, Xia Y, Bettegowda C, et al. Current state of immunotherapy for glioblastoma. Nat Rev Clin Oncol. 2018;15:422–42. doi: 10.1038/s41571-018-0003-5. - DOI - PubMed
    1. Louveau A, Herz J, Alme MN, et al. CNS lymphatic drainage and neuroinflammation are regulated by meningeal lymphatic vasculature. Nat Neurosci. 2018;21:1380–91. doi: 10.1038/s41593-018-0227-9. - DOI - PMC - PubMed

LinkOut - more resources