. 2024 Nov 19;12(11):e008898.
doi: 10.1136/jitc-2024-008898.

TNFR2 blockade promotes antitumoral immune response in PDAC by targeting activated Treg and reducing T cell exhaustion

Affiliations

TNFR2 blockade promotes antitumoral immune response in PDAC by targeting activated Treg and reducing T cell exhaustion

Anais Debesset et al. J Immunother Cancer. .

Abstract

Background: Pancreatic ductal adenocarcinoma (PDAC) is one of the most aggressive cancers, highly resistant to standard chemotherapy and immunotherapy. Regulatory T cells (Tregs) expressing tumor necrosis factor α receptor 2 (TNFR2) contribute to immunosuppression in PDAC. Treg infiltration correlates with poor survival and tumor progression in patients with PDAC. We hypothesized that TNFR2 inhibition using a blocking monoclonal antibody (mAb) could shift the Treg-effector T cell balance in PDAC, thus enhancing antitumoral responses.

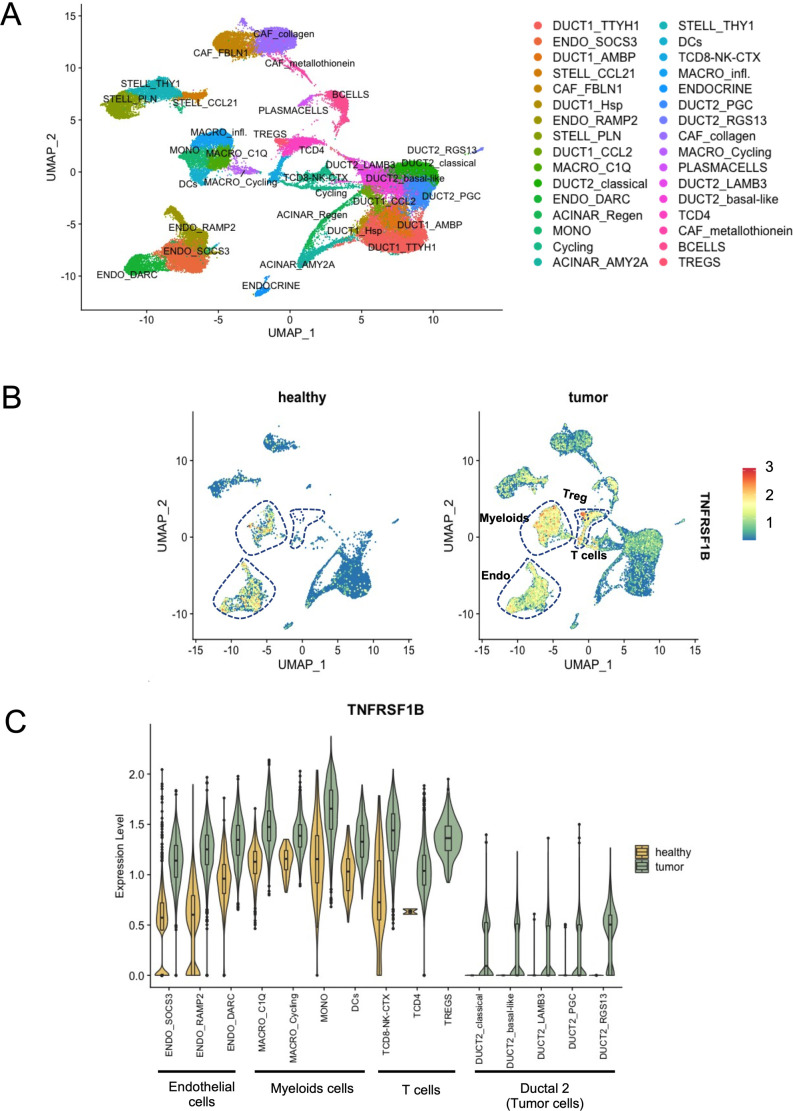
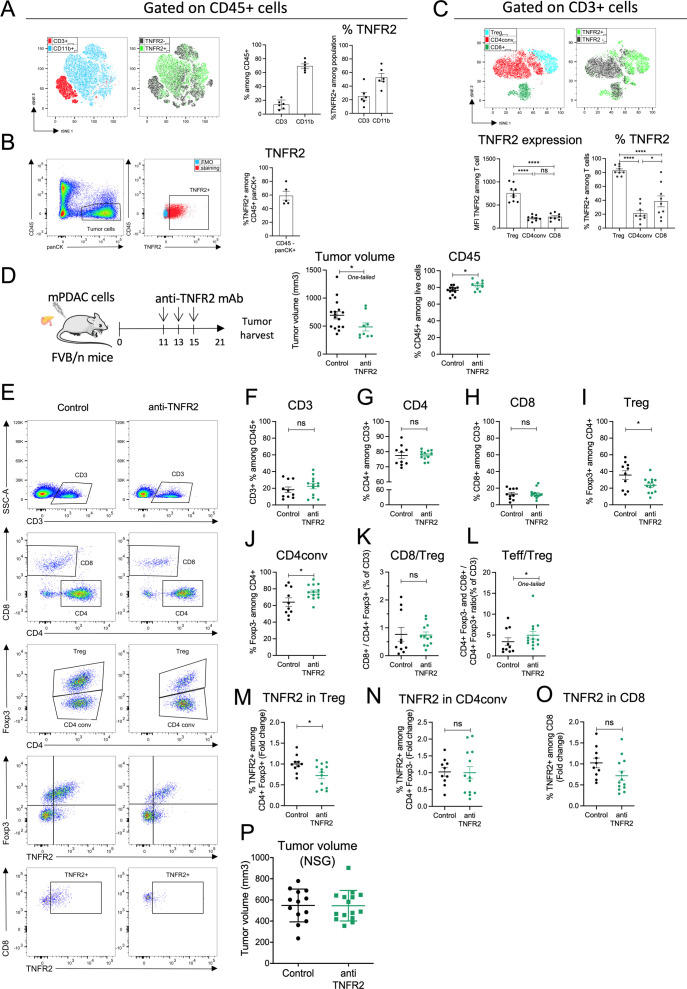
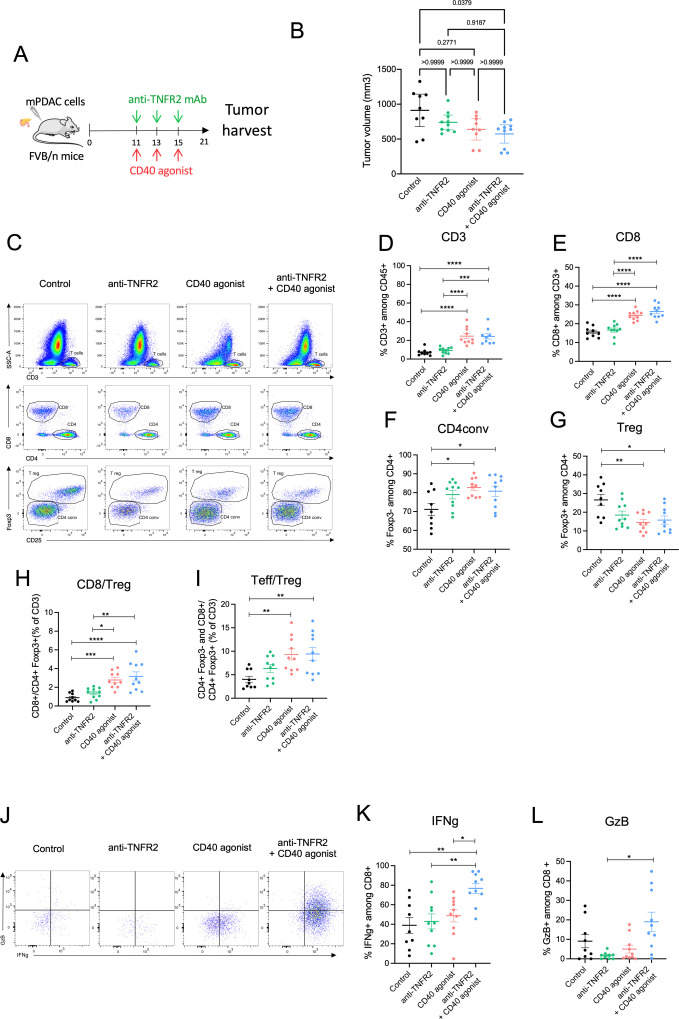
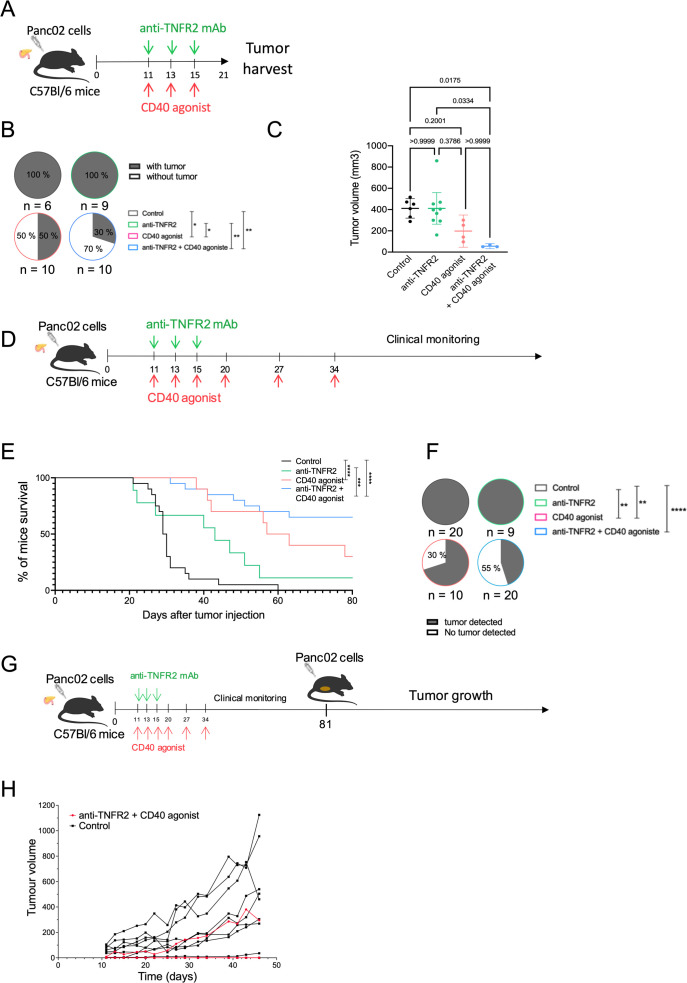
Method: To support this hypothesis, we first described TNFR2 expression in a cohort of 24 patients with PDAC from publicly available single-cell analysis data. In orthotopic and immunocompetent mouse models of PDAC, we also described the immune environment of PDAC after immune cell sorting and single-cell analysis. The modifications of the immune environment before and after anti-TNFR2 mAb treatment were evaluated as well as the effect on tumor progression.

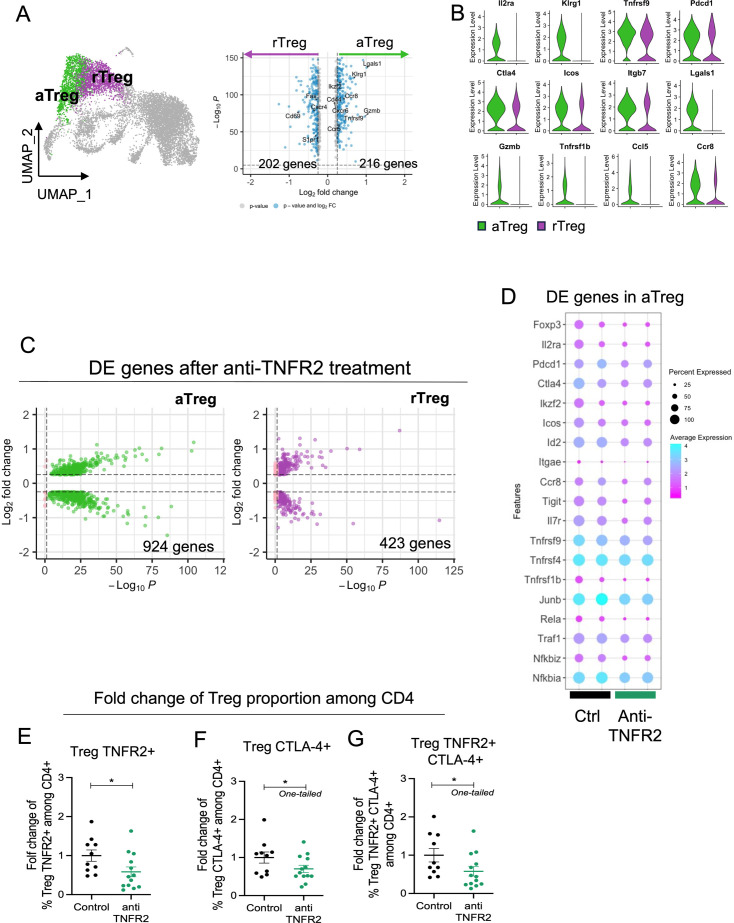
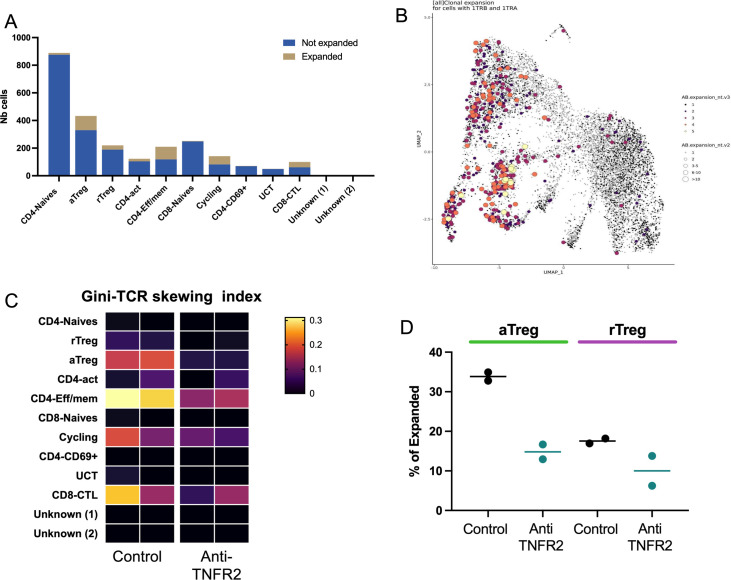
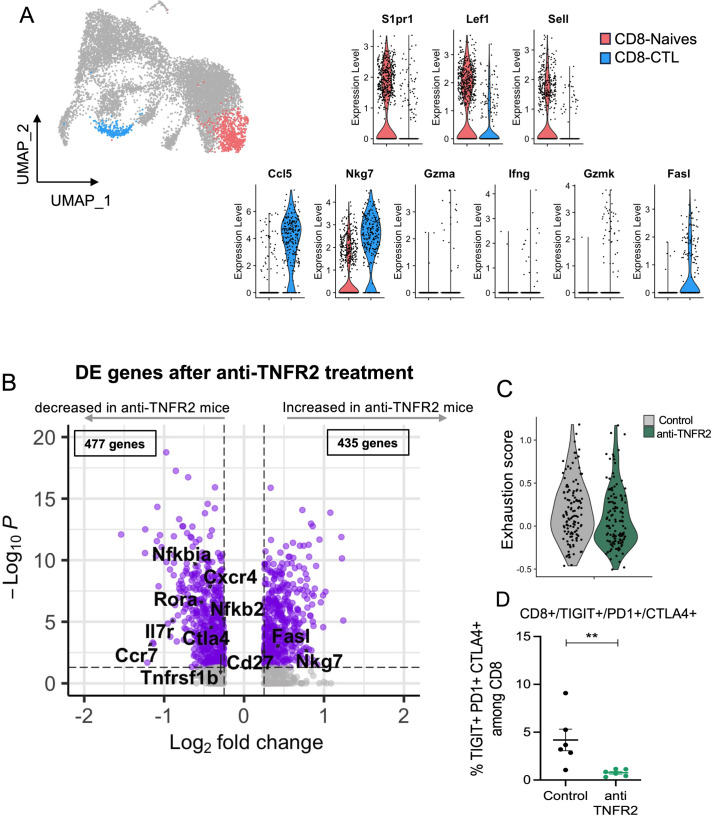
Results: Patients with PDAC exhibited elevated TNFR2 expression in Treg, myeloid cells and endothelial cells and lower level in tumor cells. By flow cytometry and single-cell RNA-seq analysis, we identified two Treg populations in orthotopic mouse models: Resting and activated Tregs. The anti-TNFR2 mAb selectively targeted activated tumor-infiltrating Tregs, reducing T cell exhaustion markers in CD8+ T cells. However, anti-TNFR2 treatment alone had limited efficacy in activating CD8+ T cells and only slightly reduced the tumor growth. The combination of the anti-TNFR2 mAb with agonistic anti-CD40 mAb promoted stronger T cell activation, tumor growth inhibition, and improved survival and immunological memory in PDAC-bearing mice.

Conclusion: Our data suggest that combining a CD40 agonist with a TNFR2 antagonist represents a promising therapeutic strategy for patients with PDAC.

Keywords: Adenocarcinoma; Immune modulatory; T regulatory cell - Treg; Tumor infiltrating lymphocyte - TIL; Tumor microenvironment - TME.


Conflict of interest statement

Competing interests: EP is co-founder and consultant for Egle-Tx.

Figures

Figure 1
Figure 1. TNFR2 expression in human PDAC. (A) UMAP plot of main populations present in PDAC tumors from Peng et al. (B) Expression of TNFRSF1B split between tumor and healthy samples. (C) Violin plot displaying the expression of TNFRSF1B across the cell identified in PDAC. Adaptive thresholded low rank approximation-imputed data are depicted. PDAC, pancreatic ductal adenocarcinoma; TNFR2, tumor necrosis factor α receptor 2; Treg, regulatory T cells; UMAP, Uniform Manifold Approximation and Projection.
Figure 2
Figure 2. TNFR2 blockade decreases tumor volume and tumor-infiltrating Treg proportions in mouse models of PDAC. FvB/n immunocompetent mice (A–O) or NSG mice (P) were grafted with mPDAC cells into the pancreas. After 21 days, tumors were harvested for flow cytometry analysis. (A) Cell clustering using a t-distributed stochastic neighbor embedding (t-SNE) algorithm performed on CD45+ FVS− (Fixable Viability Stain) gate. CD3+ and CD11b+ cell clusters localization and TNFR2+ cell localization among the above-mentioned populations are indicated. Histograms show the proportion of intratumoral CD3+ and CD11b+ cells among CD45+ FVS− cells and of TNFR2+ cells among CD3+ or CD11b+ cells. (B) Gating strategy of tumor cells (CD45 panCK+) and TNFR2+ cells among tumor cells and proportion of TNFR2+ cells among CD45panCK+ cells. (C) Cell clustering using a t-SNE algorithm performed on CD3+ gate. Treg (CD4+Foxp3+), CD4conv (CD4+Foxp3) and CD8+ cell clusters, and TNFR2+ cell cluster localization are indicated. Histograms show TNFR2 expression (MFI TNFR2) and proportion in intratumoral Treg (CD4+Foxp3+), CD4conv (CD4+Foxp3-) and CD8+ cells. (D) Schemas of the experiment: mice were treated with anti-TNFR2 mAb, IgG control or PBS at day 11, 13 and 15 or were untreated. Tumor volume at day 21 was measured and infiltrated CD45+ cells among FVS− cells analyzed without previous separation on density gradient (n=16). (E) Gating strategy of infiltrated T lymphocytes analyzed by flow cytometry. Representative scatter plots of intratumoral (F–H) CD3+, CD4+ and CD8+; (I, J) Treg (CD4+Foxp3+) and CD4conv (CD4+Foxp3); (K–L) CD8+/Treg (CD4+Foxp3+) ratio, and Teff (CD4+Foxp3 and CD8+)/Treg(CD4+Foxp3+) ratio. (M–O) TNFR2 proportion among Treg (CD4+Foxp3+), CD4conv (CD4+Foxp3−) and CD8+ cells is represented as fold change (calculated by reporting each point to the mean of the control group). For (F–O) (n=20 including two experiments, representative of three experiments). Data are plotted as the mean±SEM. Statistical significance of (C) between population in control was determined using ANOVA multiple comparison test. Statistical significance of anti-TNFR2 treated groups from controls was determined using a Mann-Whitney test. Ns: non-significant, p>0.05, *p<0.05, **p<0.01, ***p<0.001. ANOVA, analysis of variance; IgG, immunoglobulin G; mAb, monoclonal antibody; PBS, phosphate-buffered saline; PDAC, pancreatic ductal adenocarcinoma; TNFR2, tumor necrosis factor α receptor 2; Treg, regulatory T cells.
Figure 3
Figure 3. TNFR2 blockade selectively targets activated Tregs over resting Tregs in a PDAC mouse model. FvB/n immunocompetent mice were grafted with mPDAC cells into the pancreas. Mice were treated with anti-TNFR2 mAb and tumors were harvest and intratumoral CD4+ and CD8+ were isolated for single-cell RNA sequencing. (A) UMAP plot with showing the two identified Treg clusters and violin plot comparing expression of different genes between aTreg (green) and rTreg (purple). (B) Volcano plot of differential gene expression analysis between aTreg and rTreg. (C) Volcano Plot of differential gene expression analysis between control and anti-TNFR2 treated mice for aTreg (Left) and rTreg (right) clusters. (D) Dot plot highlighting anti-TNFR2 treatment effect on gene expression level on aTreg. (E–G) Scatter plots of fold change of (E) Foxp3+ TNFR2+ (Treg TNFR2+), (F) Foxp3+ CTLA-4+ (Treg CTLA-4+) and (G) Foxp3+ TNFR2+ CTLA-4+ (Treg TNFR2+ CTLA-4+) proportions among CD4. Data are plotted as the mean±SEM. Statistical significance from controls was determined using a Mann-Whitney test two-tailed or one-tailed (F–G), *p<0.05. aTreg, activated regulatory T cell; CTLA-4, cytotoxic T-lymphocytes-associated protein 4; mAb, monoclonal antibody; PDAC, pancreatic ductal adenocarcinoma; rTreg, resting regulatory T cell; TNFR2, tumor necrosis factor α receptor 2; UMAP, Uniform Manifold Approximation and Projection.
Figure 4
Figure 4. TNFR2 blockade specifically reduces clonally expanded aTreg in a mouse model of PDAC. FvB/n immunocompetent mice were grafted with mPDAC cells into the pancreas. Mice were treated with anti-TNFR2 mAb and tumors were harvest and intratumoral CD4+ were isolated for single-cell RNA and TCR sequencing. (A) Distribution of cells with expanded clones among the different identified clusters, the clusters with more expanded cells are Treg, CD4-EFF/MEM and CD8 CTL (B) UMAP representation of expanded clones (same conclusion of A) (C) Gini index (explaining the diversity) of all cluster from all mice (near 1=expansion of clones, near 0=no expansion). (D) Specific effect of treatment on cells with expanded clones inside each Tregs cluster. aTreg, activated regulatory T cell; mAb, monoclonal antibody; PDAC, pancreatic ductal adenocarcinoma; rTreg, resting regulatory T cell; TNFR2, tumor necrosis factor α receptor 2; UMAP, Uniform Manifold Approximation and Projection.
Figure 5
Figure 5. TNFR2 blockade decreases the exhausted profile of CD8 T cells. FvB/n immunocompetent mice were grafted with mPDAC cells into the pancreas. Mice were treated with anti-TNFR2 mAb and tumors were harvest and intratumoral CD8+ were isolated for single-cell RNA and TCR sequencing. (A) UMAP plot showing CD8 clusters differentiated by color (CD8 CTL in blue and CD8-Naives in coral) and violin plot comparing expression of different genes between CD8 CTL and CD8-Naives. (B) Volcano plots of differential gene expression analysis between control and anti-TNFR2 treated mice within CD8 CTL cluster. (C) Violin plot showing expression level of CD8 exhaustion score (genes=Tigit, Havcr2, Ctla4, Lag3 and Tox) for each condition (gray: control group, green: anti-TNFR2 treated group). (D) Scatter plot of TIGIT+ CTLA-4+ PD-1+ cells proportion among intratumoral CD8+ cells analyzed by flow cytometry. Data are plotted as the mean±SEM. Statistical significance from controls was determined using a Mann-Whitney test, **p<0.01. CTLA-4, cytotoxic T-lymphocytes-associated protein 4; mAb, monoclonal antibody; PDAC, pancreatic ductal adenocarcinoma; PD-1, programmed cell death protein-1; TNFR2, tumor necrosis factor α receptor 2; UMAP, Uniform Manifold Approximation and Projection.
Figure 6
Figure 6. Combination of blocking anti-TNFR2 and agonistic anti-CD40 mAbs increases effector T cell activation. (A) Schemas of the experiment: FvB/n immunocompetent mice were grafted with mPDAC cells into the pancreas. Mice were treated with either anti-TNFR2 mAb or CD40 agonist or both or received PBS at day 11, 13, 15 (n=10). After 21 days, tumors were harvest for flow cytometry analysis (B) Scatter plot of tumor volume at day 21 are plotted as the mean with 95% CI. (C–G) Scatter plots of intratumoral CD3+, CD8+, Treg (CD4+ Foxp3+) and CD4conv (CD4+Foxp3) cells proportion with representative dot plot (C). (H–I) Scatter plots of CD8+/Treg(CD4+Foxp3+) ratio and Teff (CD4+Foxp3 and CD8+)/Treg (CD4+ Foxp3+) ratio. (J) Representative dot plot of IFN-γ+, and GzB+ (granzyme B) cells proportion in intratumoral CD8. (K–L) Scatter plots of IFN-γ+ and GzB+ proportion in CD8 cells. Data (B, D–I, K, L) are plotted as the mean±SEM. Statistical significance of the difference between groups was determined using the Kruskal-Wallis test (in B p=0.0446 in L p=0.0160) or One-way ANOVA (in D, H and E p<0.0001, in G p=0.0033, in I p=0.0031, in K p=0.018) (depending if data follow a normal distribution). The mean of each column was compared with the mean of the other columns with a Dunn (B and L) or Tukey’s (D–K) test: non-significant (ns) p>0.05, *p<0.05, **p<0.01, ***p<0.001, ****p<0.0001. All groups without asterisks in panels B, D–I, and K, L are ns. ANOVA, analysis of variance; IFN, interferon; mAb, monoclonal antibody; PBS, phosphate-buffered saline; PDAC, pancreatic ductal adenocarcinoma; TNFR2, tumor necrosis factor α receptor 2; Treg, regulatory T cell.
Figure 7
Figure 7. Combination of blocking anti-TNFR2 and agonistic anti-CD40 mAbs induces immunological T memory and improves survival of mice. (A) Schemas of the experiment: C56Bl/6j immunocompetent mice were grafted with Panc02 cells into the pancreas. Mice were treated with either anti-TNFR2 mAb or CD40 agonist or both or received PBS at day 11, 13 and 15 (n=10). Mice were euthanized at day 21. (B) Proportion of tumor incidence in control and treated groups represented in pie charts (χ², *p<0.05, **p<0.01). (C) Scatter plot of tumor volume at day 21 are plotted as the mean with 95% CI. Data are plotted as the mean±SEM. Statistical significance of the difference between groups was determined using the Kruskal-Wallis test (p=0.0062) and with a Dunn test for multiple comparison between all groups. ns: non-significant, *p<0.05. All groups without asterisks in panel C are ns. (D) Schemas of the experiment: C56Bl/6j immunocompetent mice were grafted with Panc02 cells into the pancreas. Mice were treated with either anti-TNFR2 mAb or CD40 agonist or both or received PBS at day 11, 13 and 15, 20, 27 and 34 and were clinically monitored. (E) Kaplan-Meier survival curve of the following groups: control (n=20), anti-TNFR2 (n=9), CD40 agonist (n=10) and anti-TNFR2+CD40 agonist (n=20). Mice are euthanized when the limit of the clinical score (established by a grid of symptoms) is reached. (Kaplan-Meier test, ***p<0.001, ****p<0.0001). (F) Presence of tumor (primary and/or metastatic) is challenged by echography at day 64. (χ², **p<0.01, ***p<0.001, ****p<0.0001). (G) Schemas of the experiment: mice still alive from anti-TNFR2 + CD40 agonist group and C57Bl/6 naive mice received subcutaneous injection of Panc02 cells at day 81, and monitored for tumor growth. Tumor growth for individual mice is shown in (H). mAbs, monoclonal antibody; PBS, phosphate-buffered saline; TNFR2, tumor necrosis factor α receptor 2.

References

    1. Bray F, Ferlay J, Soerjomataram I, et al. Global cancer statistics 2018: GLOBOCAN estimates of incidence and mortality worldwide for 36 cancers in 185 countries. CA Cancer J Clin. 2018;68:394–424. doi: 10.3322/caac.21492. - DOI - PubMed
    1. Słodkowski M, Wroński M, Karkocha D. Current approaches for the curative-intent surgical treatment of pancreatic ductal adenocarcinoma. Cancers (Basel) 2023;15:2584. doi: 10.3390/cancers15092584. - DOI - PMC - PubMed
    1. Mizrahi JD, Surana R, Valle JW, et al. Pancreatic cancer. Lancet. 2020;395:2008–20. doi: 10.1016/S0140-6736(20)30974-0. - DOI - PubMed
    1. Halbrook CJ, Lyssiotis CA, Pasca di Magliano M, et al. Pancreatic cancer: advances and challenges. Cell. 2023;186:1729–54. doi: 10.1016/j.cell.2023.02.014. - DOI - PMC - PubMed
    1. Gong J, Hendifar A, Tuli R, et al. Combination systemic therapies with immune checkpoint inhibitors in pancreatic cancer: overcoming resistance to single-agent checkpoint blockade. Clin Transl Med. 2018;7:32. doi: 10.1186/s40169-018-0210-9. - DOI - PMC - PubMed

Substances