. 2024 Nov 27;38(21-24):1033-1046.
doi: 10.1101/gad.352181.124.

Evidence for dual roles of histone H3 lysine 4 in antagonizing Polycomb group function and promoting target gene expression

Affiliations

Evidence for dual roles of histone H3 lysine 4 in antagonizing Polycomb group function and promoting target gene expression

Cyril S Anyetei-Anum et al. Genes Dev. .

Abstract

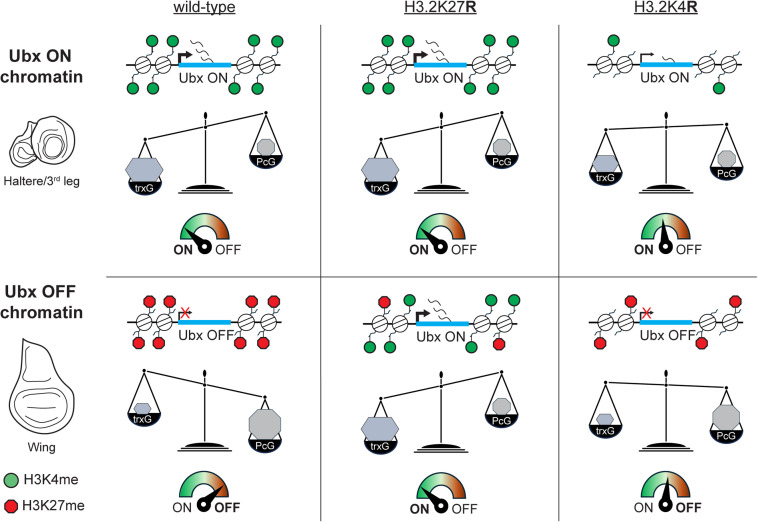
Tight control over cell identity gene expression is necessary for proper adult form and function. The opposing activities of Polycomb and trithorax complexes determine the on/off state of cell identity genes such as the Hox factors. Polycomb group complexes repress target genes, whereas trithorax group complexes are required for their expression. Although trithorax and its orthologs function as methyltransferases specific to histone H3 lysine 4 (H3K4), there is no direct evidence that H3K4 regulates Polycomb group target genes in vivo. Using histone gene replacement in Drosophila, we provide evidence of two key roles for replication-dependent histone H3.2K4 in Polycomb target gene control. First, we found that H3.2K4 mutants mimic H3.2K4me3 in antagonizing methyltransferase activity of the PRC2 Polycomb group complex. Second, we found that H3.2K4 is also required for proper activation of Polycomb targets. We conclude that H3.2K4 directly regulates Polycomb target gene expression.

Keywords: Drosophila; chromatin; epigenetic gene regulation; histone mutation.


Figures

Figure 1.
Figure 1.
H3.2K4 is required for completion of development. (A) Schematic of the histone gene replacement chromosomes. ΔHisC represents deletion of the endogenous replication-dependent histone genes. The H3.2WT (blue circle) and H3.2K4R (green circle) transgenes are shown. (B) Bar plot of adult viability for the indicated genotypes, plotted as percent of expected frequencies based on Mendelian ratios. (*) P < 0.05 (χ2 test). (C) Bar plot of embryonic viability for the indicated genotypes. The histone replacement transgenes were inherited maternally. Error bars indicate ±SEM. (*) P < 0.05 (Student's t-test). (D) Comparison of H3.2WT and H3.2K4R larvae. Scale bar, 1 mm. The histone replacement transgene was inherited paternally. (E) Image of H3.2WT and H3.2K4R cuticles. The inset is highlighted by a yellow box. Scale bar, 20 µm. (FH) Western blots of H3K4me1 (F), H3K4me2 (G), and H3K4me3 (H) from 16–18 h old H3.2WT and H3.2K4R embryos. Bar plots depict average fold change in H3K4me signal normalized to total protein and plotted relative to H3.2WT. Error bars represent ±SEM. At least three biological replicates were performed for Western blots. (IK) Confocal images of H3.2WT and H3.2K4R mitotic clones in wing imaginal discs stained for DAPI (gray); H3K4me1 (I), H3K4me2 (J), or H3K4me3 (K) (red); and GFP (cyan). Merge includes H3K4me and GFP signals. The dashed line outlines the clone, highlighted by yellow arrows. Scale bar, 20 µm.
Figure 2.
Figure 2.
H3.2K4R replacement cells show decreased H3K27me2/3. (A,B) Confocal images of H3.2WT and H3.2K4R mitotic clones in wing imaginal discs stained for DAPI (gray), H3K27me2 (A) or H3K27me3 (B) (red), and GFP (cyan). Merge includes H3K27me and GFP signals. The dashed line outlines the clone, highlighted by yellow arrows. Scale bar, 20 µm. (C) Western blot of H3K27me3 from 16–18 h old H3.2WT and H3.2K4R embryos. Bar plot depicts average fold change in H3K27me3 signal normalized to total protein and plotted relative to H3.2WT. Error bars represent ±SEM. Three biological replicates were performed. (D) Bar plot of average in vitro methylation signal for three concentrations of PRC2 on unmodified H3.2, H3.2K4me3, H3.2K4R, and H3.2K4A peptides (amino acids 1–43). Methylation activity is measured in femtomoles (fmol). Error bars indicate ±SEM. (*) P < 0.05, (**) P < 0.005, (***) P < 0.0005 (Student's t-test). (E) Molecular modeling of interactions with the Caf1-55 binding pocket (gray) upon H3.2 lysine 4 methylation or mutation (red), based on PDB accession number 2YBA.
Figure 3.
Figure 3.
Repression of Polycomb group target genes is not impaired in H3.2K4R cells despite low H3K27me3 levels. (A) Confocal images of H3.2WT, H3.2K27R, H3.2K36R, H3.2K4R, and H3.2K27R/WT mitotic clones in wing imaginal discs stained for DAPI (gray), H3K27me3 (red), GFP (cyan), and Ubx (blue). Merge includes H3K27me3, GFP, and Ubx signals. The dashed line outlines the clone, highlighted by yellow arrows. Scale bar, 20 µm. (B,C) Box plots of H3K27me3 (B) and Ubx (C) signal for the indicated genotypes, plotted as the ratio of signal inside the clone normalized to signal outside the clone, plotted relative to H3.2WT. The box represents the interquartile range (IQR). The horizontal line indicates the median. Whiskers extend to the smallest and largest values within 1.5 times the IQR. Pairwise comparisons between all genotypes are statistically significant in B. Pairwise comparisons between H3.2K27R or H3.2K4R,K27R and all other genotypes are statistically significant in C. P < 0.05 (Student's t-test) (Supplemental Table S2). (D) Bar plot of the fraction of clones that derepress Ubx for the indicated genotypes.
Figure 4.
Figure 4.
H3.2K4 promotes activation of Polycomb group target genes. (A,C,E,G,H) Confocal images of H3.2K27R, H3.2K4R,K27R, H3.2WT, and H3.2K4R mitotic clones in wing imaginal discs stained for DAPI (gray), GFP (cyan), and Abd-B (A), Abd-A (C), Ubx (E), and En (H) (red). A haltere imaginal disc is shown in G, with the inset highlighted by a yellow box. Scale bar (all panels), 20 µm. Merge includes cyan and red channels. The dashed line outlines the clone, highlighted by yellow arrows. (B,D,F) Box plots of Abd-B (B), Abd-A (D), and Ubx (F) signal for H3.2K27R or H3.2K4R,K27R, plotted as the ratio of signal inside the clone normalized to signal outside the clone, plotted relative to H3.2K27R. The box represents the IQR. The horizontal line indicates the median. Whiskers extend to the smallest and largest values within 1.5 times the IQR. (*) P < 0.05 (Student's t-test).
Figure 5.
Figure 5.
Proposed model of the dual roles of H3K4 in antagonizing PRC2 activity and promoting Polycomb group target gene expression. A cartoon depicting regulation of Ubx, which is expressed in haltere and T3 leg imaginal discs (top row) but repressed by PcG in wing imaginal discs (bottom row).

Update of

References

    1. Barbour H, Daou S, Hendzel M, Affar EB. 2020. Polycomb group-mediated histone H2A monoubiquitination in epigenome regulation and nuclear processes. Nat Commun 11: 5947. 10.1038/s41467-020-19722-9 - DOI - PMC - PubMed
    1. Beuchle D, Struhl G, Müller J. 2001. Polycomb group proteins and heritable silencing of Drosophila Hox genes. Development 128: 993–1004. 10.1242/dev.128.6.993 - DOI - PubMed
    1. Breen TR, Harte PJ. 1993. Trithorax regulates multiple homeotic genes in the bithorax and Antennapedia complexes and exerts different tissue-specific, parasegment-specific and promoter-specific effects on each. Development 117: 119–134. 10.1242/dev.117.1.119 - DOI - PubMed
    1. Cifuentes-Rojas C, Hernandez AJ, Sarma K, Lee JT. 2014. Regulatory interactions between RNA and polycomb repressive complex 2. Mol Cell 55: 171–185. 10.1016/j.molcel.2014.05.009 - DOI - PMC - PubMed
    1. Coleman RT, Struhl G. 2017. Causal role for inheritance of H3K27me3 in maintaining the off state of a Drosophila HOX gene. Science 356: eaai8236. 10.1126/science.aai8236 - DOI - PMC - PubMed

MeSH terms