. 2024 Dec;68(24):e2400662.
doi: 10.1002/mnfr.202400662. Epub 2024 Nov 19.

Pterostilbene Targets Hallmarks of Aging in the Gene Expression Landscape in Blood of Healthy Rats

Affiliations

Pterostilbene Targets Hallmarks of Aging in the Gene Expression Landscape in Blood of Healthy Rats

Marco A Tello-Palencia et al. Mol Nutr Food Res. 2024 Dec.

Abstract

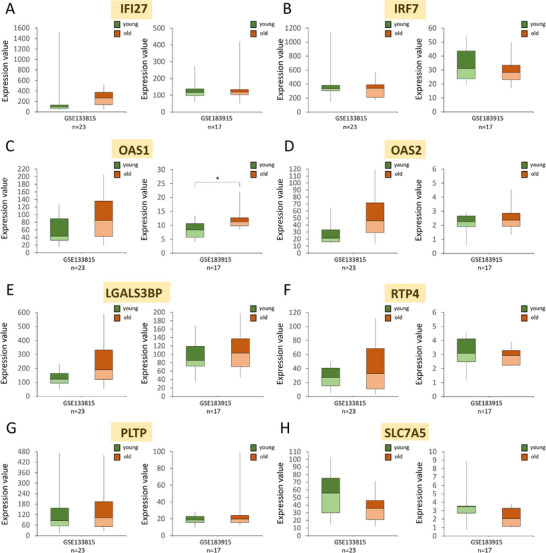
Scope: Polyphenols from the phytoestrogen group, including pterostilbene (PTS), are known for their antioxidant, anti-inflammatory, and anti-cancer effects. In recent reports, phytoestrogens attenuate age-related diseases; however, their pro-longevity effects in healthy models in mammals remain unknown. As longevity research demonstrates age-related transcriptomic signatures in human blood, the current study hypothesizes that phytoestrogen-supplemented diet may induce changes in gene expression that ultimately confer pro-longevity benefits.

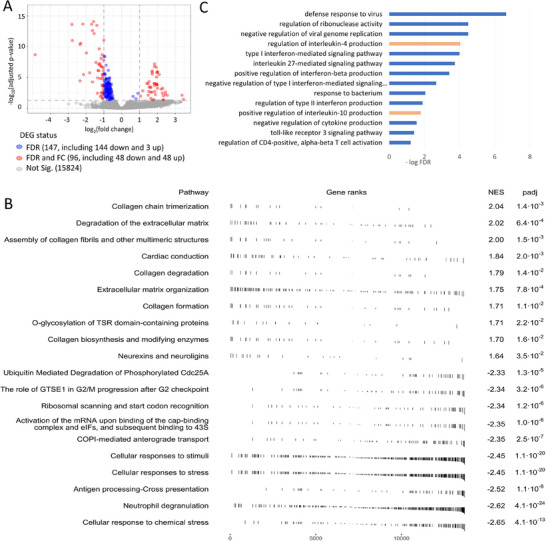
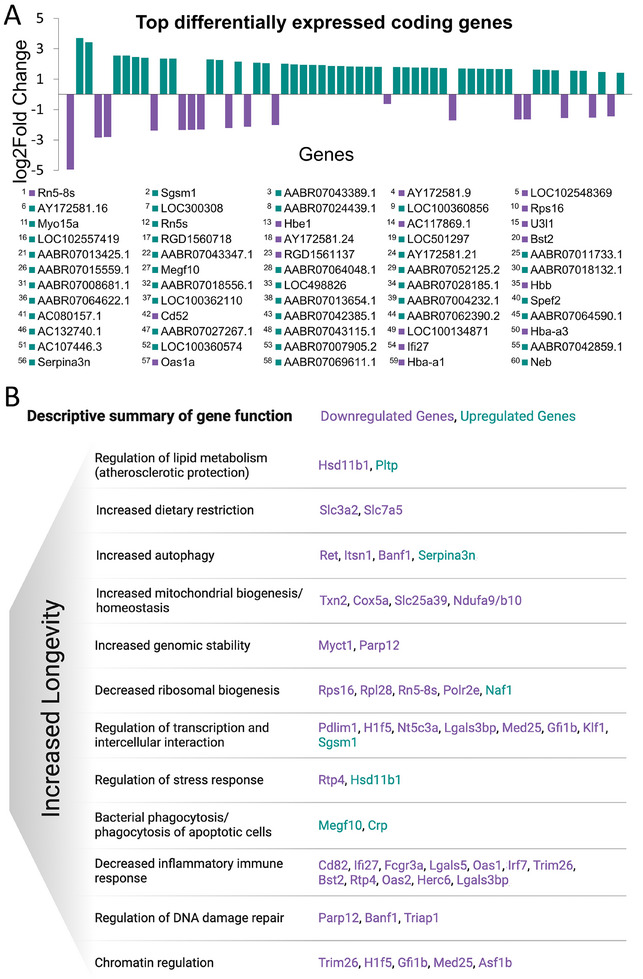
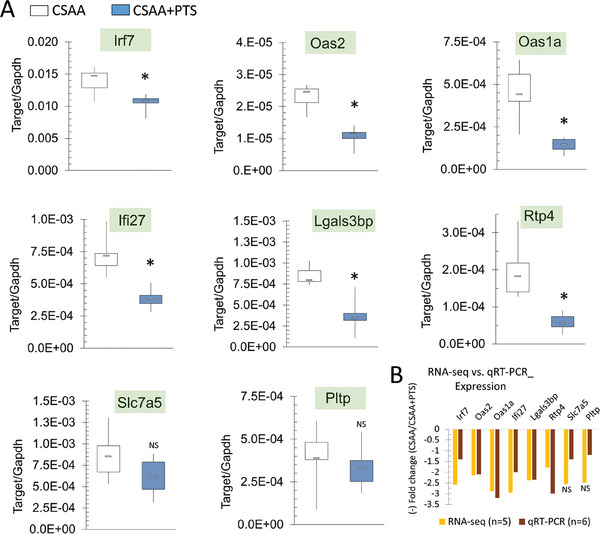
Methods and results: In the present study, RNA sequencing is conducted to determine transcriptome-wide changes in gene expression in whole blood of healthy rats consuming diets supplemented with phytoestrogens. Ortholog cell deconvolution is applied to analyze the omics data. The study discovered that PTS leads to changes in the gene expression landscape and PTS-target genes are associated with functions counteracting hallmarks of aging, including genomic instability, epigenetic alterations, compromised autophagy, mitochondrial dysfunction, deregulated nutrient sensing, altered intercellular interaction, and loss of proteostasis. These functions bridge together under anti-inflammatory effects through multiple pathways, including immunometabolism, where changes in cellular metabolism (e.g., ribosome biogenesis) impact the immune system.

Conclusion: The findings provide a rationale for pre-clinical and clinical longevity studies and encourage investigations on PTS in maintaining cellular homeostasis, decelerating the process of aging, and improving conditions with chronic inflammation.

Keywords: aging; blood; gene expression; polyphenols; transcriptomics.


Conflict of interest statement

The authors declare no conflict of interest.

Figures

Figure 1
Figure 1
Ortholog cell deconvolution results. A) Volcano plot for deconvoluted differential expression results. Red dots show differentially expressed genes (DEGs), defined by an absolute fold change greater than two, and an adjusted p‐value below the significance threshold of ≤0.05 Genes shown in blue met the significance threshold but their change in expression was 2‐fold or below. In grey, genes that did not meet the significance threshold. We can observe an overall trend for reduced expression in the PTS supplemented diet. B) Gene set enrichment analysis showing the top enriched Reactome pathways in the results from the differential expression analysis. C) Significant Gene Ontology (GO) terms associated with differentially expressed genes in blood of rats on a diet supplemented with PTS. Only “Regulation of IL‐4 and IL‐10 production” terms are associated with upregulated genes (pink color); all other terms are liked to downregulated genes (blue color). GO analysis was performed using PANTHER database.[ 23 ]
Figure 2
Figure 2
Transcriptomic changes in blood of rats exposed to pterostilbene (PTS)‐supplemented diet. A) Fold change values, expressed as log2(Fold Change), for the top 60 differentially expressed genes (DEGs) in PTS‐supplemented rats as compared to CSAA rats. Violet color corresponds to downregulated genes (negative value) whereas upregulated genes are marked in turquoise (positive value). Genes are numbered from the highest to the lowest (|log2(FC)| value. B) A descriptive summary of functions associated with differentially expressed genes (PTS‐target genes, fold change ≥1.5), as assessed by a literature search in PubMed. Functions associated with at least two genes are depicted. Downregulated genes are in violet and upregulated genes are in turquoise. The picture was created in BioRender.
Figure 3
Figure 3
Quantitative validation of transcriptomic changes in blood of rats exposed to pterostilbene (PTS)‐supplemented diet for the selected PTS‐target genes. A) Downregulation of Irf7, Oas2, Oas1a, Ifi27, Lgals3 bp, Rtp4, Slc7a5, and Pltp in PTS‐supplemented group of rats (CSAA+PTS) versus CSAA control group, as measured by qRT‐PCR. All results expressed in a boxplot as min, IQR, and max of target/Gapdh; n = 6 per group; *p < 0.05. Statistical analysis of qRT‐PCR was performed using Mann–Whitney U test. B) Fold‐change in expression values (CSAA+PTS/CSAA) for the selected PTS‐target genes as measured by RNA‐seq (n = 5) or qRT‐PCR (n = 6). Fold change is shown as a negative value to reflect downregulation of the selected genes in CSAA+PTS versus CSAA.
Figure 4
Figure 4
Expression of selected PTS‐target genes in human liver tissue from healthy individuals in different age groups. A‐H) Expression of the selected PTS‐target genes in young (<49 years of age) versus older (>74 years of age) adults, based on the Affymetrix array (GSE133815) and RNA sequencing (GSE183915) from publicly available datasets in the Gene Expression Omnibus (GEO) database. Results expressed as min, IQR, and max of the array intensity or RNA‐seq value (expression value); *p < 0.05. Patient characteristics corresponding to the data are depicted in Table S3, Supporting Information.
Figure 5
Figure 5
Expression of IFI27, IRF7, OAS1, and OAS2 in human liver tissues from healthy individuals and patients with steatosis or non‐alcoholic steatohepatitis (NASH). A–D) Expression of IFI27, IRF7, OAS1, and OAS2 in the liver of healthy individuals (Normal) and patients with steatosis or NASH, based on the Affymetrix, Illumina, or CodeLink Human Whole Genome array data from publicly available datasets in the Gene Expression Omnibus (GEO) database. Results expressed as min, IQR, and max of the array intensity (expression value); *p < 0.05; #adjusted p < 0.05. Patient characteristics corresponding to the data are depicted in Table S4, Supporting Information.
Figure 6
Figure 6
Expression of LGALS3BP, RTP4, PLTP, and SLC7A5 in human liver tissues from healthy individuals and patients with steatosis or non‐alcoholic steatohepatitis (NASH). A–D) Expression of LGALS3BP, RTP4, PLTP, and SLC7A5 in the liver of healthy individuals (Normal) and patients with steatosis or NASH, based on the Affymetrix, Illumina or CodeLink Human Whole Genome array data from publicly available datasets in the Gene Expression Omnibus (GEO) database. Results expressed as min, IQR, and max of the array intensity (expression value); *p < 0.05; #adjusted p < 0.05. Patient characteristics corresponding to the data are depicted in Table S4, Supporting Information.

Similar articles

Cited by

References

    1. Beetch M., Harandi‐Zadeh S., Shen K., Lubecka K., Kitts D. D., O'Hagan H. M., Stefanska B., Br. J. Pharmacol. 2020, 177, 1382. - PMC - PubMed
    1. Nishiyama A., Nakanishi M., Trends Genet. 2021, 37, 1012. - PubMed
    1. Medina‐Aguilar R., Perez‐Plasencia C., Marchat L. A., Gariglio P., Garcia Mena J., Rodriguez Cuevas S., Ruiz‐Garcia E., Astudillo‐de la Vega H., Hernandez Juarez J., Flores‐Perez A., Lopez‐Camarillo C., PLoS One 2016, 11, e0157866. - PMC - PubMed
    1. Beetch M., Boycott C., Harandi‐Zadeh S., Yang T., Martin B. J. E., Dixon‐McDougall T., Ren K., Gacad A., Dupuis J. H., Ullmer M., Lubecka K., Yada R. Y., Brown C. J., Howe L. J., Stefanska B., J. Nutr. Biochem. 2021, 98, 108815. - PMC - PubMed
    1. Zhou D. D., Luo M., Huang S. Y., Saimaiti A., Shang A., Gan R. Y., Li H. B., Oxid. Med. Cell. Longev. 2021, 2021, 9932218. - PMC - PubMed