. 2024 Nov 23;100(12):fiae156.
doi: 10.1093/femsec/fiae156.

Environmental factors and potential probiotic lineages shape the active prokaryotic communities associated with healthy Penaeus stylirostris larvae and their rearing water

Affiliations

Environmental factors and potential probiotic lineages shape the active prokaryotic communities associated with healthy Penaeus stylirostris larvae and their rearing water

Carolane Giraud et al. FEMS Microbiol Ecol. .

Abstract

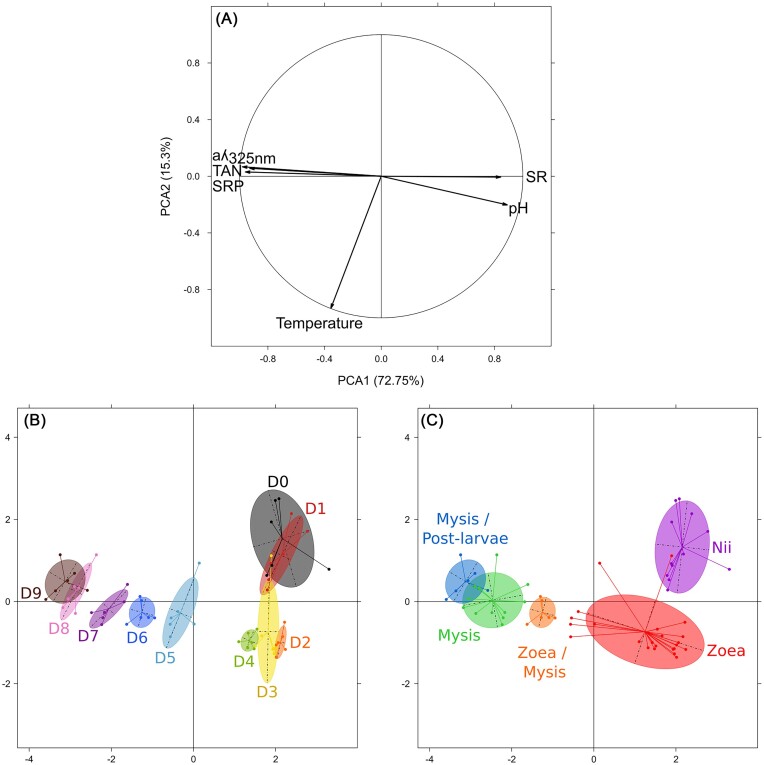
Microbial dysbiosis is hypothesized to cause larval mass mortalities in New Caledonian shrimp hatcheries. In order to confirm this hypothesis and allow further microbial comparisons, we studied the active prokaryotic communities of healthy Penaeus stylirostris larvae and their surrounding environment during the first 10 days of larval rearing. Using daily nutrient concentration quantitative analyses and spectrophotometric organic matter analyses, we highlighted a global eutrophication of the rearing environment. We also evidenced drastic bacterial community modifications in the water and the larvae samples using Illumina HiSeq sequencing of the V4 region of the 16S rRNA gene. We confirmed that Alteromonadales, Rhodobacterales, Flavobacteriales, Oceanospirillales, and Vibrionales members formed the core bacteriota of shrimp larvae. We also identified, in the water and the larvae samples, several potential probiotic bacterial strains that could lead to rethink probiotic use in aquaculture (AEGEAN 169 marine group, OM27 clade, Ruegeria, Leisingera, Pseudoalteromonas, and Roseobacter). Finally, investigating the existing correlations between the environmental factors and the major bacterial taxa of the water and the larvae samples, we suggested that deterministic and stochastic processes were involved in the assembly of prokaryotic communities during the larval rearing of P. stylirostris. Overall, our results showed that drastic changes mostly occurred during the zoea stages suggesting that this larval phase is crucial during shrimp larval development.

Keywords: active bacteriota; commensal microorganisms; environmental factors; probiotics; shrimp larval rearing.


Conflict of interest statement

None declared.

Figures

Figure 1.
Figure 1.
Water treatments and larval rearing process. Natural lagoon seawater was pumped, treated, and used to fill (A) the hatching tanks and (B) the rearing tanks. (C) Larval rearing cycles started when nauplii (Nii) were added to the rearing tanks after ethylenediaminetetraacetic acid (EDTA) addition on Day 0 (D0). On Day 4 (D4), 70 ppm of oxytetracycline (OTC) were added to the rearing tanks. Daily OTC doses were reduced to 17 ppm from Day 5 (D5) to Day 9 (D9). On Day 1 (D1), larvae were at nauplius stage (Nii) and were fed with a first type of microparticle (F1). From Day 2 (D2) to Day 4 (D4), larvae were at zoea 1 (Z1) and zoea 2 (Z2) stages and were fed with a second type of microparticle (F2). On Days 5 and 6 (D5 and D6), larvae were at stages zoea 3 (Z3) and mysis 1 (M1) and were fed with a third type of microparticle (F3). From Day 7 (D7) to Day 9 (D9), larvae were at mysis 1, 2, 3 (M1, M2, M3) and post-larvae (PL) stage and were fed with a fourth type of microparticle (F4). Microparticles were supplemented with frozen Artemias sp. from Day 4 (D4) to Day 9 (D9).
Figure 2.
Figure 2.
Heatmap of all zootechnical and physicochemical parameters in the rearing and the control tanks. (A) LSR and (B) LSI in all the rearing tanks (larval rearing cycle A: A1, A2, A3, larval rearing cycle B: B1, B2, B3) from Day 0 (D0) to Day 9 (D9). As no larvae were added to the control (Ctrl) tank, no LSR or LSI were calculated. (C) Temperature, (D) total ammonia nitrogen (TAN) concentration, (E) SRP concentration, (F) CDOM concentration (aλ325 nm), (G) pH, and (H) SR values in the rearing and the control tanks from D0 to D9. .
Figure 3.
Figure 3.
Standardized Principal Component Analysis (PCA) of the physicochemical parameters in the rearing water of all the samples from Day 0 (D0) to Day 9 (D9). (A) Correlation circle of the physicochemical parameters measured in the rearing tanks throughout the whole rearing cycles. SRP concentration, total ammonia nitrogen (TAN) concentration, CDOM concentration (aλ325 nm), SR, pH and temperature, values were considered. (B and C) Visual representation of the samples according to their physicochemical composition. (B) Samples are clustered by rearing day, from Day 0 (D0) to Day 9 (D9). (C) Samples are clustered by larval stage, from nauplii (Nii) to post-larvae stage.
Figure 4.
Figure 4.
Clustering and global microbial composition of the water and the larvae samples. Two larval rearing cycles were analyzed during the experiment and are indicated as A and B. (A) Hierarchical clustering based on a Bray–Curtis dissimilarity matrix and the Ward method groups the water, the larvae, the egg, and the control (Ctrl) samples in 7 clusters (C1–C7) when considering a threshold of 3 represented by the black dotted line. Each sample type is represented by a colored circle and rearing days are noted under the circles. (B) Ordination of the control (Ctrl) and the water samples based on the PCoA method and a Bray–Curtis dissimilarity matrix. (C) Ordination of the egg and the larvae samples based on the PCoA method and a Bray–Curtis dissimilarity matrix. In Fig. 4B and C, clusters are represented by black circles. (E) Histogram of the 11 bacterial orders with a relative abundance higher than 1% in the control and the water samples. (D) Histogram of the 12 bacterial orders with a total relative abundance higher than 1% in the egg and the larvae samples. In Fig. 4D and E, all orders with a relative abundance lower than 1% are summed in the “Other” category. In Fig. 4B–E, all rearing days are indicated by the letter D followed by the number of the rearing day (from 0 to 9).
Figure 5.
Figure 5.
Differentially abundant ASVs in all the rearing water samples (larval rearing cycles A and B) according to their rearing day and relative abundance of these ASVs in all the samples. (A) Linear discriminant analysis (LDA) effect size (LEfSe) showing ASVs significantly more abundant in the rearing water samples according to their rearing day, from Day 0 (D0) to Day 9 (D9). For each ASV, the lowest phylogenetic level reached for affiliation is specified in brackets. (B) Relative abundance of the ASVs highlighted by the LEfSe in all the samples prior to the rearing day during which they had been identified. For all the samples, the mean relative abundance per sample type is represented. The water and the larvae samples are respectively designated by W and L. The relative abundances of the ASVs in the LS, the DR, and the rearing reservoir are averaged in RR. The samples collected from the hatching reservoir for the larval rearing cycles A and B are averaged in HR. Food types, microparticle mixes, and Artemias sp. larvae, are respectively represented by Fx (with x from 1 to 4) and Artemias.
Figure 6.
Figure 6.
Differentially abundant ASVs in all the egg and the larvae samples (larval rearing cycles A and B) according to their larval stage and relative abundance of these ASVs in all the samples. (A) Linear Discriminant Analysis (LDA) Effect Size (LEfSe) showing ASVs significantly more abundant in the egg and the larvae samples according to their larval stage: egg, nauplii (nii), zoea 1 (Z1), zoea 2 (Z2), zoea 3 (Z3), mysis 1 (M1), mysis 2 (M2), mysis 3 (M3), and post-larvae (PL). For each ASV, the lowest phylogenetic level reached for affiliation is specified in brackets. (B) Relative abundance of the ASVs highlighted by the LEfSe in all the samples prior to the larval stage in which they had been identified. For all the samples, the mean relative abundance per sample type is represented. The larvae and the water samples are respectively designated by L and W. The samples collected from the hatching reservoir for the larval rearing cycles A and B are averaged in HR. The relative abundances of the ASVs in the LS, the DR, and the rearing reservoir are averaged in RR. Food types, microparticle mixes, and Artemias sp. larvae, are respectively represented by Fx (with x from 1 to 4) and Artemias.
Figure 7.
Figure 7.
Pearson correlations between the microbial biomarkers and the physicochemical parameters of the rearing water. Correlations between the physicochemical parameters of the rearing water: temperature (Temp), total ammonia nitrogen (TAN) concentration, SRP concentration, CDOM concentration (aλ325 nm), pH, and SR values were considered and the microbial biomarkers highlighted by the LEfSe analyses in (A) the water samples and (B) the larvae samples. Rearing days are represented by the letter D followed by the considered rearing day (from 0 to 9). Larval developmental stages are designated as follows: nauplii (Nii), zoea 1 (Z1), zoea 2 (Z2), zoea 3 (Z3), mysis 1 (M1), mysis 2 (M2), mysis 3 (M3), and post-larvae (PL). Significant results are designated by an asterisk symbol: P-values comprised from 0.01 to 0.05 are represented by *, P-values comprised from 0.001 to 0.009 by **, and P-values below 0.0009 by ***.
Figure 8.
Figure 8.
Enriched microbial lineages and their correlation with environmental factors. Enriched microbial lineages (up to the genus when possible) evidenced by the LEfSe in the water samples (in blue) and in the larvae samples (in orange). Environmental factors significantly correlated with these microbial lineages are noted in blue (negative correlations) or in red (positive correlations). Temperature (T°C), Total Ammonia Nitrogen (TAN), SRP, CDOM (aλ325 nm), pH, and SR were considered. Microbial lineages noted in gray boxes were not correlated with the considered environmental factors. Taxa in bold represent potential probiotic strains.

References

    1. Agence Rurale NC . 2021. https://agence-rurale.nc/filieres/peche-et-aquaculture/crevettes/ ( 9 January 2024, date last accessed).
    1. Amoah K, Huang QC, Dong XH et al. Paenibacillus polymyxa improves the growth, immune and antioxidant activity, intestinal health, and disease resistance in Litopenaeus vannamei challenged with Vibrio parahaemolyticus. Aquaculture. 2020;518:734563. 10.1016/j.aquaculture.2019.734563. - DOI
    1. Aragno M. Responses of microorganisms to temperature. In: Lange OL, Nobel OS, Osmond CB, et al. (eds.), Physiological Plant Ecology I. Encyclopedia of Plant Physiology. Vol 12. Berlin, Heidelberg, New York: Springer, 1981, pp 339–69. 10.1007/978-3-642-68090-8_12. - DOI
    1. Bakke I, Coward E, Andersen T et al. Selection in the host structures the microbiota associated with developing cod larvae (Gadus morhua). Environ Microbiol. 2015;17:3914–24. 10.1111/1462-2920.12888. - DOI - PubMed
    1. Balcázar JL, Blas Id, Ruiz-Zarzuela I et al. The role of probiotics in aquaculture. Vet Microbiol. 2006;114:173–86. 10.1016/j.vetmic.2006.01.009. - DOI - PubMed

Substances

Grants and funding