Review
. 2024:40:685-723.
doi: 10.1007/978-3-031-69491-2_23.

Categorical and Dimensional Approaches for Psychiatric Classification and Treatment Targeting: Considerations from Psychosis Biotypes

Affiliations
Review

Categorical and Dimensional Approaches for Psychiatric Classification and Treatment Targeting: Considerations from Psychosis Biotypes

Brett A Clementz et al. Adv Neurobiol. 2024.

Abstract

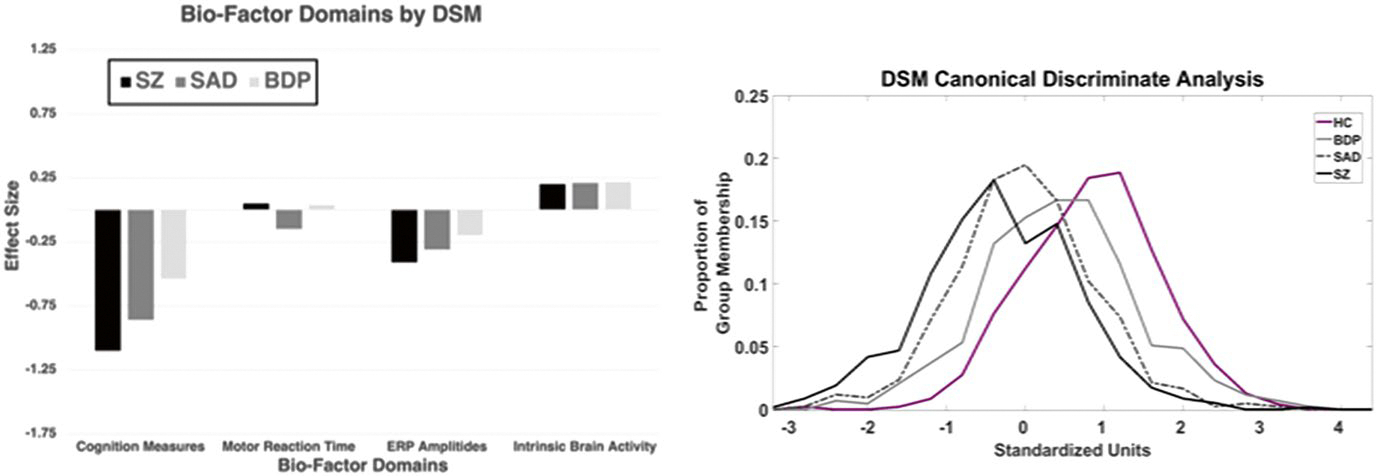
Categorical diagnosis, a pillar of the medical model, has not worked well in psychiatry where most diagnoses are still exclusively symptom based. Uncertainty continues about whether categories or dimensions work better for the assessment and treatment of idiopathic psychoses. The Bipolar Schizophrenia Network for Intermediate Phenotypes (B-SNIP) examined multiple cognitive and electrophysiological biomarkers across a large transdiagnostic psychosis data set. None of the variables supported neurobiological distinctiveness for conventional clinical psychosis diagnoses but showed a continuum of severity. Using numerical taxonomy of these data, B-SNIP identified three biological subtypes (Biotypes) agnostic to DSM diagnoses. Biotype-1 is characterized by reduced physiological response to salient stimuli, while Biotype-2 showed accentuated intrinsic (background or ongoing) neural activity and the worst inhibition. Biotype-3 cases are like healthy persons on many laboratory measures. These Biotypes differed in imaging and other electrophysiological measures not included in subgroup creation, illustrating external validation. The Biotypes solution also replicated in an independent sample of psychosis cases. Biotypes are differentiable by clinical characteristics, leading to a feasible algorithm for Biotype estimates. Identifying Biotypes may aid treatment selection and outcome prediction. As an example, preliminary cross-sectional B-SNIP data suggest that Biotype-1 cases may have physiological features that predict a more favorable response to clozapine. While psychosis Biotypes reveal physiological heterogeneity across cases with similar clinical characteristics, data also suggest a dimensional vulnerability for serious psychopathology that cuts across diagnostic boundaries. Both categorical and dimensional diagnostic approaches should be considered within idiopathic psychosis for optimum diagnosis, care, and research.

Keywords: Biotypes; Categorical; Classification; Cognition; Dimensional; Physiology; Psychosis.


Figures

Fig. 1
Fig. 1
DSM Diagnoses. Left Plot: Glass effect sizes (y-axis) of the main bio-factor domains (x-axis) as a function of DSM psychosis diagnosis. The community sample is represented by the zero line. The Cognition Measures are an average of BACS, antisaccade, and stop signal variables, Motor Reaction Time is speed of responding to saccade targets, ERP Amplitudes are an average of measures indexing strength of neural response to auditory stimuli, and Intrinsic Brain Activity is an average of measures capturing nonspecific brain activity (not locked to processing of any stimulus). Right Plot: The outcome of a discriminant analyses to maximize group separation using all bio-factors. There was one significant function that differentiated the groups. The plot shows the proportion of cases within each group (y-axis) as a function of their standardized discriminant function scores (x-axis). SZ schizophrenia, SAD schizoaffective disorder, and BDP bipolar disorder with psychosis, HC community sample. (Adapted from Clementz et al. 2022)
Fig. 2
Fig. 2
Overall structural MRI (top plot) and cognition and neurophysiology (bottom plot) standard scores as a function of cognitive performance. The cognitive dimension is plotting in quintiles by different subject groups (healthy in blue, probands in orange, relatives of probands in yellow). When considering all measures in a set, all groups show declines in both MRI and neurophysiology and cognition from high to low cognitive performance levels. (From Tamminga et al. 2020)
Fig. 3
Fig. 3
Psychosis is a characteristic of schizophrenia, schizoaffective disorder, and bipolar disorder with psychosis, all pathophysiologically complex diagnoses. These clinical diagnoses were not distinguishable by B-SNIP’s extensive biomarker panel. Psychosis subjects, therefore, were combined into a single group, independent of DSM diagnosis, and biomarker variables were used to define subgroups with shared neurobiological variance. Numerical taxonomy (the prism) identified subgroups, called Biotypes-1, -2, and -3. The groups had distinctive neurobiological characteristics, including on variables not used in their definition (called external validators). Neural characteristics as they segregate in these groups could be the basis for distinct molecular and therapeutic targets. (From Supplement in Clementz et al. 2016)
Fig. 4
Fig. 4
Biotypes. Left Plot: Glass effect sizes (y-axis) of the main bio-factor domains (x-axis) as a function of Biotype. The community sample is represented by the zero line. The Cognition Measures are an average of BACS, antisaccade, and stop signal variables, Motor Reaction Time is speed of responding to saccade targets, ERP Amplitudes are an average of measures indexing strength of neural response to auditory stimuli, and Intrinsic Brain Activity is an average of measures capturing nonspecific brain activity (not locked to processing of any stimulus). Right Plot: There were two discriminant functions that differentiated the psychosis Biotype groups. The first function on the x-axis captured “Neural Response Magnitude,” and the second function on the y-axis captured “Neural Disinhibition”. Frequency polygons show the proportion of cases by group at the bottom (Neural Response Magnitude) and right (Neural Disinhibition) of the central plot that shows the centroids and standard deviation ellipses by group. BT1 = Biotype-1, BT2 = Biotype-2, BT3 = Biotype-3; HC = community sample. (Adapted from Clementz et al. 2022)
Fig. 5
Fig. 5
Percent of cases conditioning on an initial group classification. The left plot shows the percent of cases with a particular DSM diagnosis across Biotypes, and the right plot shows the percent of cases with a particular Biotype across DSM diagnoses (e.g., the values within the black SZ line sum to 100; the values within the blue BT1 line sum to 100). BT1 = Biotype-1, BT2 = Biotype-2, BT3 = Biotype-3, SZ = schizophrenia, SAD = schizoaffective disorder, and BDP = bipolar disorder with psychosis. (Adapted from Clementz et al. 2023)
Fig. 6
Fig. 6
MRI measures that deviate from the BANCC pattern. Brain space volumes are plotted by cognitive ability (in quintiles) and subject group (healthy in blue, probands in orange, relatives of probands in yellow). Brain space measures, like ventricular volume, are a set of variables that do not follow the overall pattern displayed in Fig. 11, with especially probands showing a marked deviation from the canonical pattern at the deficit end of cognitive ability. (From Tamminga et al. 2020)
Fig. 7
Fig. 7
EEG measures that deviate from the BANCC pattern. Intrinsic EEG activity (left plot) and ERP magnitudes like N100 and P300 (right plot) are displayed as a function of cognitive ability quintiles and subject group (healthy in blue, probands in orange, relatives of probands in yellow). Intrinsic activity does not follow the canonical pattern of Fig. 11 for any group; ERP magnitude does not follow this pattern for healthy persons, meaning they are able to generate ample ERP responses independent of cognitive ability, giving them an advantage in signal-to-noise ratio over a broader range of cognitive abilities. At the high end of cognitive ability, healthy persons have a decided signal-to-noise advantage given their very low intrinsic activities (blue arrow) in combination with robust neural responses to salient stimuli (black arrow). (From Tamminga et al. 2020)
Fig. 8
Fig. 8
Mismatch negative changes following 16 (V2) and 32 (V3) sensory intervention exposures among Biotype-1 (BT1), a mixed group of Biotype-2 and -3 (BT2/3), and HC (healthy community) participants. Values above zero indicate enhancement
Fig. 9
Fig. 9
The heads plots show a flattened top-down view of EEG alpha activity recorded from 64 sensors arranged around the head. Darker blue (Biotype-1) means weaker and darker red (Biotype-2) means stronger signals. The bar chart shows intrinsic EEG activity on the y-axis for Biotypes-1, -2, and - 3 in relation to healthy level of brain response (at 0 on the y-axis). Biotype groups are separated by those off and on clozapine. There is a main effect of drug. Biotype-1 s on clozapine are at normal level of intrinsic activity. Biotype-2 s on clozapine are dramatically high on intrinsic activity. Biotype-3 s on clozapine are at typical Biotype-2 levels of intrinsic activity deviation

References

    1. Adler LE, Pachtman E, Franks RD, Pecevich M, Waldo MC, Freedman R. Neurophysiological evidence for a defect in neuronal mechanisms involved in sensory gating in schizophrenia. Biol Psychiatry. 1982;17(6):639–54. - PubMed
    1. Alliey-Rodriguez N, Grey TA, Shafee R, Asif H, Lutz O, Bolo NR, Padmanabhan J, Tandon N, Klinger M, Reis K, Spring J, Coppes L, Zeng V, Hegde RR, Hoang DT, Bannai D, Nawaz U, Henson P, Liu S, Gage D, McCarroll S, Bishop JR, Hill S, Reilly JL, Lencer R, Clementz BA, Buckley P, Glahn DC, Meda SA, Narayanan B, Pearlson G, Keshavan MS, Ivleva EI, Tamminga C, Sweeney JA, Curtis D, Badner JA, Keedy S, Rapoport J, Liu C, Gershon ES. NRXN1 is associated with enlargement of the temporal horns of the lateral ventricles in psychosis. Transl Psychiatry. 2019;9(1):230. - PMC - PubMed
    1. Andreasen NC. The diagnosis of schizophrenia. Schizophr Bull. 1987;13(1):9–22. - PubMed
    1. Bassett AS, Chow EW. Schizophrenia and 22q11.2 deletion syndrome. Curr Psychiatry Rep 2008;10(2):148–57. - PMC - PubMed
    1. Begg CB, Zabor EC, Bernstein JL, Bernstein L, Press MF, Seshan VE. A conceptual and methodological framework for investigating etiologic heterogeneity. Stat Med. 2013;32(29):5039–52. - PMC - PubMed

MeSH terms

LinkOut - more resources