. 2024 Nov 19;15(1):10018.
doi: 10.1038/s41467-024-54089-1.

Profiling of insulin-resistant kidney models and human biopsies reveals common and cell-type-specific mechanisms underpinning Diabetic Kidney Disease

Collaborators, Affiliations

Profiling of insulin-resistant kidney models and human biopsies reveals common and cell-type-specific mechanisms underpinning Diabetic Kidney Disease

Abigail C Lay et al. Nat Commun. .

Abstract

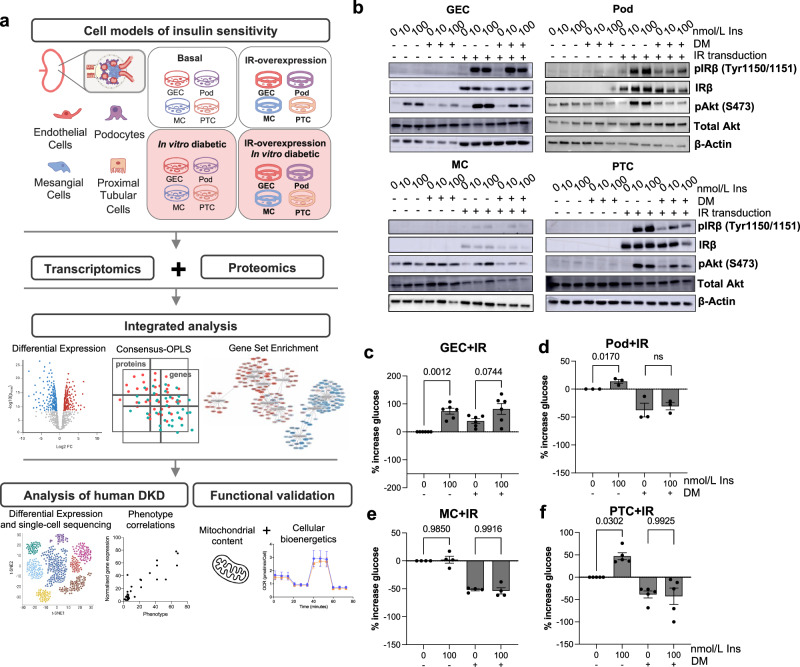
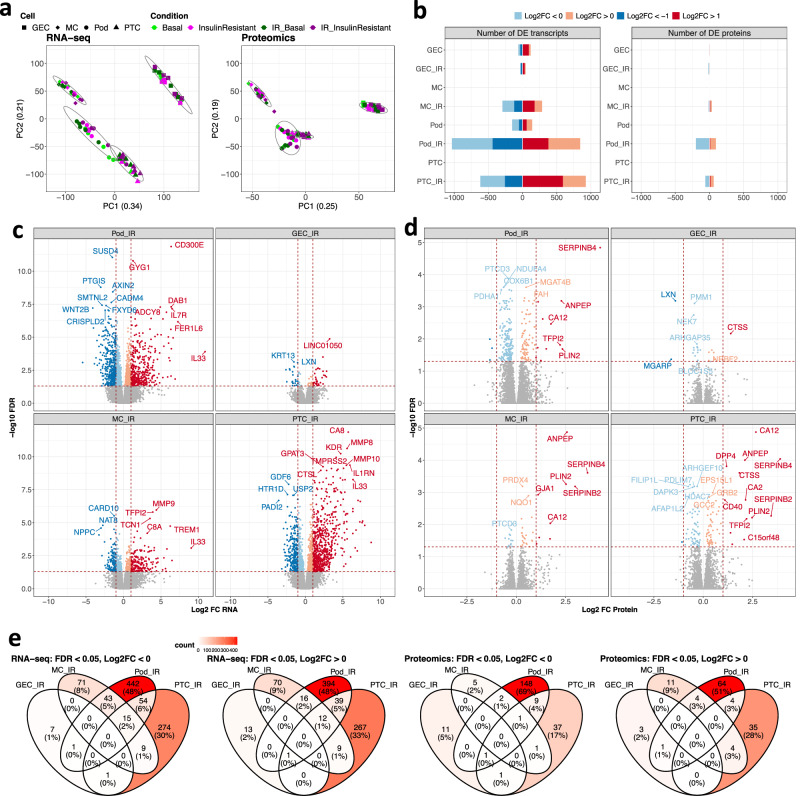
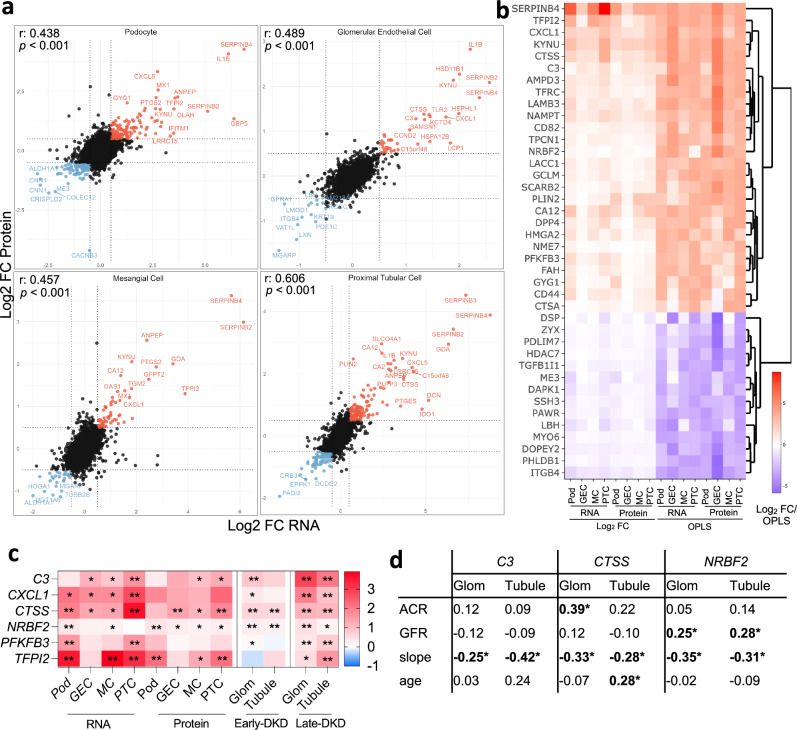
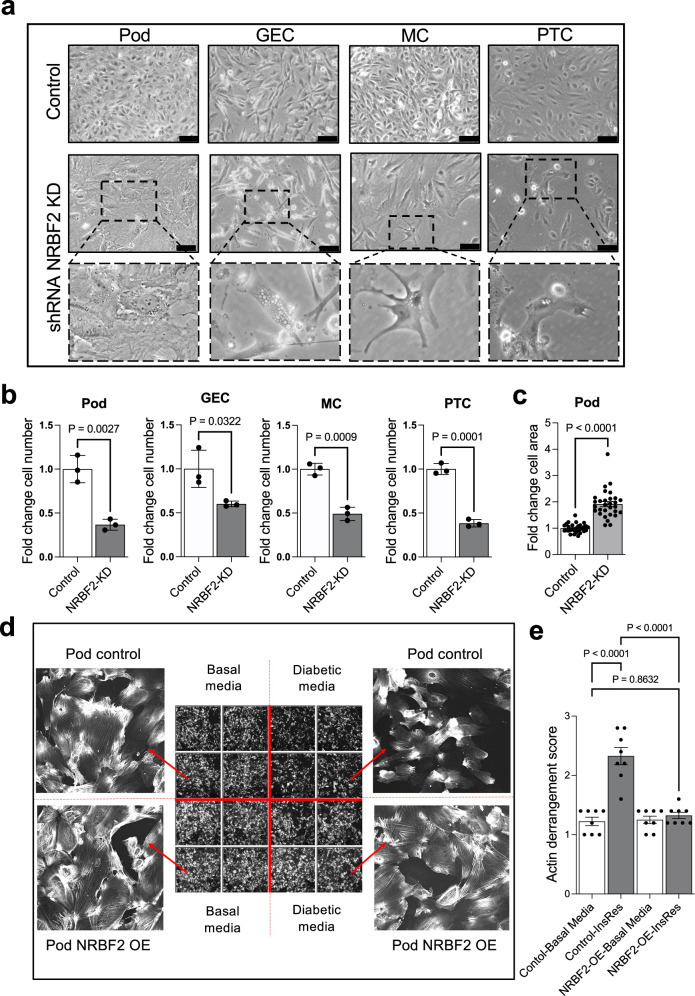
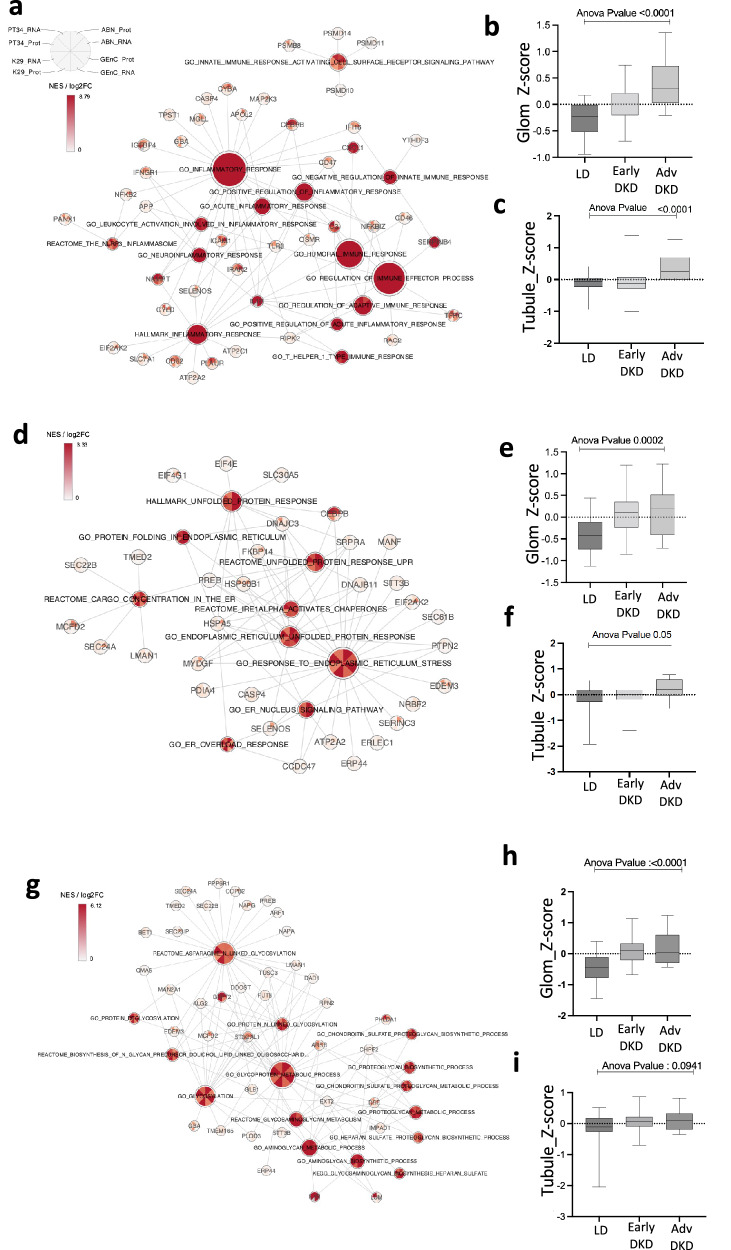
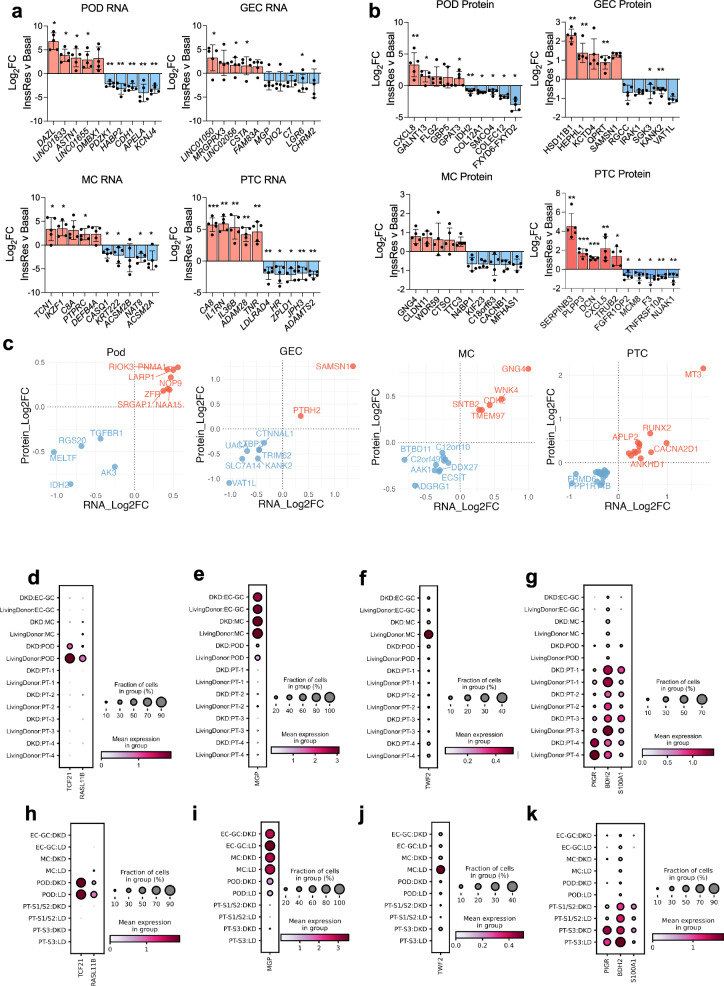
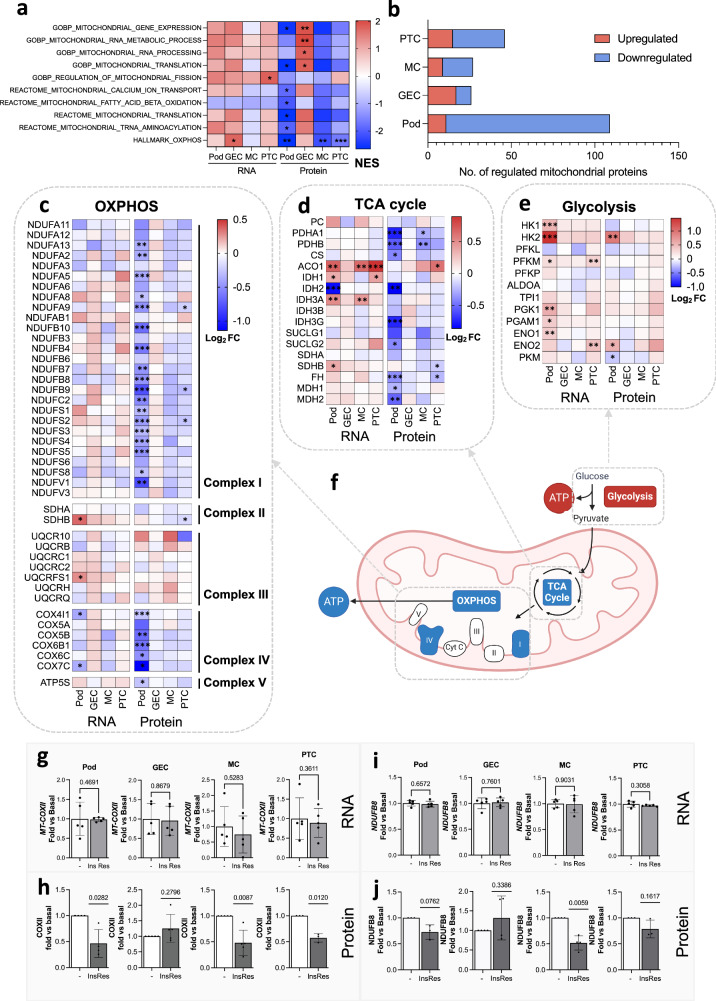
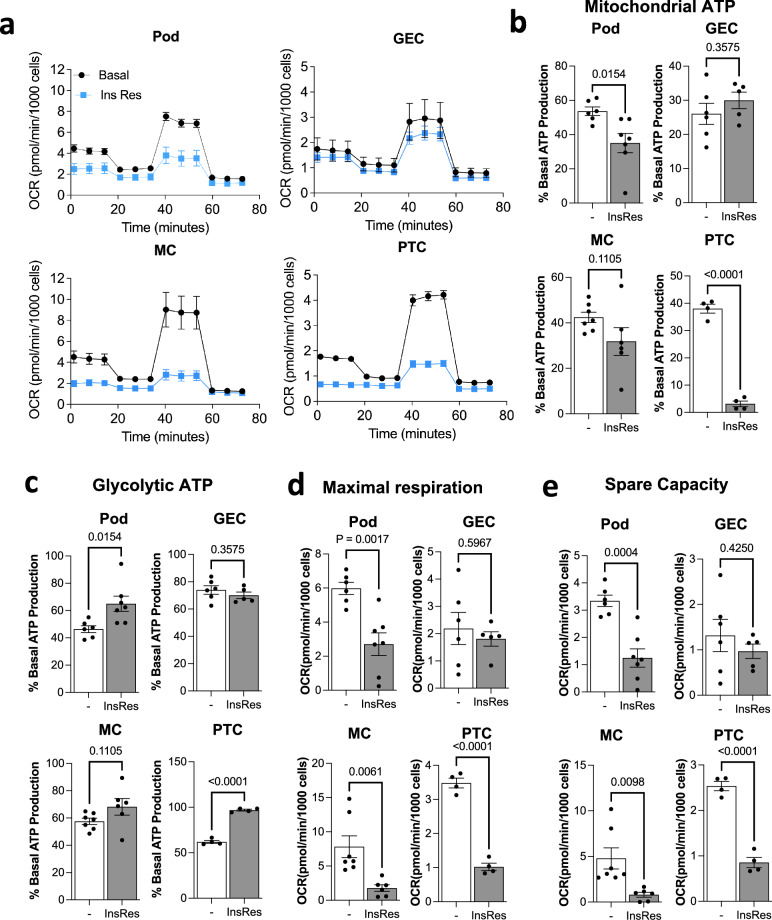
Diabetic kidney disease (DKD) is the leading cause of end stage kidney failure worldwide, of which cellular insulin resistance is a major driver. Here, we study key human kidney cell types implicated in DKD (podocytes, glomerular endothelial, mesangial and proximal tubular cells) in insulin sensitive and resistant conditions, and perform simultaneous transcriptomics and proteomics for integrated analysis. Our data is further compared with bulk- and single-cell transcriptomic kidney biopsy data from early- and advanced-stage DKD patient cohorts. We identify several consistent changes (individual genes, proteins, and molecular pathways) occurring across all insulin-resistant kidney cell types, together with cell-line-specific changes occurring in response to insulin resistance, which are replicated in DKD biopsies. This study provides a rich data resource to direct future studies in elucidating underlying kidney signalling pathways and potential therapeutic targets in DKD.


Conflict of interest statement

Competing interests The authors declare no competing interests.

Figures

Fig. 1
Fig. 1. Overview of experimental pipeline and characterisation of cell models.
a Schematic representation of the experimental pipeline. Conditionally immortalised human glomerular endothelial cells (GECs), podocytes (Pods), mesangial cells (MCs) and proximal tubular cells (PTCs) were studied in vitro in a basal and insulin-resistant environment (consisting of 1 ng/ml TNFα, 1 ng/ml IL-6, 25 mM glucose and 100 nmol/l insulin). Insulin-sensitive cell lines were established via stable overexpression of the human insulin receptor (IR). The cellular transcriptome and proteome were studied simultaneously using RNA sequencing and tandem-mass-tagged mass spectrometry (n = 5 biological repeats per cell line and condition) and integrated transcriptome and proteome data were analysed using univariate and multivariate statistical models and gene set enrichment analysis (GSEA). Further targeted analysis and validation were performed using single-cell and bulk transcriptomics data from human DKD biopsies. Figure partly created in BioRender. Lay, A. (2022) BioRender.com/x18l854 and BioRender. Lay, A. (2024) BioRender.com/m22n059. b Western blotting of total protein lysates demonstrated suppression of insulin-stimulated (15-min, 10 or 100 nmol/L) IR and Akt phosphorylation in all cell lines exposed to diabetic, insulin resistant, milieu (‘DM’). GECs displayed no evidence of IR downregulation (representative of n = 4 biological replicates). c–f Percentage increase in cellular uptake of [3H]2-deoxy-d-glucose in insulin-stimulated (15-min, 100 nmol/L) GECs (n = 6), Pods (n = 3), MCs (n = 4) and PTCs (n = 5) [all biological repeats] vs. unstimulated cells, with and without exposure to a diabetic, insulin resistant, milieu (‘DM’), unpaired two-tailed t-test, data are presented as mean values ± SEM.
Fig. 2
Fig. 2. Transcriptome and proteome changes in insulin-resistant kidney cell lines.
RNA and protein were simultaneously isolated from podocytes (Pods), glomerular endothelial cells (GECs), mesangial cells (MCs) and proximal tubular cells (PTCs) under basal and insulin-resistant conditions, with and without additional IR-transduction (n = 5 biological repeats/condition). a Principal component analysis (PCA) of >18,000 transcripts identified by RNAseq and >6000 proteins, detected across all cell lines and conditions studied, demonstrating the primary clustering of samples by cell type. b The number of differentially expressed (DE) transcripts and DE proteins (FDR < 0.05) within each cell type (both stable insulin receptor-expressing and non-insulin receptor transfected cells) in diabetic (insulin-resistant) vs. basal (insulin-sensitive) conditions. c Transcripts and d proteins differentially expressed IR-transduced cell lines in diabetic (insulin-resistant) vs. basal (insulin-sensitive) conditions, with examples of significantly regulated molecules highlighted (FDR < 0.05); differential expression analyses of full transcriptomics and proteomics datasets are available in the ‘Source data’ file. e Venn diagrams demonstrating the overlap of DE (FDR < 0.05, Log2FC < 0 or Log2FC > 0) transcripts or proteins between individual cell types, (analysis on IR-expressing cells alone).
Fig. 3
Fig. 3. Integrated analysis of the proteome and transcriptome highlights consistently regulated genes and proteins in insulin-resistant kidney cells and human DKD.
a Pearson correlation between transcript- and protein-level regulation in insulin-resistant vs. basal conditions, within each IR-transduced cell line (n = 5 biological repeats/condition). Examples of genes consistently regulated at the transcript and protein level are highlighted; differential expression analyses of transcriptomics and proteomics datasets from IR-transduced cells are available in the ‘Source data’ file. b Hierarchical clustering and heatmap of combined DE (Log2 FC) and consensus-OPLS analysis to highlight the ‘Top 40’ consistently regulated proteins and transcripts across all cell lines in insulin resistant vs. basal conditions (selected if VIP > 1 and FDR < 0.1 in at least three comparisons), data are available in ‘Source data’ file. c Heat map highlighting genes with evidence of consistent regulation (Log2 fold change) in human cell lines and either early- (American Indian type 2 diabetes cohort, glomerular ‘Glom’, n = 69 and tubular ‘Tubule’, n = 47) or late-stage DKD (ERCB cohort, ‘Glom’ n = 12 and ‘Tubule’ n = 17) vs. Living donors (n = 18), *FDR < 0.1, **FDR < 0.01, differential expression and significance estimated using limma, data available in ‘Source data’ file. d Correlation (Spearman R) between glomerular (‘Glom’, n = 69) and tubular (‘Tubule’, n = 47) gene expression (Log2 mRNA intensity) and urinary albumin/creatinine ratio (ACR), glomerular filtration rate (GFR), estimated GFR decline (slope) and age in the American Indian early type-2 diabetes cohort, *p < 0.05.
Fig. 4
Fig. 4. Effect of NRBF2 knockdown and overexpression in cultured kidney cells.
a Brightfield images of podocytes (Pod), glomerular endothelial cells (GEC), mesangial cells (MC) and proximal tubular cells (PTC) showing changes in cell morphology 4 days after shRNA NRBF2 knockdown compared with scrambled shRNA controls. NRBF2 knockdown induces cell vacuolisation (enlarged images) along with podocyte hypertrophy and loss of GEC, MC and PTC. Scale bar = 100 μm. b Bar chart showing reduced cell number 4 days after shRNA NRBF2 knockdown compared with scrambled controls. Unpaired two-tailed t-test, cells were counted in three fields of view (n = 3 biological repeats), data are presented as mean values ± SEM. c Bar chart showing increased cell area in shRNA NRBF2 knockdown podocytes compared with controls. Area was measured in 10 cells in each of 3 fields of view. Unpaired two-tailed t-test, (n = 3 biological repeats), data are presented as mean values ± SEM. d Images of phalloidin-stained podocytes overexpressing NRBF2 (pod NRBF2 OE) and wild-type controls cultured for 10 days in basal or diabetic media (‘DM’). Diabetic media-induced changes in cell morphology and F-actin distribution (top right) that are attenuated by NRBF2 overexpression (bottom right). e Quantification of F-actin stress fibres, indicating significant F-actin rearrangement in wild-type podocytes exposed to Diabetic media ‘DM’ and no difference in F-actin distribution in NRBF2-overexpressing podocytes, one-way ANOVA with Tukey’s multiple comparisons test (n = 8 technical repeats), data are presented as mean values ± SEM.
Fig. 5
Fig. 5. Insulin-resistant kidney cells are characterised by an increased inflammatory response, ER stress and glycoprotein metabolism pathways.
a ‘Gene-concept network’ displaying normalised enrichment scores (NES) for immune/inflammatory response pathways enriched in at least one cell type at RNA and protein level (p-value < 0.05, q-value < 0.1 either from DE or Consensus OPLS analysis) and Log2 Fold Change values of core enrichment inflammatory genes/proteins, consistently regulated in each insulin resistant cell line. b, c Box plot displaying average Z-scores of expression for core inflammatory/immune genes in b human glomerular and c tubular bulk transcriptomics data from both early (American Indian type-2 diabetes cohort, glomerular (‘Glom’), n = 69 and tubular (‘Tubule’), n = 47) and advanced-stage DKD (ERCB cohort, ‘Glom’ n = 12 and ‘Tubule’ n = 17) vs Living donors (n = 18). d ‘Gene-concept network’ displaying NES for ER stress pathways enriched in at least one cell type at RNA and protein level (p-value < 0.05, q-value < 0.1 from DE or Consensus OPLS analysis) and Log2 Fold Change values of core enrichment ER stress genes/proteins, consistently regulated in each insulin resistant cell line. e, f Box plots displaying average Z-scores of expression for core ER stress genes in e human glomerular and f tubular bulk transcriptomics data from both early (‘Glom’, n = 69 and ‘Tubule’, n = 47) and advanced-stage DKD (‘Glom’ n = 12 and ‘Tubule’ n = 17) vs. Living donors (n = 18). g ‘Gene-concept network’ displaying NES for glycoprotein biosynthesis/metabolism pathways enriched in at least one cell type at RNA and protein level (p-value < 0.05, q-value < 0.1 from DE or consensus OPLS analysis) and Log2 Fold Change values of core enrichment glycoprotein biosynthesis/metabolism genes/proteins, consistently regulated in each insulin resistant cell line. h, i Box plots displaying average Z-scores of expression for core glycoprotein-related genes in h human glomerular and i tubular bulk transcriptomics data from both early (‘Glom’, n = 69 and ‘Tubule’, n = 47) and advanced-stage DKD (‘Glom’ n = 12 and ‘Tubule’ n = 17) vs. Living donors (n = 18). For b, c, e, f, h and i one-way ANOVA shown.
Fig. 6
Fig. 6. Cell-type-specific responses to insulin resistance and targeted analysis of human kidney single cell sequencing data to identify replicated changes in human DKD.
a and b Bar charts demonstrating the log2 fold-change values for the top 10 selectively regulated a transcripts and b proteins in response to insulin resistance, calculated from transcriptome and proteome data normalised and analysed for each individual cell line separately *FDR < 0.1, **FDR < 0.05, differential expression and significance estimated using limma, with a global benjamini-hochberg correction, n = 5 biological replicates, per cell type, data are presented as mean values ± SEM. c scatter plots demonstrating the genes regulated in response to insulin resistance in a cell-type-specific manner, consistently at the transcript and protein level. d–k single-cell sequencing analysis of target genes in each cell-type cluster (dot plots displaying the percentage of expressing cells and mean expression values) in d–g an American Indian type-2 diabetes cohort with early-DKD (n = 44 early-DKD vs. n = 18 LD) and h–k advanced DKD from KPMP (n = 10 advanced-DKD vs. n = 18 living donor).
Fig. 7
Fig. 7. Insulin-resistant kidney cells have differential, protein-level regulation of mitochondrial dynamics.
a Normalised enrichment scores (NES) for enriched mitochondrial gene signatures in insulin-resistant cell lines, highlighting predominant regulation at the protein-level (*q < 0.1, **q < 0.05, ***q < 0.01). b Number of significantly up- or down-regulated (FDR < 0.1) mitochondrial proteins (based on having mitochondrial GOCC annotation) detected in our proteomics datasets. c Heatmap of log2 Fold Change (insulin resistant vs. basal) for the respiratory chain complex transcripts and proteins detected in all four cell types *FDR < 0.1, **FDR < 0.05, ***FDR < 0.01. d Heatmap of log2 Fold Change (insulin resistant vs basal) for TCA cycle transcripts and proteins detected in all four cell types *FDR < 0.1, **FDR < 0.05, ***FDR < 0.01. e Heatmap of log2 Fold Change (insulin resistant vs. basal) for glycolysis transcripts and proteins detected in all 4 cell types *FDR < 0.1, **FDR < 0.05, ***FDR < 0.01. f Schematic diagram of mitochondrial bioenergetic processes likely dysregulated in Pods, MCs and PTCs based on proteomics data (upregulated = red, downregulated = blue), created in BioRender. Sinton, M. (2023) BioRender.com/s01v107. g qPCR results of MT-COXII mRNA (n = 5, each cell type and condition, two-tailed t-test, data are presented as mean values ± SEM) and h densitometry values for COX-II protein expression (n = 4 podocyte, n = 5 glomerular endothelial cells, n = 5 mesangial cells, n = 3 proximal tubular cells, two-tailed t-test, data are presented as mean values ± SEM), i qPCR results of NDUFB8 mRNA (n = 5, each cell type and condition, two-tailed t-test) and j densitometry values for NDUFB8 protein expression (n = 3 podocyte, n = 4 glomerular endothelial cells, n = 4 mesangial cells, n = 3 proximal tubular cells, two-tailed t-test).
Fig. 8
Fig. 8. Mitochondrial metabolism is differentially impaired in insulin-resistant kidney cells.
a Seahorse extracellular flux analysis of oxygen consumption rate (OCR) in ‘Basal’ or ‘Insulin resistant’ podocytes, glomerular endothelial cells (GEC), mesangial cells (MCs) and proximal tubular cells (PTCs) following injections of oligomycin (1.5 µM), FCCP (1 µM) and antimycin A (0.5 µM) plus rotenone (0.5 µM) at the indicated time points. b, c Percentage of ATP production attributed to b mitochondrial respiration or c glycolysis in each cell line under ‘Basal’ or ‘Insulin Resistant’ conditions in podocytes (‘Pod’, n = 6 ‘Basal’ vs. n = 7 ‘Insulin Resistant’), glomerular endothelial cells (‘GEC’, n = 6 ‘Basal’ vs. n = 5 ‘Insulin Resistant’), mesangial cells (‘MC’, n = 7 ‘Basal’ vs. n = 6 ‘Insulin Resistant’) and proximal tubular cells (PTC, n = 4 ‘Basal’ vs. n = 4 ‘Insulin Resistant’) two-tailed t-test, data are presented as mean values ± SEM; d OCR values per minute, per 1000 cells representing maximal respiratory capacity (in ‘Insulin Resistant’ vs. ‘Basal’ conditions in Podocytes (‘Pod’, n = 6 ‘Basal’ vs. n = 7 ‘Insulin Resistant’), glomerular endothelial cells (‘GEC’, n = 6 ‘Basal’ vs. n = 5 ‘Insulin Resistant’), mesangial cells (‘MC’, n = 7 ‘Basal’ vs. n = 6 ‘Insulin Resistant’) and proximal tubular cells (PTC, n = 4 ‘Basal’ vs. n = 4 ‘Insulin Resistant’) two-tailed t-test, data are presented as mean values ± SEM; e OCR values per minute, per 1000 cells representing mitochondrial spare respiratory capacity (in ‘Insulin Resistant’ vs. ‘Basal’ conditions in podocytes (‘Pod’, n = 6 ‘Basal’ vs. n = 7 ‘Insulin Resistant’), glomerular endothelial cells (‘GEC’, n = 6 ‘Basal’ vs. n = 5 ‘Insulin Resistant’), mesangial cells (‘MC’, n = 7 ‘Basal’ vs. n = 6 ‘Insulin Resistant’) and proximal tubular cells (PTC, n = 4 ‘Basal’ vs. n = 4 ‘Insulin Resistant’) two-tailed t-test, data are presented as mean values ± SEM.

References

    1. Thomas, M. C. et al. Diabetic kidney disease. Nat. Rev. Dis. Prim.1, 15018 (2015). - DOI - PMC - PubMed
    1. Afkarian, M. et al. Kidney disease and increased mortality risk in type 2 diabetes. J. Am. Soc. Nephrol.24, 302–308 (2013). - DOI - PMC - PubMed
    1. Groop, P. H. et al. The presence and severity of chronic kidney disease predicts all-cause mortality in type 1 diabetes. Diabetes58, 1651–1658 (2009). - DOI - PMC - PubMed
    1. An, Y. et al. Renal histologic changes and the outcome in patients with diabetic nephropathy. Nephrol. Dial. Transpl.30, 257–266 (2015). - DOI - PubMed
    1. Ahlqvist, E. et al. Novel subgroups of adult-onset diabetes and their association with outcomes: a data-driven cluster analysis of six variables. Lancet Diabetes Endocrinol.6, 361–369 (2018). - DOI - PubMed

Publication types

Associated data

Grants and funding

LinkOut - more resources