. 2024 Nov 19;15(1):10008.
doi: 10.1038/s41467-024-54324-9.

Rab7a is an enhancer of TPC2 activity regulating melanoma progression through modulation of the GSK3β/β-Catenin/MITF-axis

Affiliations

Rab7a is an enhancer of TPC2 activity regulating melanoma progression through modulation of the GSK3β/β-Catenin/MITF-axis

Carla Abrahamian et al. Nat Commun. .

Abstract

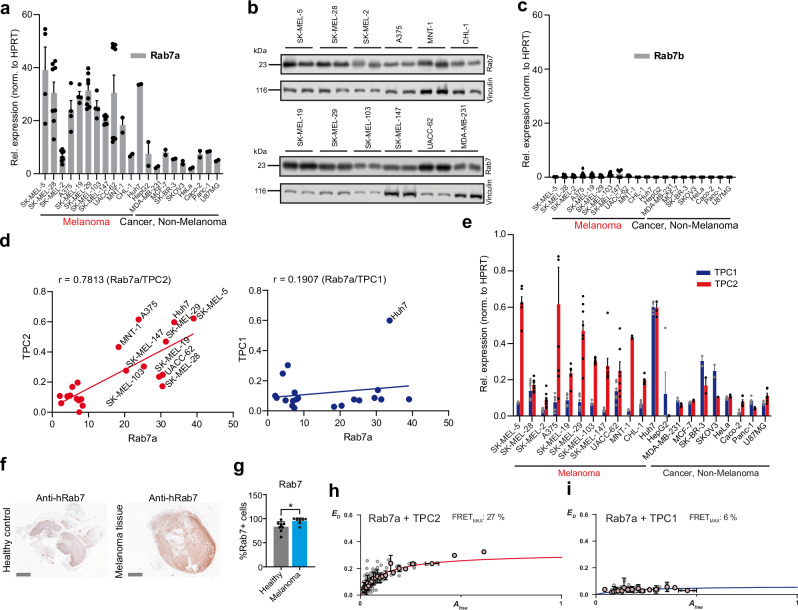
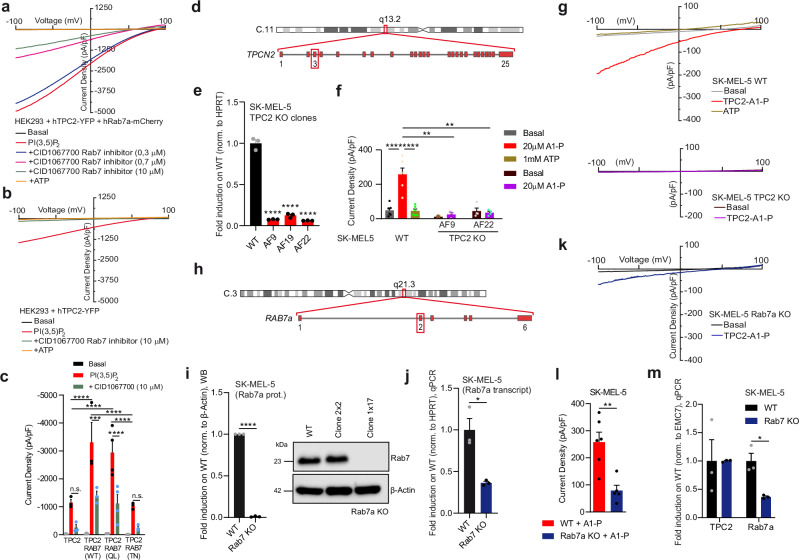
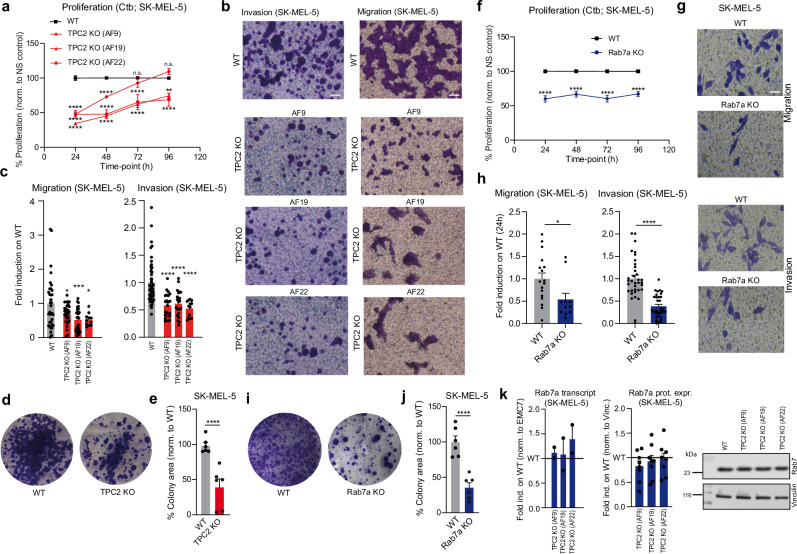
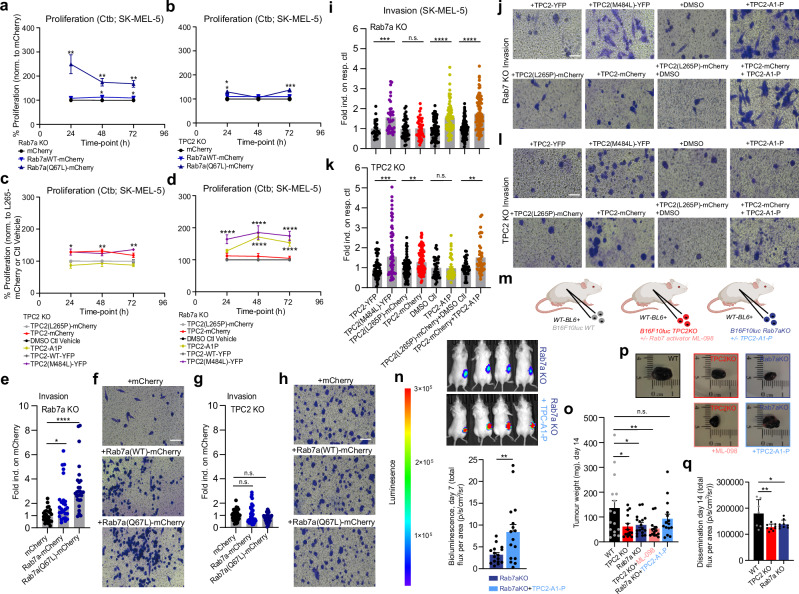
Melanoma arising from pigment-producing melanocytes is the deadliest form of skin cancer. Extensive ultraviolet light exposure is a major cause of melanoma and individuals with low levels of melanin are at particular risk. Humans carrying gain-of-function polymorphisms in the melanosomal/endolysosomal two-pore cation channel TPC2 present with hypopigmentation, blond hair, and albinism. Loss of TPC2 is associated with decreased cancer/melanoma proliferation, migration, invasion, tumor growth and metastasis formation, and TPC2 depleted melanoma cells show increased levels of melanin. How TPC2 activity is controlled in melanoma and the downstream molecular effects of TPC2 activation on melanoma development remain largely elusive. Here we show that the small GTPase Rab7a strongly enhances the activity of TPC2 and that effects of TPC2 on melanoma hallmarks, in vitro and in vivo strongly depend on the presence of Rab7a, which controls TPC2 activity to modulate GSK3β, β-Catenin, and MITF, a major regulator of melanoma development and progression.


Conflict of interest statement

Competing interests The authors declare no competing interests.

Figures

Fig. 1
Fig. 1. Expression of Rab7a in melanoma versus non-melanoma cancer cells, correlation with TPC2 expression, and interaction of Rab7a with TPC2.
a Gene expression profile (qPCR) of Rab7a in human melanoma lines compared to different non-melanoma cancer lines. Error bars represent mean values ± SEM. Data points represent biological replicates. b Protein levels corroborating mRNA expression data in melanoma lines (compared to the breast cancer line MDA-MB-231). Shown are biological replicates, each. c Gene expression profile (qPCR) of Rab7b in human melanoma lines compared to different non-melanoma cancer lines. Data points show biological replicates. Error bars represent mean values ± SEM. Data points represent biological replicates. d Melanoma lines showing strong expression correlation between Rab7a and TPC2 but not TPC1. e Gene expression profile (qPCR) showing relative expression of TPCs in human melanoma lines compared to different non-melanoma cancer lines. Error bars represent mean values ± SEM. Data points represent biological replicates. f Representative images of sections from healthy lymphnode (female, abdomen) and melanoma lymphnode metastasis (male, left forefoot) samples stained with hRab7 antibody (IHC). Scale bars = 5 mm. g IHC evaluation was carried out considering the percentage of stained tumor cells. Statistical significance was assessed by two-tailed unpaired t-test, *p = 0.0126 (mean ± SD, n = 10, each). One dot corresponds to one independent human donor. h, i FRET experiments showing FRET efficiencies in HEK293 cells expressing hTPC2WT or hTPC1WT with hRab7aWT (n = 163 and 60 biological replicates, respectively, error bars are SEM). Source data are provided as Source Data file.
Fig. 2
Fig. 2. Effect of Rab7a on TPC2 activity.
a Effect of PI(3,5)P2 in endolysosomal vesicles coexpressing human TPC2 and Rab7a or mutant variants of Rab7a. Shown are representative current density-voltage relationships from −100 to +100 mV with basal currents in black, 1 µM PI(3,5)P2 activated currents in red and ATP (1 mM) blocked currents in blue, measured from apilimod-treated, enlarged endolysosomal vesicles expressing either hTPC2WT, hTPC2WT + hRAB7aWT, hTPC2WT + hRAB7aQ67L (constitutively active Rab7a) or hTPC2WT + hRAB7aT22N (dominant negative Rab7a). b, c Analogous experiments for the lipophilic small molecule agonists of TPC2 TPC2-A1-P and TPC2-A1-N (10 µM, each). d Statistical summary of data comprising average current densities (mean ± SEM) at −100 mV measured in endolysosomal patch-clamp experiments as shown in (ac). Each dot on the bar graph represents a single current density value measured from one endolysosome (n = 3–9). Data were tested for statistical significance with one-way ANOVA test followed by Tukey’s post-test (*p < 0.0357, ***p < 0.001, ****p < 0.0001). e Representative GCaMP6s traces, with mean value curves highlighted in bold (color coded), each. Bar chart: Maximal change in fluorescence after application of TPC2 agonist TPC2-A1-N (mean ± SEM). Change in GCaMP6s fluorescence (ΔF) was normalized to baseline value (ΔF/F0), each. The baseline value (F0) was acquired by averaging fluorescence from a 30 s recording before addition of compound. One dot corresponds to one experiment with 3–7 transfected cells, each. TPC2-GCaMP6s (n = 12), TPC2-GCaMP6s + Rab7 WT (n = 9), TPC2-GCaMP6s + Rab7 Q67L (n = 10), TPC2-GCaMP6s + Rab7 T22N (n = 12), L265P-TPC2-GCaMP6s + Rab7 WT (n = 8). Statistical significance was determined via one-way ANOVA followed by Bonferroni multiple comparisons test (p (L265P TPC2 + Rab7a vs. WT TPC2) = 0.0356, p (WT TPC2 vs. TPC2 + Rab7a) = 0.0261, p (WT TPC2 vs. TPC2 + QL Rab7a) < 0.0001, p (TPC2 + Rab7a vs. TPC2 + QL Rab7a) = 0.0037, p (TPC2 + Rab7a vs. TPC2 + TN Rab7a) < 0.0001). Source data are provided as Source Data file.
Fig. 3
Fig. 3. Effect of Rab7 inhibitor on TPC2 activity and physical interaction of Rab7a with TPC2.
a, b Inhibition of PI(3,5)P2 evoked currents in endolysosomes (EL), expressing hTPC2 alone or with Rab7a, using the Rab7-inhibitor CID1067700. Shown are representative current density-voltage relationships of enlarged EL, expressing hTPC2WT + hRab7WT or hTPC2WT alone, activated with 1 µM PI(3,5)P2 followed by application of CID1067700 (diff. conc.) and 1 mM ATP (max. effect). c Statistical summary of data as shown in (a, b) at −100 mV. Each dot represents a single current density value measured from one EL. Data were tested for statistical significance with one-way ANOVA test followed by Tukey’s post-test (***p < 0.001, ****p < 0.0001, n = 3). d Cartoon showing CRISPR/Cas9 strategy to knockout TPCN2 in the SK-MEL-5 cell line. e qPCR data showing relative expression of TPC2 in WT and TPC2 KO SK-MEL-5 (n = 3). f Statistical summary of data (average current densities at −100 mV) as shown in (g) (n = 6). g Representative current density-voltage relationships from −100 to +100 mV showing basal, TPC2-A1-P (20 µM) activated and ATP (1 mM) blocked currents. h Cartoon showing CRISPR/Cas9 strategy to knockout Rab7a in SK-MEL-5. i Western blot data showing Rab7a protein levels in WT and Rab7a KO SK-MEL-5 clone C1x17. Clone C2x2 showed no reduction in expression and was not further used (n = 3). j qPCR data depicting transcript levels of Rab7a KO SK-MEL-5 clone C1x17, compared to WT (n = 3). Representative current density-voltage relationships from −100 to +100 mV showing basal and TPC2-A1-P activated currents, measured in SK-MEL-5 Rab7a KO cells from enlarged ELs (k) and corresponding statistics (n = 6) (l). m qPCR data showing expression of TPC2 and Rab7a in WT and Rab7a KO SK-MEL-5 cells (n = 3). Electrophysiological data (c, f, l) were tested for statistical significance using a one-way ANOVA test followed by Tukey’s post-test. Statistical significance for m was determined using two-way ANOVA followed by Bonferroni multiple comparisons test and for i and j by two-tailed unpaired t-test. Shown are mean values ± SEM, (n = 3, each). *p < 0.05, **p < 0.01, ***p < 0.001, ****p < 0.0001. All n numbers represent biological replicates. Source data are provided as Source Data file.
Fig. 4
Fig. 4. Proliferation, migration and invasion in WT, TPC2 KO and Rab7a KO SK-MEL-5 cells.
Ctb assay assessing proliferation of SK-MEL-5 cells monitored over 96 h comparing WT cells to different clones for TPC2 KO (n = 12) (a) and Rab7a KO (n = 18) (f). Genetic ablation of either TPC2 (b) or Rab7a (g) in SK-MEL-5 melanoma line shows significantly slower invasion and migration, cells seeded on transwell chambers and monitored overnight. Statistical analysis for Boyden chamber migration and invasion experiments in TPC2 KO (n = 11–34) (c) and Rab7a KO (n = 13–49) (h) SK-MEL-5 cells. Clonogenic assay showing significant reduction in survival and growth as single colonies for both TPC2 KO (d) and Rab7a KO (i) SK-MEL-5 cells. Statistical analysis for SK-MEL-5 TPC2 KO (n = 6) (e) and Rab7a KO (n = 6) (j) plotted as colony area percentage, fold induction on WT cells. k qPCR (n = 2) and Western blot (n = 8) analysis indicating unchanged transcript and protein levels of Rab7a in TPC2 KO clones. Statistical significance in a and f was carried out using two-way ANOVA followed by Bonferroni multiple comparisons test (n = 3, each), in c by one-way ANOVA, and in e, h, and j by two-tailed unpaired t-test Student’s t-test. Shown are mean values ± SEM. *p < 0.05, **p < 0.01, ***p < 0.001, ****p < 0.0001. All scale bars = 25 µm. All n numbers represent biological replicates. Source data are provided as Source Data file.
Fig. 5
Fig. 5. Proliferation and invasion for different melanoma lines using knockdown siRNA.
Proliferation monitored over 72 h using Ctb assay of the following melanoma lines: SK-MEL-5, SK-MEL-29, SK-MEL-19, UACC-62, SK-MEL-103, SK-MEL-147, and A375 in non-silencing (NS) control cells compared to TPC2 KD (n = 3–10) (a) and Rab7a KD (n = 3–10) (b). Statistical analysis of cell invasiveness determined in the lines mentioned above using transwell boyden chambers coated with matrigel in both Rab7a KO (n = 26–64) (c) and TPC2 (n = 21–58) (e). Representative images of invasion phenotype in TPC2 KD (d) and Rab7a KD (f) cells in several melanoma lines compared to NS control. Statistical significance was determined using two-way ANOVA followed by Bonferroni multiple comparisons test (a, b; n = 3, each) and by two-tailed unpaired t-test (c, e). Shown are mean values ± SEM. *p < 0.05, **p < 0.01, ***p < 0.001, ****p < 0.0001. All scale bars = 25 µm. All n numbers represent biological replicates. Source data are provided as Source Data file.
Fig. 6
Fig. 6. Expression of MITF and GSK3β in different melanoma lines and effects of Rab7a or TPC2 KO or small molecule blockers.
a Representative Western blots for MITF and Rab7 protein expression in different melanoma lines and in the breast cancer line MDA-MB-231, normalized to Vinculin. b, c Correlation plot for MITF/Rab7 expression (b) and statistical analysis of experiments as shown in (a) (mean values ± SEM, n = 5–8). Data points represent biological replicates (c). d Representative images of sections from healthy lymphnode (male, abdomen) and melanoma lymphnode metastasis (male, iliacal) samples stained with hMITF antibody (IHC). Scale bars = 5 mm. e IHC evaluation was carried out considering the percentage of stained tumor cells. Statistical significance was assessed by two-tailed unpaired t-test, *p = 0.0125 (mean ± SD). One dot corresponds to one independent human donor (n = 10 for each condition). Genetic knockout of either Rab7a (f, g) or TPC2 (h, i) in SK-MEL-5 cells shows reduction in the protein levels of MITF and β-Catenin but increased expression of GSK3β. Statistical analysis for the expression levels of MITF, GSK3β, and β-Catenin, WT vs. Rab7a KO or TPC2 KO is shown in (g, i), respectively; significance determined by two-tailed unpaired t-test (g) or by one-way ANOVA (i). Shown are mean values ± SEM, n = 8–14 in (g) and 3–9 in (i). *p < 0.05, **p < 0.01, ***p < 0.001, ****p < 0.0001. j, k Representative blots for MITF protein expression in different melanoma lines after treatment with the TPC2 inhibitor SG-094 (7 µM) or DMSO control for 24 h. Statistical significance was determined by one-way ANOVA. Shown are mean values ± SEM, n = 5–7. *p < 0.05, ***p < 0.001, ****p < 0.0001. Proliferation experiments showing effect of SG094 treatment (7 µM) in SK-MEL-5 and other SK-MEL melanoma lines, significance determined by one-way ANOVA (l) or two-tailed unpaired t-test (m). Shown are mean values ± SEM. *p < 0.05, **p < 0.01, ***p < 0.001, ****p < 0.0001. All n numbers represent biological replicates. Source data are provided as Source Data file.
Fig. 7
Fig. 7. Rescue experiments in SK-MEL-5 TPC2 and Rab7a KO.
Proliferation of Rab7a KO (a) or TPC2 KO (b) cells expressing vector alone, Rab7WT- or Rab7Q67L-mCherry, assessed for 24-, 48-, and 72-h and normalized to vector. Proliferation assessed for 24-, 48-, and 72-h for Rab7a KO (c) or TPC2 KO (d) SK-MEL-5 cells expressing TPC2WT-mCherry normalized to TPC2L265P-mCherry, TPC2M484L-YFP normalized to TPC2WT-YFP, and treatment with the agonist TPC2-A1P normalized to DMSO control. eh Representative images of the invasive phenotype determined by OE of mCherry vector, Rab7WT- or Rab7Q67L-mCherry in Rab7a KO and TPC2 KO, and statistical analysis shown in (e) and (g), respectively. Statistical significance was determined using one-way ANOVA, mean values ± SEM. il Representative images and statistical analysis of the invasive phenotype determined by OE of TPC2WT-mCherry, TPC2M484L-YFP, and/or treatment with TPC2-A1P in Rab7a and TPC2 KO, normalized to resp. control. Statistical significance in ae, g, i, k was determined using one-way ANOVA followed by Bonferroni multiple comparisons test, mean values ± SEM (ad: n = 9–15; e, g: n = 4; i: n = 3–9, k: n = 5–8). *p < 0.05, **p < 0.01, ***p < 0.001, ****p < 0.0001. mp In vivo experiments showing tumor growth/weight after subcutaneous injection of B16F10luc WT, TPC2 KO or Rab7a KO cells into 5–6 week old C57Bl/6-Tyr mice. Treatment with vehicle control, ML-098 (0.04 mg/g) or TPC2-A1-P (0.02 mg/g) was performed daily (m, “Created in BioRender”). BioRender.com/n88t710.”). Bioluminescence images (d7 after injection) and bioluminescence signal intensities of tumors, mean ± SEM (n = 15 for Rab7a KO + TPC2-A1-P, n = 17 for Rab7a KO). Statistical significance was assessed by two-tailed unpaired t-test, **p < 0.0001 (mean ± SEM) (n). Tumor weights and representative tumors at the endpoint (day 14) are shown in (o, p). Statistical significance was determined using one-way ANOVA, mean values ± SEM (WT n = 16, TPC2 KO ± ML-098 n = 14 each, Rab7a KO n = 17, Rab7a KO + TPC2-A1-P n = 15), *p < 0.05, **p < 0.01. q In vivo experiments showing tumor cell dissemination after intravenous injection of 2 × 105 B16F10-luc WT, TPC2 KO or Rab7a KO cells. Data from day 14 (endpoint) are shown. Statistical significance was determined using ordinary one-way ANOVA, mean ± SD (WT n = 7, TPC2 KO and Rab7a KO n = 9), *p < 0.05, **p < 0.01. Source data are provided as Source Data file.
Fig. 8
Fig. 8. Proposed mechanism of β-Catenin and MITF regulation in SK-MEL-5 WT and Rab7/TPC2 KO cells.
In WT cells, Rab7a upregulates activity of TPC2 which induces endolysosomal degradation of the GSK3β complex. Downregulation of GSK3β leads to decreased phosphorylation of β-Catenin, which then translocates in its dephosphorylated state to the nucleus and activates MITF transcription. The transcription factor MITF induces the transcription of various genes upregulating cell migration, invasion, proliferation and tumor growth. Furthermore, decreased GSK3β levels lead to decreased phosphorylation of MITF, hence less proteosomal degradation of MITF. When Rab7a or TPC2 is dysfunctional or knocked out, GSK3β phosphorylates β-Catenin and MITF promoting their proteosomal degradation, and blocking β-Catenin from translocation to the nucleus. Less MITF transcription leads to a decrease in migration, invasion, proliferation and tumor growth, suggesting that TPC2 GOF SNPs and high Rab7a expression may be risk factors for melanoma. “Created in BioRender. BioRender.com/c52w590”.

References

    1. Ceresa, B. P. & Bahr, S. J. rab7 activity affects epidermal growth factor:epidermal growth factor receptor degradation by regulating endocytic trafficking from the late endosome. J. Biol. Chem.281, 1099–1106 (2006). - PubMed
    1. Shinde, S. R. & Maddika, S. PTEN modulates EGFR late endocytic trafficking and degradation by dephosphorylating Rab7. Nat. Commun.7, 10689 (2016). - PMC - PubMed
    1. Guerra, F. & Bucci, C. Multiple roles of the small GTPase Rab7. Cells5, 34 (2016). - PMC - PubMed
    1. Progida, C. et al. Rab7b controls trafficking from endosomes to the TGN. J. Cell Sci.123, 1480–1491 (2010). - PubMed
    1. van den Boomen, D. J. H. et al. A trimeric Rab7 GEF controls NPC1-dependent lysosomal cholesterol export. Nat. Commun.11, 5559 (2020). - PMC - PubMed

Publication types

MeSH terms

Substances

LinkOut - more resources