. 2024 Nov 19;15(1):10011.
doi: 10.1038/s41467-024-54381-0.

Nuclear receptor-SINE B1 network modulates expanded pluripotency in blastoids and blastocysts

Affiliations

Nuclear receptor-SINE B1 network modulates expanded pluripotency in blastoids and blastocysts

Ka Wai Wong et al. Nat Commun. .

Abstract

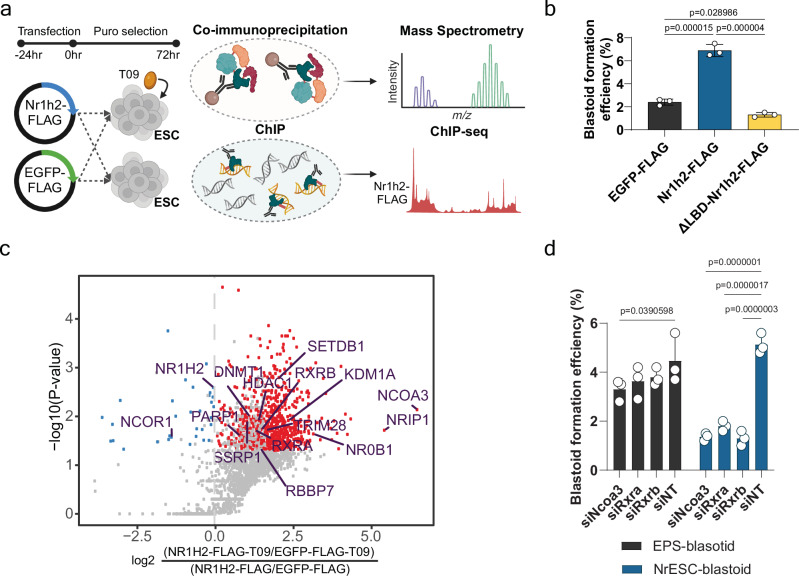
Embryonic stem cells possess the remarkable ability to self-organize into blastocyst-like structures upon induction. These stem cell-based embryo models serve as invaluable platforms for studying embryogenesis and therapeutic developments. Nevertheless, the specific intrinsic regulators that govern this potential for blastoid formation remain unknown. Here we demonstrate an intrinsic program that plays a crucial role in both blastoids and blastocysts across multiple species. We first establish metrics for grading the resemblance of blastoids to mouse blastocysts, and identify the differential activation of gene regulons involved in lineage specification among various blastoid grades. Notably, abrogation of nuclear receptor subfamily 1, group H, member 2 (Nr1h2) drastically reduces blastoid formation. Nr1h2 activation alone is sufficient to rewire conventional ESC into a distinct pluripotency state, enabling them to form blastoids with enhanced implantation capacity in the uterus and contribute to both embryonic and extraembryonic lineages in vivo. Through integrative multi-omics analyses, we uncover the broad regulatory role of Nr1h2 in the transcriptome, chromatin accessibility and epigenome, targeting genes associated with embryonic lineage and the transposable element SINE-B1. The Nr1h2-centred intrinsic program governs and drives the development of both blastoids and early embryos.


Conflict of interest statement

Competing interests The authors declare no competing interests.

Figures

Fig. 1
Fig. 1. Classification of type I to III blastoids/ organoids and identification of key regulon in blastoid formation.
a Phase-contrast images of EPS-blastoids (type I and II) and type III organoids (top, scale bar, 100 µm) and immunofluorescence for markers of the TE (Cdx2), ICM/EPI (Sox2) and PE (Gata6) in type I to III (bottom, scale bar, 50 µm). 5 independent experiments were repeated with similar results. b Hierarchical clustering dendrogram (top) and principle-component analysis (PCA) plot (bottom) of scRNA-seq data from cells of type I-III, public datasets of E3.5 and E4.5 blastocysts. c Dot plot indicating the expression of differentially expressed genes between Type I, II blastoids and Type III organoids for each linage (EPI, PE, and TE). d Quantification of the blastoid efficiency after individual siRNA treatment. One-way ANOVA with Bonferroni correction for multiple comparisons. Data are represented as mean ± s.d.; n = 3 independent assays. e Representative images of blastoids harvested at Day 5 of differentiation after transfection of siNr1h2 and siNT respectively at Day 0 in a 24-well Aggrewell. Scale bar, 150 µm. f Quantification of type I and II blastoid formation efficiency upon Nr1h2 knockdown. Two-way ANOVA with Bonferroni correction for multiple comparisons. Data are represented as mean ± s.d.; n = 3 independent assays. g Immunofluorescence for markers of ICM/EPI (Oct4) and TE (Cdx2) in siNr1h2 and siNT blastoids. Scale bar, 50 µm. h Quantification of the percentage of cystic structures without inner cell mass (ICM-absent) formed at Day 5 differentiation upon Nr1h2 knockdown. Two-tailed Welch’s t-test. Data are represented as mean ± s.d.; n = 3 independent assays. i Representative images of blastoids harvested at Day 5 of differentiation with or without T09 treatment. Scale bar, 150 µm. j Quantification of the type I and II blastoid formation efficiency with or without T09 treatment. Two-way ANOVA with Bonferroni correction for multiple comparisons. Data are represented as mean ± s.d.; n = 3 independent assays. Source data are provided as a Source Data file.
Fig. 2
Fig. 2. Multi-omic analyses of Nr1h2 activation in conferring expanded pluripotency.
a Representative images of NrESC-derived blastoids harvested at Day 5 of differentiation. Scale bar, 150 µm 25 independent experiments were repeated with similar results. b Quantification of blastoid formation efficiency from different passages of NrESC. X-axis denotes number of passages cultured in presence of T09, where +0 referred to starting ESC. c Brightfield images of ESC and NrESC. Scale bar, 100 µm. 100 independent cultures were repeated with similar results. d A schematic diagram showing the multi-omic approach of the molecular characterization of NrESC. Created in BioRender.com e Principle-component analysis (PCA) of bulk RNA-seq data from ESC, NrESC (Passage 16), and EPSC along with single-cell RNA-seq data from development stage based average expression values. f Average Nr1h2 ChIP-seq signal comparison between NrESC (Passage 16) and ESC on Nr1h2 binding peaks with H3K27ac increases in NrESC (Passage 16). g Average H3K27ac ChIP-seq signal comparison between NrESC and ESC on Nr1h2 binding peaks with H3K27ac increases in NrESC. h Heatmap showing the representative genes upregulated in NrESC with differential H3K27ac peaks. i Representative genes upregulated in NrESC with increased H3K27ac signal in comparison to ESC. Source data are provided as a Source Data file.
Fig. 3
Fig. 3. Global chromatin accessibility and DNA methylation changes in NrESC.
a PCA showing the chromatin accessibility divergence between ESC, EPSC, and NrESC at 1st and 16th passage. b Heatmap showing ATAC-seq signal intensity across upregulated accessible peaks with Tead4 motif in NrESC. c Histogram displaying the global CpG methylation levels of ESC, NrESC (Passage 16), and EPSC based on WGBS. d PCA analysis of ESC, NrESC (Passage 16), EPSC, mouse early embryos, and PSC in serum condition based on the genome-wide methylomes. e, f Enrichment of genomic features at transposable element families on NrESC differentially hypermethylated bases. Empirical P-values were calculated by a two-sided permutation test (e) and hypomethylated bases (f). The y-axis represents the log2-enrichment for each genomic feature, and the value labelled on the bar represents the significance p-value, calculated with the Genomic Association Test (GAT) tool. g Genome browser view showing the WGBS and RNA-seq signal profiles for NrESC and ESC surrounding upregulated genes Scd2 and Ring1 with lower methylation signal in NrESC, and differentially methylated region (DMR)-enriched ERVKs annotated downregulated genes Clca3b and Ercc4.
Fig. 4
Fig. 4. Nr1h2 activation enhances blastoid implantation and multi-species blastocyst development.
a In vivo approaches depicted to examine Nr1h2 activation in blastoid implantation and blastocyst development. Created in BioRender.com. b Immunofluorescence for markers of the TE (Cdx2), ICM/EPI (Oct4) and PE (Gata6) in NrESC blastoid derived from 16th passage NrESC. Scale bar, 50 µm. 5 independent experiments were repeated with similar results. c A Umap plot showing the clustering of cells from Li et al. EPSblastoid, EPSC blastoids (current study), E4.5 blastocyst (GSE159883), and NrESC blastoids single-cell transctipome. d Umap plot showing Gata2 expression in clustered TE lineage cells from (c). e Polar bar chart displaying the percentage of Krt8/Krt18/Gata2/Tagln2 expressing cells in TE lineage for different blastoids or blastocysts. f Representative brightfield images showing the decidua formation in three mouse uteri at E10.5, as well as 7 days after NrESC-blastoid or EPSC-blastoid transfer at 3.5dpc. Red asterisks indicate deciduae. Scale bar, 1 cm. g Quantification of the decidua formation efficiency from the NrESC- or EPS-derived blastoids at 10.5dpc. Two-tailed Welch’s t-test. Data are represented as mean ± s.d.; n = 9 independent assays. h Quantification of the decidua length induced by E10.5 natural embryo, NrESC- or EPS-derived blastoid 10.5dpc. One-way ANOVA with Bonferroni correction for multiple comparisons. Data are represented as mean ± s.d.; n = 23 E10.5 natural embryo, n = 13 NrESC-derived blastoid 10.5dpc, n = 3 EPS-derived blastoid 10.5dpc. i Left, maximum projection image of immunofluorescence for GFP and TE marker (Cdx2) in chimeric E4.5 blastocysts microinjected with psinGFP NrESC. Right, single confocal plane insets showing Cdx2-GFP double positive cell and GFP single positive cells. Scale bar, 20 µm. Quantification of the developmental rate of mouse blastocysts after supplementing T09 in culture media from one-cell stage (j) or microinjection of GFP or Nr1h2 mRNA into one-cell embryo (k). Two-tailed Welch’s t-test. Data are represented as mean ± s.d.; n = 5 independent assays. l Quantification of the developmental rate of porcine SCNT blastocysts with or without T09 in culture media from one-cell stage. Two-tailed Welch’s t-test. Data are represented as mean ± s.d.; n = 3 independent assays. m Representative images of porcine SCNT morula and blastocyst in T09-treated and control group post-SCNT. Scale bar, 50 µm. 3 independent experiments were repeated with similar results. Source data are provided as a Source Data file.
Fig. 5
Fig. 5. Active Nr1h2 partners with coactivator proteins to regulate blastoid formation.
a A schematic diagram showing transient overexpression of Nr1h2-FLAG in ESC with T09 treatment, followed by pull-down mass spectrometry and ChIP-seq of FLAG-tagged Nr1h2. Created in BioRender.com. b Quantification of blastoid formation efficiency harvested at Day 5 of differentiation from ESC overexpressing EGFP-FLAG, Nr1h2-FLAG or ΔLBD-Nr1h2-FLAGunder T09 treatment. One-way ANOVA with Bonferroni correction for multiple comparisons. Data are represented as mean ± s.d.; n = 3 independent assays. c Volcano plot summarising the quantitative results of the proteins enriched significantly in Nr1h2-FLAG mass spectrometry data in ESC with T09 from three replicates. The specific proteins interacting with Nr1h2 in ESC with T09 were colored red (Two-sided t-test; p-value < 0.05 & FC > 2). d Quantification of the blastoid efficiency after individual siRNA treatment in EPSC-blastoid or NrESC-blastoid formation. Two-way ANOVA with Bonferroni correction for multiple comparisons. Data are represented as mean ± s.d.; n = 3 independent assays. Source data are provided as a Source Data file.
Fig. 6
Fig. 6. Molecular mechanism of the activation of Nr1h2 intrinsic program.
a A dual-Glo luciferase assay depicted to test SINE-B1 enhancer activity in ESC and NrESC, as well as siNr1h2 and siNT NrESC samples. Created in BioRender.com. b Genome browser view of Nr1h2-FLAG ChIP-seq (turquoise), H3K27ac ChIP-seq (orange, ESC; purple, NrESC) and RNA-seq signal profile (red) surrounding NrESC up-DEGs (Scd1, Abcg1 and Scd2). Red-colored boxes and dashed lines indicate the candidate SINE-B1 enhancer regions being tested. c Quantification of the normalized luminescence (normalized to Renilla signal and ESC signal) in three constructs testing for SINE-B1 candidates nearby Scd1, Abcg1 and Scd2 in ESC and NrESC (top), or siNT and siNr1h2 NrESC (bottom). Two-tailed Welch’s t-test. Data are represented as mean ± s.d.; n = 3 independent assays. d Western blot analysis showing that Kdm1a is only associated with Nr1h2-FLAG in T09-treated Nr1h2-FLAG and Kdm1a-HA overexpressing sample (Nr-FLAG and Kd-HA), compared to GFP control sample (G-FLAG and G-HA). 3 independent experiments were repeated with similar results. e Heatmap of ChIP-seq signal on Nr1h2-FLAG ChIP-seq peaks. The ChIP-seq of Kdm1a was obtained from the GEO database. f Genome browser view of Nr1h2-FLAG ChIP-seq (turquoise), Kdm1a ChIP-seq (blue) and RNA-seq signal profile (red) surrounding NrESC markers (Grn and Scd1). g Expression of Grn, Scd1 and Krt8 in ESC overexpressing EGFP-FLAG or Nr1h2-FLAG under T09 treatment. Expression is relative to Gapdh and normalized to EGFP-FLAG ESC expression. Data are represented as mean ± s.d.; n = 3 technical replicates. h Immunofluorescence of Scd1 in ESC and NrESC. Scale bar, 20 µm. 3 independent experiments were repeated with similar results. i Sequential ChIP-qPCR indicating the increased co-binding of Kdm1a and Nr1h2-FLAG under T09 treatment at Abca1, Hdac2, Grn and Scd1, normalized to EGFP-FLAG control. Regions not bound by Kdm1a and Nr1h2-FLAG were used as negative control. Data are represented as mean ± s.d.; n = 3 technical replicates. j Quantification of blastoid formation efficiency from NrESC treated with recombinant Grn, Igg, Anti-Grn, Igg + T09, or Anti-Grn + T09. One-way ANOVA with Bonferroni correction for multiple comparisons. Data are represented as mean ± s.d.; n = 3 independent assays. k Quantification of blastoid formation efficiency from NrESC treated with T09 and/ or Scd1 inhibitor. One-way ANOVA with Bonferroni correction for multiple comparisons. Data are represented as mean ± s.d.; n = 3 independent assays. l Model schematic showing multifaceted regulatory roles of Nr1h2-specific intrinsic program in NrESC. Created in BioRender.com. Source data are provided as a Source Data file.

References

    1. Nishioka, N. et al. The Hippo signaling pathway components Lats and Yap pattern Tead4 activity to distinguish mouse trophectoderm from inner cell mass. Dev. Cell16, 398–410 (2009). - DOI - PubMed
    1. Zhao, B. et al. Inactivation of YAP oncoprotein by the Hippo pathway is involved in cell contact inhibition and tissue growth control. Genes Dev.21, 2747–2761 (2007). - DOI - PMC - PubMed
    1. Yagi, R. et al. Transcription factor TEAD4 specifies the trophectoderm lineage at the beginning of mammalian development. Development134, 3827–3836 (2007). - DOI - PubMed
    1. Nishioka, N. et al. Tead4 is required for specification of trophectoderm in pre-implantation mouse embryos. Mech. Dev.125, 270–283 (2008). - PubMed
    1. Loh, Y.-H. et al. The Oct4 and Nanog transcription network regulates pluripotency in mouse embryonic stem cells. Nat. Genet.38, 431–440 (2006). - DOI - PubMed

Publication types

Substances

LinkOut - more resources