. 2024 Nov 19;15(1):10002.
doi: 10.1038/s41467-024-54296-w.

Large-scale single-nuclei profiling identifies role for ATRNL1 in atrial fibrillation

Affiliations

Large-scale single-nuclei profiling identifies role for ATRNL1 in atrial fibrillation

Matthew C Hill et al. Nat Commun. .

Abstract

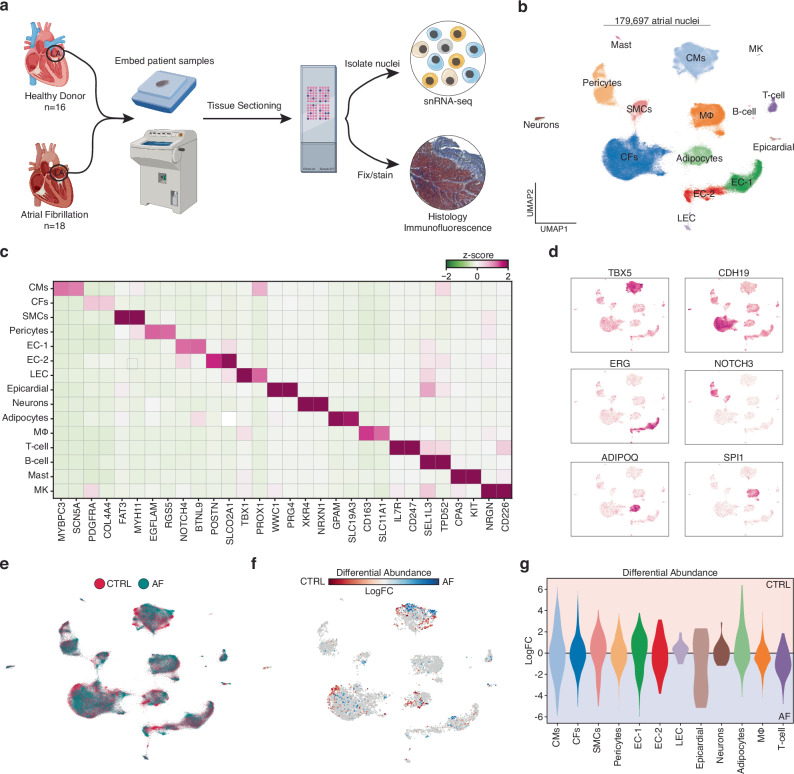
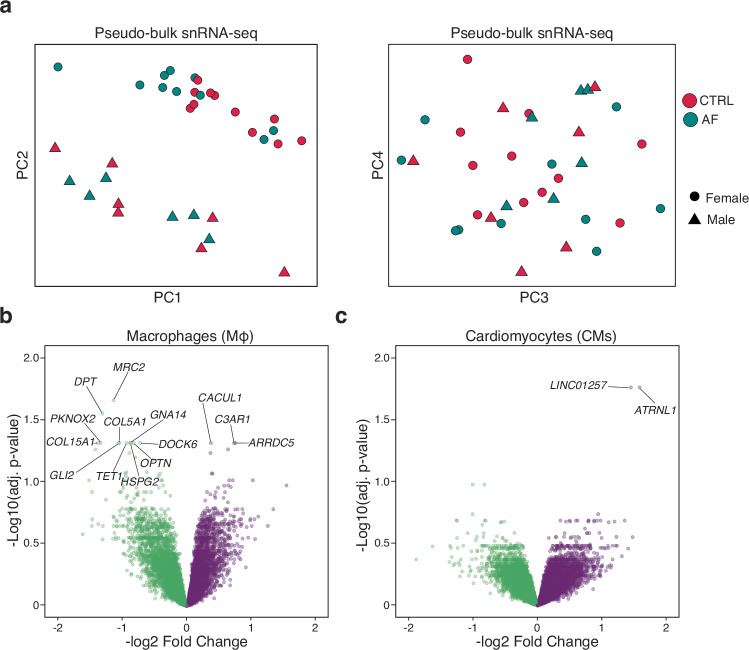
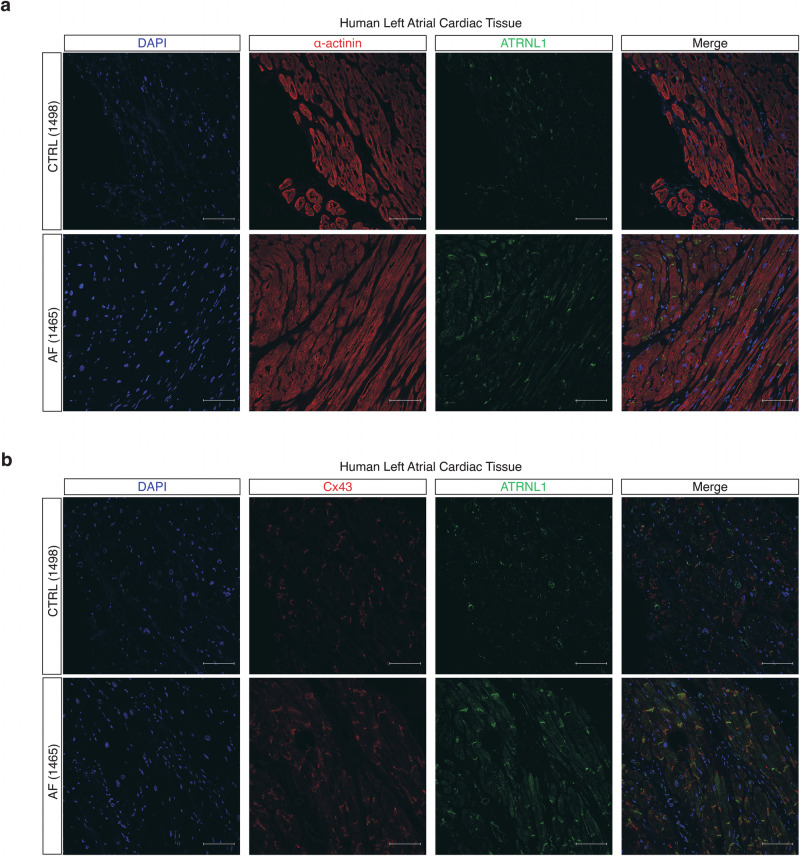
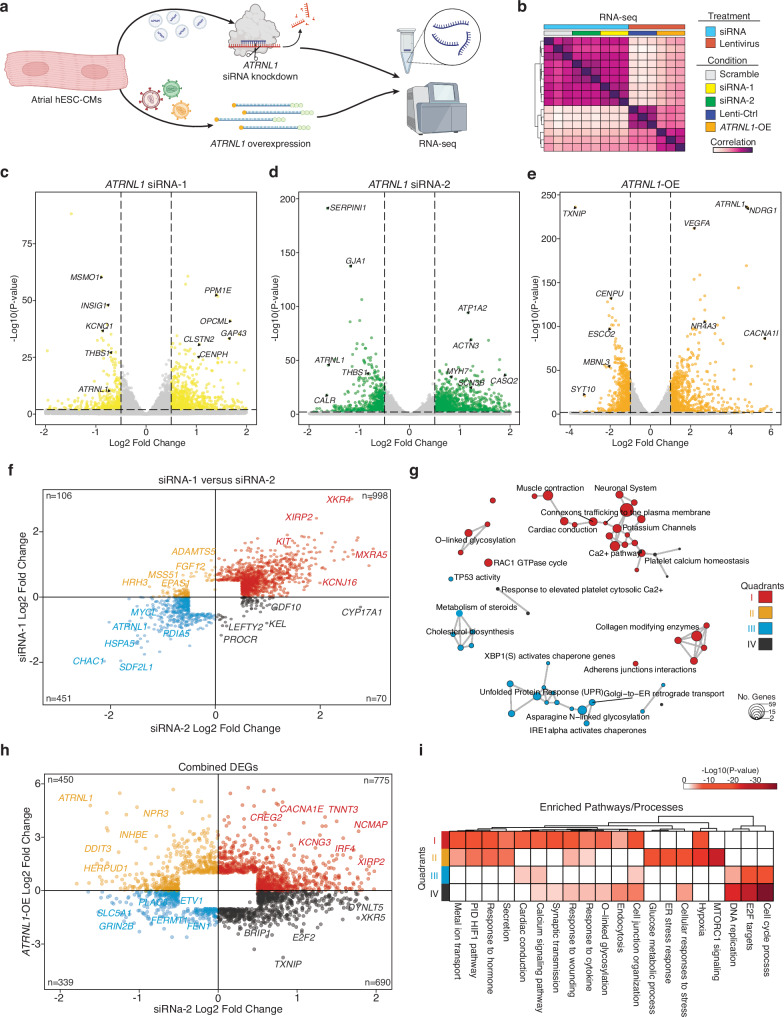
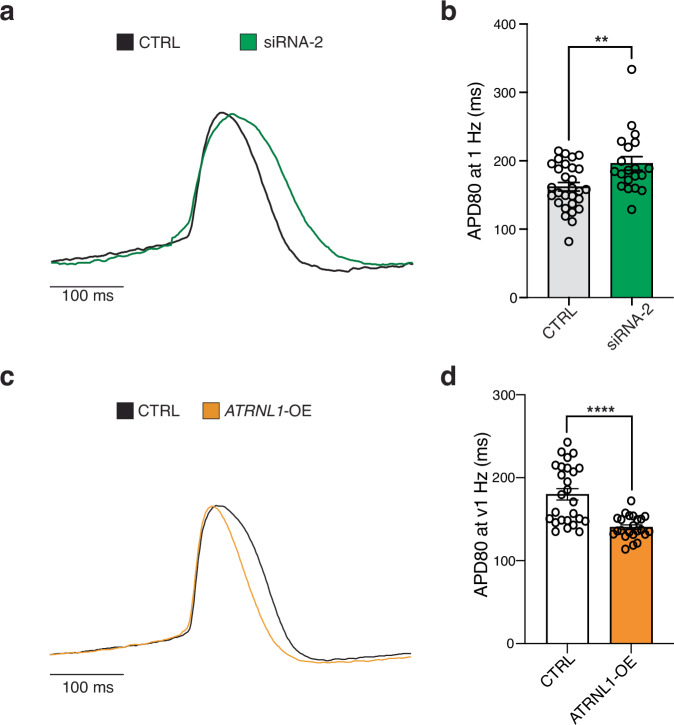
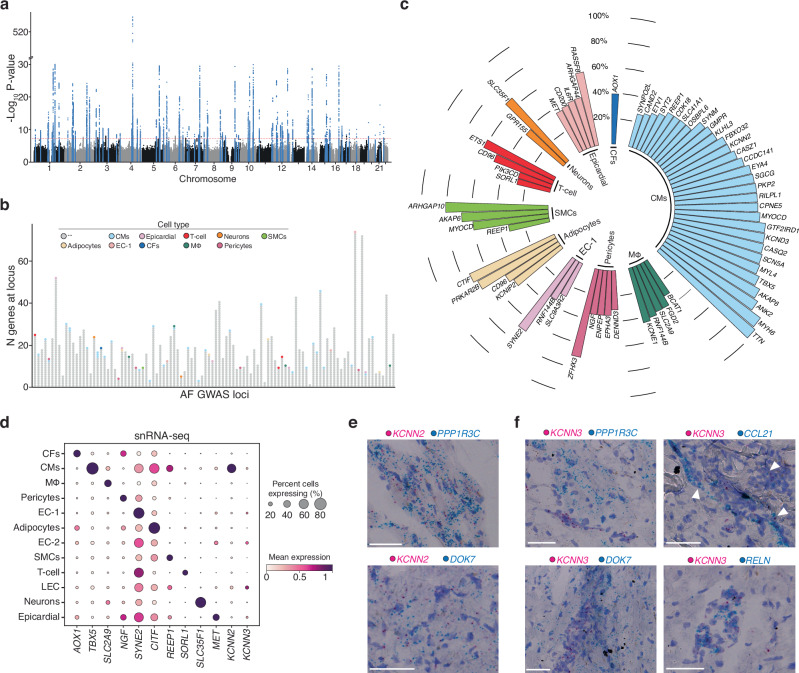
Atrial fibrillation (AF) is the most common sustained arrhythmia in humans, yet the molecular basis of AF remains incompletely understood. To determine the cell type-specific transcriptional changes underlying AF, we perform single-nucleus RNA-seq (snRNA-seq) on left atrial (LA) samples from patients with AF and controls. From more than 175,000 nuclei we find that only cardiomyocytes (CMs) and macrophages (MΦs) have a significant number of differentially expressed genes in patients with AF. Attractin Like 1 (ATRNL1) was overexpressed in CMs among patients with AF and localized to the intercalated disks. Further, in both knockdown and overexpression experiments we identify a potent role for ATRNL1 in cell stress response, and in the modulation of the cardiac action potential. Finally, we detect an unexpected expression pattern for a leading AF candidate gene, KCNN3. In sum, we uncover a role for ATRNL1 which may serve as potential therapeutic target for this common arrhythmia.


Conflict of interest statement

Competing interests C.A.K. is an employee of Bayer US LLC (a subsidiary of Bayer AG) and may own stock in Bayer. The Precision Cardiology Laboratory is joint effort between the Broad Institute and Bayer AG. P.T.E. has received sponsored research support from Bayer AG, Novo-Nordisk, Bristol Myers Squibb and Pfizer; he has also served on advisory boards or consulted for Bayer AG. C.R. is a full-time employee at GSK as of July 2024. All remaining authors declare no competing interests.

Figures

Fig. 1
Fig. 1. Cellular Composition in the LA from patients with and without atrial fibrillation.
a Schematic of experimental setup and tissue processing pipeline. Created partly in BioRender. Hill, M. (2021) BioRender.com/e34r263. b Uniform manifold approximation and projection (UMAP) representation of 179,697 left atrial cardiac nuclei isolated from a total of 30 donors. c Heatmap displaying the expression of marker genes for each cluster (cell type). Low median z-score of normalized expression highlighted in green. High expression showed in purple. d Feature plots of gene expression. High expression shown in purple. e UMAP displaying the clinical designation of each transcriptome. Healthy controls denoted by red, and AF patients are highlighted in blue. f Embedding of the Milo k-nearest neighbor differential abundance testing results for all cell types. Neighborhoods colored by log fold changes for Control (CTRL) versus AF. A negative (blue) log fold change indicates enrichment in AF, and a positive (red) log fold change represents an enrichment in CTRL. Nonsignificant neighborhoods (false discovery rate (FDR) > 5%) are shown in white. g Milo k-nearest neighbor differential abundance testing results scored by individual cell type. Cell types colored as in Fig. 1b.
Fig. 2
Fig. 2. Differentially expressed genes in atrial fibrillation.
a PCA plots for pseudobulk RNA-seq analysis of samples by diagnosis. Red is control (CTRL) and blue is AF cases. Female samples are shaped as circular and male samples by triangles. b Volcano plot displaying the differentially expressed genes in macrophages between controls and AF cases. c Volcano plot displaying the differentially expressed genes in CMs between controls and AF cases. Volcano plots show log fold change and two-sided P-value expression changes between AF and CTRL for each gene tested using limma–voom differential expression analysis (“Methods”).
Fig. 3
Fig. 3. Subcellular localization of ATRNL1 in human left atrial tissue.
a Tissue immunohistochemistry for nuclei/DAPI (blue), α-actinin (red), and ATRNL1 (green) in CTRL (n = 3) and AF (n = 3) LA tissue. A total of 4 images were evaluated per tissue section. b Tissue immunohistochemistry for nuclei/DAPI (blue), Cx43 (red), and ATRNL1 (green) in CTRL (n = 3) and AF (n = 3) LA tissue. Scale bars = 100 μm. A total of 4 images were evaluated per tissue section.
Fig. 4
Fig. 4. ATRNL1 is part of the CM cell stress response.
a Experimental overview for RNA-seq. Created partly in BioRender. Hill, M. (2021) BioRender.com/e34r263. b Correlation heatmap of RNA-seq sample distances. Euclidean distance between samples based on DESeq2 normalized gene expression (“Methods”). Individual libraries are annotated type of treatment and condition. We profiled 3 replicates for each condition (total n = 15). c Volcano plot displaying the differentially expressed genes in hESC-aCMs between siRNA-1 treated cells and Scramble siRNA control treated cells. Genes highlighted in yellow are significantly differentially expressed (adjusted p-value < 0.05, and Log2 Fold Change > 0.5). d Volcano plot displaying the differentially expressed genes in hESC-aCMs between siRNA-2 treated cells and Scramble siRNA control treated cells. Genes highlighted in green are significantly differentially expressed (adjusted p-value < 0.05, and Log2 Fold Change >  0.5). e Volcano plot displaying the differentially expressed genes in hESC-aCMs between ATRNL1-OE treated cells and control GFP lentiviral treated cells. Genes highlighted in orange are significantly differentially expressed (adjusted p-value < 0.01, and Log2 Fold Change > 1.0). f Scatterplot of all combined significantly differentially expressed genes compared across siRNA-1 treated cells and siRNA-2 treated cells. Individual genes are colored by their location on the Cartesian coordinate plane, separating them into quadrants. Representative genes are highlighted. g Enrichment map for gene pathway over-representation analysis colored by quadrant from Fig. 5f. The size of each dot represents the number of genes in that pathway category. h Scatterplot of all combined significantly differentially expressed genes compared across siRNA-2 treated cells and ATRNL1-OE cells. Individual genes are colored by their location on the Cartesian coordinate plane, separating them into quadrants. Representative genes are highlighted. i Heatmap for pathway enrichment analysis colored by significance of enrichment (2-sided P-value). Quadrant are annotated and colored according to Fig. 5h. Volcano plots show log fold change and two-sided P-value expression changes between AF and CTRL for each gene tested using DEseq2 differential expression analysis (“Methods”).
Fig. 5
Fig. 5. Modulation of ATRNL1 alters the atrial action potential duration.
a Representative action potentials recorded by optical mapping of ArcLight fluorescence in hESC-aCMs transfected with scrambled siRNA (CTRL) or siRNA-2 targeting ATRNL1. b Bar plot displaying the mean ± SEM of action potential durations at 80% repolarization (APD80, ms) in CTRL and ATRNL1 siRNA-2 treated hESC-aCMs. N = 29 in CTRL and n = 20 in ATRNL1 siRNA-2, N is the total number of wells from three independent biological replicates. **p = 0.0092, CTRL vs. siRNA-2, two-tailed Mann-Whitney test. c Representative tracings of action potentials in hESC-aCMs transduced with lentivirus carrying an empty vector backbone (CTRL), or an ATRNL1 overexpression construct (ATRNL1-OE). d Bar plot displaying the mean ± SEM of APD80 in hESC-aCMs overexpressing the short isoform of ATRNL1 or CTRL. N = 26 in CTRL and N = 23 in ATRNL1-OE from two biological replicates. ****p < 0.0001, CTRL vs. ATRNL1-OE, two-tailed Mann-Whitney test.
Fig. 6
Fig. 6. Integration of AF snRNA-seq data with a multi-ancestry genome-wide association study for AF.
a Manhattan plot for Roselli et al. AF GWAS main results. The dotted line marks the cutoff for genome-wide significance (P-value < 5 × 10-8, that accounts for multiple testing across the genome). Highlighted in blue are the genetic loci that reached genome-wide significance, which were used to select the region (1 mega base (MB) around sentinel variants) and identify overlapping genes for the integration with snRNA-seq data. The y-axis of the plot has a break between -log10(P-value) of 30 and 510 to for visibility. The significance level accounts for multiple testing of independent variants with using a Bonferroni correction. P values (two-sided) were derived from a meta-analysis using a fixed-effects model with an inverse-variance weighted approach. b Stacked dotplot with one column for each genetic locus examined. Each dot represents a gene at the genetic locus, showing the range of number of genes within 1 MB of sentinel variants. Some loci including more than 60 genes close to the sentinel variant. Genes that overlap with the marker genes for the snRNA-seq cell types are labeled in cell-type specific colors as in Fig. 1b. Gray dots indicate genes that did not overlap. The cell-types color scheme is shown in the legend. c Circular plot of all marker genes that intersected with the AF GWAS loci, sorted by percent of cells expressing the gene and cell-type. Cell types are labeled in cell-type specific colors as in Fig. 1b. d Dot plot displaying expression for each indicated cell population. Size represents the percent of cells expressing each marker. e RNA-ISH images of LA tissue displaying expression of KCNN2 (shown in pink) and the CM markers PPP1R3C (top, shown in blue) and DOK7 (bottom, shown in blue). Scale bars = 50 μm. f RNA-ISH images of LA tissue displaying expression of KCNN3 (shown in pink) and the CM markers PPP1R3C (top left, shown in blue) and DOK7 (bottom left, shown in blue). Expression of KCNN3 (shown in pink) and the LEC markers CCL21 (top right, shown in blue) and RELN (bottom right, shown in blue). Scale bars = 50 μm.

References

    1. Nattel, S., Heijman, J., Zhou, L. & Dobrev, D. Molecular basis of atrial fibrillation pathophysiology and therapy: a translational perspective. Circ. Res.127, 51–72 (2020). - PMC - PubMed
    1. Shah, M., Akar, F. G. & Tomaselli, G. F. Molecular basis of arrhythmias. Circulation112, 2517–2529 (2005). - PubMed
    1. Dobrev, D. Electrical remodeling in atrial fibrillation. Herz31, 108–112 (2006). - PubMed
    1. Chen, Y.-H. et al. KCNQ1 gain-of-function mutation in familial atrial fibrillation. Science299, 251–254 (2003). - PubMed
    1. Kato, T., Iwasaki, Y. & Nattel, S. Connexins and atrial fibrillation: filling in the gaps. Circulation125, 203–206 (2012). - PubMed

Publication types

Substances

Associated data