

Electroencephalographic signatures of migraine in small prospective and large retrospective cohorts
- PMID: 39562659
- PMCID: PMC11577025
- DOI: 10.1038/s41598-024-80249-w
Electroencephalographic signatures of migraine in small prospective and large retrospective cohorts
Abstract
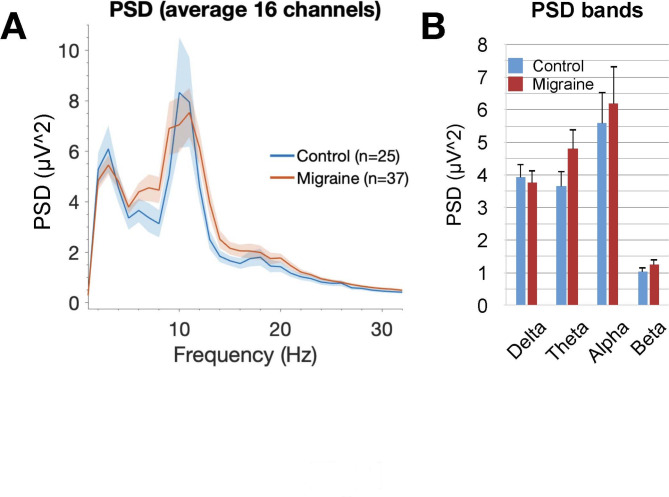
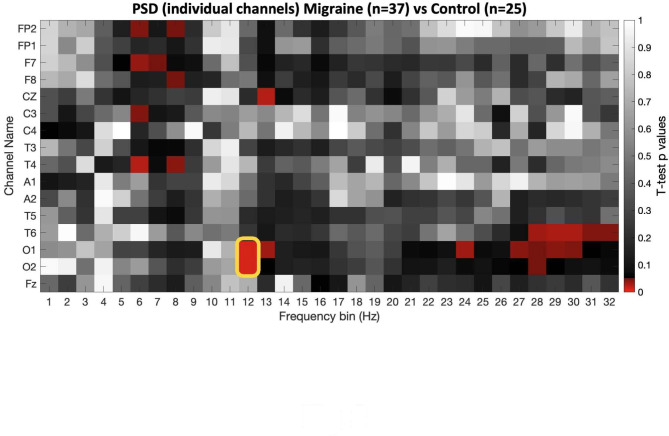
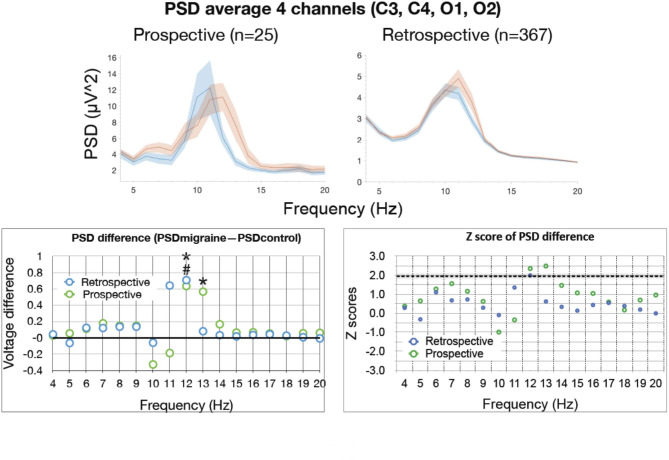
Migraine is one of the most common neurological disorders in the US. Currently, the diagnosis and management of migraine are based primarily on subjective self-reported measures, which compromises the reliability of clinical diagnosis and the ability to robustly discern candidacy for available therapies and track treatment response. In this study, we used a computational pipeline for the automated, rapid, high-throughput, and objective analysis of encephalography (EEG) data at Cleveland Clinic to identify signatures that correlate with migraine. We performed two independent analyses, a prospective analysis (n = 62 subjects) and a retrospective age-matched analysis on a larger cohort (n = 734) obtained from the sleep registry at Cleveland Clinic. In the prospective analysis, no significant difference between migraine and control groups was detected in the mean power spectral density (PSD) of an all-electrodes montage in the frequency range of 1-32 Hz, whereas a significant PSD increase in single occipital electrodes was found at 12 Hz in migraine patients. We then trained machine learning models on the binary classification of migraine versus control using EEG power features, resulting in high accuracies (82-83%) with occipital electrodes' power at 12 Hz ranking highest in the contribution to the model's performance. Further retrospective analysis also showed a consistent increase in power from occipital electrodes at 12 and 13 Hz in migraine patients. These results demonstrate distinct and localized changes in brain activity measured by EEG that can potentially serve as biomarkers in the diagnosis and personalized therapy for individuals with migraine.
Keywords: Electroencephalography; Machine learning; Migraine.
© 2024. The Author(s).
Conflict of interest statement
Figures
References
-
- Burch, R., Rizzoli, P. & Loder, E. The prevalence and impact of migraine and severe headache in the United States: Figures and trends from government health studies. Headache58(4), 496–505 (2018). - PubMed
-
- ICHD-3. Headache Classification Committee of the International Headache Society (IHS) The International Classification of Headache Disorders, 3rd edition. Cephalalgia38(1), 1–211 (2018). - PubMed
-
- Charles, A. The pathophysiology of migraine: implications for clinical management. Lancet Neurol.17(2), 174–182 (2018). - PubMed
MeSH terms
LinkOut - more resources
Full Text Sources
Medical
