. 2024 Nov 19;7(1):1536.
doi: 10.1038/s42003-024-07222-1.

Laterality, sexual dimorphism, and human vagal projectome heterogeneity shape neuromodulation to vagus nerve stimulation

Affiliations

Laterality, sexual dimorphism, and human vagal projectome heterogeneity shape neuromodulation to vagus nerve stimulation

Natalia P Biscola et al. Commun Biol. .

Abstract

Neuromodulation by vagus nerve stimulation (VNS) provides therapeutic benefits in multiple medical conditions, including epilepsy and clinical depression, but underlying mechanisms of action are not well understood. Cervical vagus nerve biopsies were procured from transplant organ donors for high resolution light microscopy (LM) and transmission electron microscopy (TEM) to map the human fascicular and sub-fascicular organization. Cervical vagal segments show laterality with right sided dominance in fascicle numbers and cross-sectional areas as well as sexual dimorphism with female dominance in fascicle numbers. The novel and unprecedented detection of numerous small fascicles by high resolution LM and TEM expand the known fascicle size range and morphological diversity of the human vagus nerve. Ground truth TEM quantification of all myelinated and unmyelinated axons within individual nerve fascicles show marked sub-fascicular heterogeneity of nerve fiber numbers, size, and myelination. A heuristic action potential interpreter (HAPI) tool predicts VNS-evoked compound nerve action potentials (CNAPs) generated by myelinated and unmyelinated nerve fibers and validates functional dissimilarity between fascicles. Our findings of laterality, sexual dimorphism, and an expanded range of fascicle size heterogeneity provide mechanistic insights into the varied therapeutic responses and off-target effects to VNS and may guide new refinement strategies for neuromodulation.


Conflict of interest statement

Competing interests The authors declare no competing interests.

Figures

Fig. 1
Fig. 1. The human cervical vagus nerve shows laterality and sexual dimorphism.
The human cervical vagus nerve shows multiple fascicles of varied sizes and shapes, and they may have sub-fascicles (AC). Yellow and red boxed areas in A are at higher magnification in B and C. The perineurium is outlined in green and endoneurium in purple colors (B, C). The right side has significantly more fascicles at 11.4 ± 2.0 (n = 21) compared to the left side at 5.5 ± 1.4 (n = 15) (p < 0.05) (D). The right side shows a significantly larger total fascicle area at 820 ± 97 (×1000 µm2) (n = 21) compared to the left side at 583 ± 97 (×1000 µm2) (n = 15) (p < 0.05) (E). The total endoneurium area is also significantly larger on the right side at 691 ± 84 (×1000 µm2) (n = 20) compared to the left side at 492 ± 82 (×1000 µm2) (n = 20) (p < 0.05) (F). Paired analyses with right and left cervical vagal samples procured from the same donor also provides strong support for laterality at the level of the cervical vagus nerve with a significantly higher number of fascicles on the right side (n = 12, p < 0.01) (G), significantly larger fascicle area on the right side (n = 12 pairs; p < 0.001) (H), and significantly larger endoneurium space on the right side (n = 12 pairs, p < 0.001) (I). Statistical analysis of fascicle-level data in both sexes showed a significantly higher total number of fascicles in women for a mixed population of left-and right-sided cervical fascicles at 13.1 ± 2.5 (n = 15) compared to men at 6.0 ± 1.3 (n = 21) (p < 0.05) (J). A significantly higher left-sided number of fascicles was seen in women at 8.6 ± 2.4 (n = 7) compared to men at 2.9 ± 1.2 (n = 8) (p < 0.05) (K). A significantly higher number of right-sided fascicles was detected in women at 17.1 ± 3.8 (n = 8) compared to men at 7.9 ± 1.7 (n = 13) (p < 0.05) (L).
Fig. 2
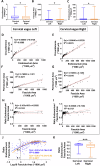
Fig. 2. Individual human cervical vagal fascicles show laterality with left-sided dominance.
In side comparisons, the circumference of individual fascicles was significantly longer on the left compared to the right side (p < 0.05) (A), and the total fascicle and endoneurium cross-sectional areas were significantly larger on the left compared to the right side (p < 0.05) (B, C). Hence, the analysis of individual fascicles was performed separately for left- and right-sided fascicles. Correlational studies between cervical fascicle endoneurium area and circumference as well as between cervical fascicle and perineurium areas were next performed. There was a strong linear positive correlation between the endoneurium area and circumference on both the left side (R2 = 0.8668) and the right side (R2 = 0.8076) (D, E). There was also a strong linear positive correlation between the fascicle area and perineurium area on the left side (R2 = 0.8471) and the right side (R2 = 0.8245) (F, G). In contrast, the linear correlation was weak between the fascicle area and the ratio of the endoneurium area/fascicle area on the left side (R2 = 0.0153) and the right side (R2 = 0.0727) (H, I). Here the ratio of the endoneurium and fascicle areas was used as an indicator for the relative proportion of fascicle insulation by the perineurium with a lower number indicating a more prominent perineurium thickness for fascicle size. The correlational analysis hence indicated that the relationship between relative perineurium thickness and fascicle size is not linear. Close observation of the fascicle area distribution suggested an uneven spread of the data points with a majority of the fascicles clustering within the relatively smaller size range on both the left and right sides (DI). Next, correlational studies between log10 fascicle area and the ratio of endoneurium area/fascicle area showed a strong correlation on both the left and right side (J). Additional analysis showed the ratio of endoneurium area/fascicle area as significantly higher for left- compared to right-sided fascicles (p < 0.001) (K). The latter finding was influenced by larger left-sided fascicles (see AC) with also a thinner perineurium for fascicle size and associated higher endoneurium area/fascicle area ratio. R2 = Coefficient of determination. Red dotted lines in DI indicate 95% confidence intervals.
Fig. 3
Fig. 3. Ultrastructure of the human cervical vagal sub-fascicular organization.
All myelinated and unmyelinated axons of eight representative fascicles (F1-F8) were digitally segmented for quantitative analysis of myelinated and unmyelinated nerve fiber numbers, diameter of myelinated fibers, axonal diameters (without myelin), myelin thickness, and G-ratio (axon diameter/myelinated fiber diameter). The total number of myelinated unmyelinated fibers are indicated in separate boxes for each fascicle. Note extensive variability between fascicles in nerve fiber numbers, relative compositions of myelinated and unmyelinated fibers, myelination patterns (myelin thickness and G-ratio), and nerve fiber size distributions. Unimodal distributions with predominantly small myelinated fibers and bi- or multi-modal distributions with both small and larger fiber distribution peaks are represented. The much varied sub-fascicular organization of nerve fibers suggests extensive fascicular heterogeneity for nerve conduction and recruitment properties. Scale bar = 20 µm in F1, 10 µm in F2, 30 µm in F3, 40 µm in F4, 10 µm in F5 and F6, 40 µm in F7, and 20 µm in F8.
Fig. 4
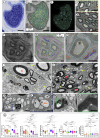
Fig. 4. Ultrastructural heterogeneity of human cervical vagal fascicles.
LM micrograph shows toluidine blue-stained, medium sized, fascicle of human cervical vagus nerve segment (A). TEM montage of fascicle in A is shown with super-imposed digital segmentation of 221 myelinated (M) and 467 unmyelinated (UM) axons (B). Outer and inner contours of myelin sheets are shown in blue and yellow, and UM axons in orange (B). Outer and inner contours of the perineurium are presented in green and purple, and Schwann cell (SC) nuclei are shown in blue. Segmentations without TEM montage are shown in C. Yellow and red boxed areas in B are shown at high magnification in D and E. Note clusters of small M axons, UM axons, and SC nuclei in between larger M fibers. TEM image of a small fascicle is shown in F and with superimposed digital segmentation of outer and inner contours of the perineurium and M and UM fibers, and SC nuclei (G). The color coding in G is identical to BE. Higher magnification TEM detail of lower right portion of G is shown in H. TEM of representative areas of cervical vagus nerve segment shows M and UM fibers, and SC nuclei indicated by red asterisks, yellow arrows, and blue arrows, respectively (I, J). TEM shows detail of fascicle endoneurium with UM axons, Schwann cell nucleus, and surrounding collagen fibers (K). Higher magnification of blue box area in K shows UM fibers with intra-axonal cytoskeletal detail (L). An intra-axonal mitochondria is shown with orange arrow. An M axon and associated myelinating SC is shown in M. High magnification of green box in M identifies individual wraps of myelin sheet (N). Analysis of all segmented M and UM fibers in fascicles F1-F8 (Fig. 3) compares fiber size and myelination between fascicles (O). Paired statistical analysis shows significant differences in mean M fiber and axonal diameters, myelin thickness, and G-ratio between multiple fascicle pairs (O). The mean diameter for UM fibers also shows a statistical difference between many fascicles in paired analyses (O). Scale bar = 50 µm in AC, 10 µm in D, E, 5 µm in F, G, 15 µm in H, 5 µm in I, J, 2 µm in K, 1 µm in L, M, and 0.5 µm in N.
Fig. 5
Fig. 5. Heuristic Action Potential Interpreter (HAPI) – an open-source tool to explore relationships between nerve composition/organization, fiber morphology, conduction properties, and expected CNAP responses.
Screenshot shows a custom analysis of the organization of a fascicle from a human vagus nerve. HAPI allows users to load in segmentation data and select up to five colors to represent different fiber/axon diameter ranges, and bin limits can be automatically optimized or manually assigned. Users can select any fiber and the software will show its morphometry data and the predicted shape and latency for the corresponding single fiber action potential at a chosen conduction distance/recording configuration (e.g., differential versus single ended recordings). Users can simulate CNAPs by selecting different nerve or fascicle regions, the full nerve, or a particular sub-set of fibers within a range of diameters.  Regions can be compared in terms of organization/composition and expected CNAP response. Users can also produce a sweep of CNAP responses across a wide range of conduction distances and recording cuff lengths, which refers to the distance between the two electrodes in a cuff used to record the CNAP. Colors allows for easy visualization of where and how specific fiber groups contribute to the bulk CNAP response.
Fig. 6
Fig. 6. Fascicle size, composition, and electrode configuration determine the overall shape and features of the CNAP predictions by HAPI.
Multiple fascicle sizes are present in the human vagus, each with their own unique fiber composition and organization. In A, we show by TEM an example of a small fascicle with 11 myelinated fibers (left column) and 28 unmyelinated fibers (right column). In B, we show an example of a larger fascicle with substantially more myelinated and unmyelinated fibers. Note color coding of individual fiber location, diameter and corresponding contributions to the CNAP response from myelinated and un-myelinated fibers in A and B for a conduction distance of 10 mm using a bipolar platinum/iridium (Pt/Ir) recording cuff electrode with 0.5 mm inner diameter and 2.0 mm inter-electrode spacing. The relative magnitude of features of the predicted CNAP for the larger fascicle is much greater than those of the small fascicle CNAP, reflecting contributions from all myelinated and unmyelinated axons.
Fig. 7
Fig. 7. The HAPI tool predicts CNAP responses from unmyelinated axons of the human vagus nerve.
An overview of TEM of fascicle 3 in Fig. 3 is shown in A with area indicated by blue box displayed at higher magnification and with segmented unmyelinated axons superimposed in B. Note clusters of unmyelinated fibers in between larger myelinated axons. Histogram of unmyelinated fiber size distribution is shown in C. The HAPI tool provides CNAP predictions with color-coded display of the relative contributions from unmyelinated axons of different sizes in D. The CNAP predictions here are based on a recording distance of 10 mm and the use of a bipolar Pt/Ir recording cuff electrode with an inner diameter of 0.5 mm and 2.0 mm inter-electrode spacing.
Fig. 8
Fig. 8. Fiber composition of vagal sub-fascicles.
The myelinated and unmyelinated axons of each individual sub-fascicle of Fascicle 7 in Fig. 3 were segmented to provide nerve fiber size distributions. The myelinated fiber diameter and corresponding diameter of the axon proper (without myelin), myelin thickness, G-ratio, and diameter of unmyelinated axons are presented for each sub-fascicle and for the whole fascicle. Scale bars = 40 µm.
Fig. 9
Fig. 9. The sum of sub-fascicles is equal to the whole fascicle.
Unique sub-fascicle divisions are observed in the cervical segment of the human vagus nerve and can be shown and characterized with the use of the HAPI tool. HAPI-generated CNAP predictions allow for the exploration of the relative contributions of single fiber action potentials (SFAPs) from each fiber at a particular radial location in the nerve to the CNAP of each individual sub-fascicle and for the whole fascicle. In rows A and D, columns 1–3 show features of individual sub-fascicles, including TEM montages with superimposed digital segmentation of myelinated fibers (A) and unmyelinated fibers (D). In rows B and E, columns 1–3 show the predicted maximal CNAP responses for the myelinated (B) and unmyelinated (E) fibers in each sub-fascicle. In this simulation, we predicted the maximal expected CNAP response if measured at a conduction distance of 10 mm from the stimulating cathode and using a bipolar Pt/Ir recording cuff electrode with 0.5 mm inner diameter and 2.0 mm inter-electrode spacing. In rows C and F, columns 1–3 show the fiber diameter distributions of myelinated (C) and unmyelinated (F) fibers that are expected to produce the CNAP volleys in same column of rows B and E, respectively. While the fiber size distributions are similar for each sub-fascicle, the numbers of fibers in each bin differ for each fascicle, as do the relative amplitudes of the predicted CNAPs. Marker sizes are scaled according to corrected SAE-diameters and colors are used to map the CNAPs expected from each sub-fascicle to the sizes and locations of all fibers in each sub-fascicle. The rightmost column (column 4) shows the locations, sizes, distribution, and expected CNAPs for the whole fascicle (Myelinated axons: AC; Unmyelinated axons: DF). We observe that summation of the data across columns 1–3 produces the data in column 4.
Fig. 10
Fig. 10. The sum of extracellular single-fiber action potentials from myelinated and unmyelinated fibers produces the maximal CNAP response.
A Combined visualization of myelinated and unmyelinated fibers in all sub-fascicles follows the color scheme and bin range assignments shown in Fig. 9A. Diameter distributions of both myelinated and unmyelinated fibers indicate a wide fiber size range (B). The expected maximal CNAP response versus time latency is displayed for the same recording configuration as in Fig. 9 with a conduction distance of 10 mm and use of a bipolar Pt/Ir recording cuff electrode with 0.5 mm inner diameter and 2.0 mm interelectrode spacing (C). Plot presentation of the predicted CNAP response versus conduction velocity shows CNAP volleys with conduction speeds in the Aγ, Aδ, B, and C fiber range based on negative peaks and use of the letter system nerve fiber classification (Whitwam, 1976) (D). Myelinated and unmyelinated fiber CNAPs possess different relationships that relate conduction speed to axon diameter, myelin thickness, nodal spacing, and other membrane properties. The expected CNAPs are therefore calculated separately by the HAPI tool under the same simulated recording conditions and then summed to produce the expected CNAP for all myelinated and unmyelinated fibers in the fascicle. The HAPI tool can simulate the CNAP from this or other fascicles using virtually any conduction distance or bipolar recording electrode separation, including simulations of single-ended recordings.

Similar articles

Cited by

References

    1. Morris, G. L. 3rd & Mueller, W. M. Long-term treatment with vagus nerve stimulation in patients with refractory epilepsy. The Vagus Nerve Stimulation Study Group E01-E05. Neurology53, 1731–1735 (1999). - PubMed
    1. Afra, P., Adamolekun, B., Aydemir, S. & Watson, G. D. R. Evolution of the vagus nerve stimulation (VNS) therapy system technology for drug-resistant epilepsy. Front. Med. Technol.3, 696543 (2021). - PMC - PubMed
    1. Elger, G., Hoppe, C., Falkai, P., Rush, A. J. & Elger, C. E. Vagus nerve stimulation is associated with mood improvements in epilepsy patients. Epilepsy Res.42, 203–210 (2000). - PubMed
    1. Harden, C. L. et al. A Pilot study of mood in epilepsy patients treated with vagus nerve stimulation. Epilepsy Behav.1, 93–99 (2000). - PubMed
    1. O'Reardon, J. P., Cristancho, P. & Peshek, A. D. Vagus nerve stimulation (VNS) and treatment of depression: To the brainstem and beyond. Psychiatry3, 54–63 (2006). - PMC - PubMed

LinkOut - more resources