. 2025 Jan;26(1):153-174.
doi: 10.1038/s44319-024-00320-5. Epub 2024 Nov 19.

KMT5C leverages disorder to optimize cooperation with HP1 for heterochromatin retention

Affiliations

KMT5C leverages disorder to optimize cooperation with HP1 for heterochromatin retention

Justin W Knechtel et al. EMBO Rep. 2025 Jan.

Abstract

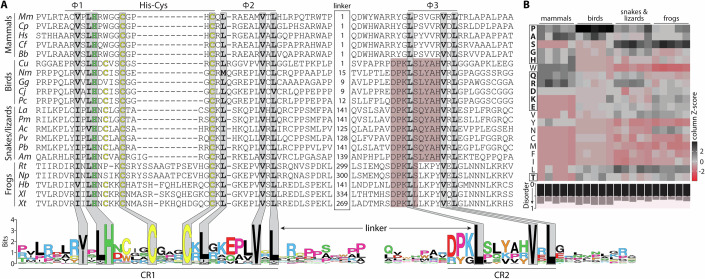
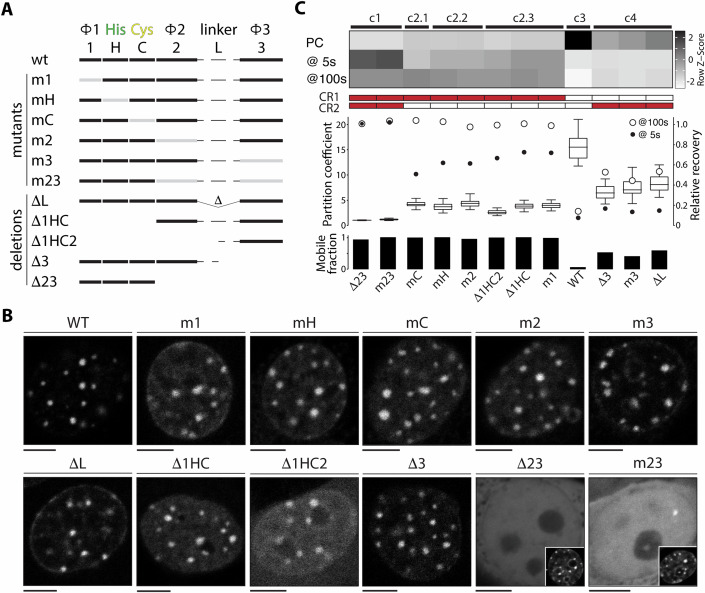
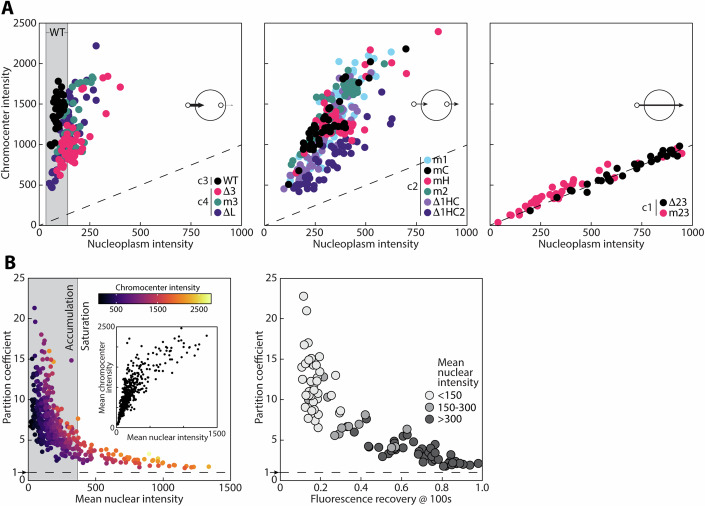
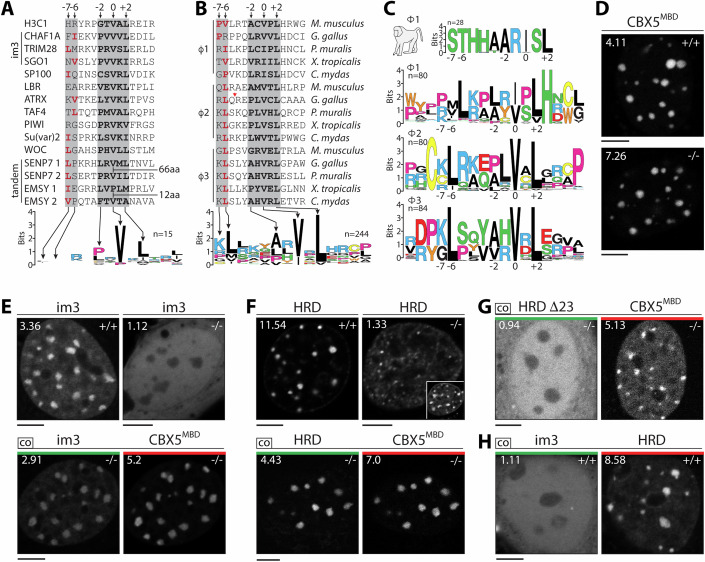
A defining feature of constitutive heterochromatin compartments is the heterochromatin protein-1 (HP1) family, whose members display fast internal mobility and rapid exchange with the surrounding nucleoplasm. Here, we describe a paradoxical state for the lysine methyltransferase KMT5C characterized by rapid internal diffusion but minimal nucleoplasmic exchange. This retentive behavior is conferred by sparse sequence features that constitute two modules tethered by an intrinsically disordered linker. While both modules harbor variant HP1 interaction motifs, the first comprises adjacent sequences that increase affinity using avidity. The second motif increases HP1 effective concentration to further enhance affinity in a context-dependent manner, which is evident using distinct heterochromatin recruitment strategies and heterologous linkers with defined conformational ensembles. Despite the linker sequence being highly divergent, it is under evolutionary constraint for functional length, suggesting conformational buffering can support cooperativity between modules across distant orthologs. Overall, we show that KMT5C has evolved a robust tethering strategy that uses minimal sequence determinants to harness highly dynamic HP1 proteins for retention within heterochromatin compartments.

Keywords: Heterochromatin Protein-1 (HP1); Intrinsic Disorder; Lysine Methyltransferase 5C (KMT5C); Protein Compartmentalization; Protein Dynamics.


Conflict of interest statement

Disclosure and competing interests statement. The authors declare no competing interests.

Figures

Figure 1
Figure 1. Characterization of KMT5C dynamics within constitutive heterochromatin compartments.
(A) Time-lapse series of total (T) and partial (P) transiently transfected KMT5C-mEmerald fluorescence recovery after photobleaching (Movie EV1) in mouse NMuMG immortalized breast epithelial cells (n = 45) (see Methods). Representative images are shown for pre-bleach, post-bleach (0.3 s), 7.5 s, and 60 s. Kymographs show fluorescence prior to photobleaching and over the complete 60-s time series (indicated schematically on the right) with the corresponding intensity profile. Insets show fluorescence intensity using 16-color LUT. (B) Inverse FRAP (iFRAP) time series depicts the pre-bleach state, immediately after photobleaching the entire nucleus except for a single chromocenter, and at 30 min. (C) Relative fluoresce as a function of time is plotted on the right, which revealed an apparent efflux rate (ERapp) of 0.7%/min. Source data are available online for this figure.
Figure 2
Figure 2. Sequence features of the KMT5C heterochromatin retention domain.
(A) Alignment of representative heterochromatin retention domains (HRD) from mammals, birds, reptiles (lizards and snakes), and frogs. Conserved residues that make up each of the four sequence motifs (Φ1, His-Cys, Φ2, and Φ3) are highlighted in gray. A portion of the linker region is shown with the remaining number of residues indicated (linker). The extended region of homology overlapping with Φ3 in birds, reptiles, and frogs is shown in pink highlight. A gapless version of the same sequences is shown below as a WebLogo (Crooks et al, 2004) to illustrate sparse identity and the two conserved regions (CR1 and CR2). (B) Linker amino acid composition is shown as a heatmap for representative mammals, birds, reptiles, and frogs with the scale denoting column z-score. Disorder-promoting residues are boxed, and the overall disorder propensity for each linker is provided in the inverted bar graph below.
Figure 3
Figure 3. Determinants of HRD localization and dynamics.
(A) Schematic summary of HRD deletion (Δ) and point mutant (m) proteins. The Φ1, His, Cys, Φ2, linker, and Φ3 motifs are abbreviated as 1, H, C, 2, L, and 3. Point mutants are denoted by a light gray bar, while deletions are denoted by the absence of a bar. Each protein harbors a fluorescent fusion protein at its carboxyl terminus. (B) Representative live-cell images for the wild-type HRD and mutant proteins following transient transfection. The scale bar is 5 µm. For the Δ23 and m23 proteins, the inset includes the DAPI channel to demarcate the presence of chromocenters. (C) Heatmap depicting hierarchical clustering (c1, c2.1, c2.2, c2.3, c3, and c4) of HRD derivatives based on partition coefficient and fluorescence recovery at 5 and 100 s. Corresponding partition coefficient and FRAP recovery values are shown in graphs, together with the calculated mobile fraction from a double-term exponential curve fit. Filled boxes in the CR1 and CR2 rows summarize motif mutation status (red) within the HRD. For box plots, vertical lines indicate the bounds of the box and whiskers (minimum to maximum), and the box corresponds to the middle 50% of PC values (Q1–Q3), with the median indicated by a horizontal line. For FRAP and PC data, three separate experiments were conducted with a minimum of 15 cells each. Source data are available online for this figure.
Figure 4
Figure 4. Chromocenter partitioning behavior of wild-type and mutant HRD derivatives.
(A) Scatter plots depict normalized intensities for the indicated proteins in chromocenters (Y-axis) versus nucleoplasm (X-axis). Left, data for clusters 3 (WT HRD in Fig. 3) and 4 (CR1-intact in Fig. 3) proteins; center, data for cluster 2 from Fig. 3; right, data from cluster 1 in Fig. 3. Dashed line indicates equivalent intensity values for chromocenter and nucleoplasm that would generate a partition coefficient value of 1. The schematic in each graph depicts a chromocenter with influx and efflux properties of each group of HRD derivatives shown as arrows with line weights representative of relative rates (proportionality not to scale). (B) Saturation analysis of wild-type HRD partitioning and exchange. Left, partition coefficient (Y-axis) plotted as a function mean HRD nuclear intensity value (X-axis) with respective chromocenter intensity shown as a gradient (MPL-inferno). Inset, the corresponding plot for mean intensity values for the HRD in chromocenters (Y-axis) versus nucleoplasm (X-axis). Right, HRD fluorescence recovery at 100 s (X-axis) as a function of partition coefficient (Y-axis), which is shaded as a function of mean nuclear intensity into low (mean nuclear intensity = 81, range = 34–138, n = 40), medium (mean nuclear intensity = 222, range = 151–284, n = 13), and high (mean nuclear intensity = 555, range = 309–1150, n = 42) categories. Source data are available online for this figure.
Figure 5
Figure 5. Requirement for HP1 interactions for HRD localization and retention.
(A) Alignment of known chromo shadow domain interaction motifs from the indicated proteins. The five-residue core motif and upstream residues are highlighted in gray, with the central position numbered as “0” and flanking residues assigned accordingly (+2, −2, −6, and −7). The presence of isoleucine, leucine, or valine residues at the −6 or −7 positions are shown with red lettering. The 3-motifs that make up the im3 synthetic protein are indicated. For SENP7 and EMSY, which contain tandem motifs, both are shown together with the center-to-center distance. The compiled WebLogo motif is shown below the alignment. (B) Alignment of representative hydrophobic motifs (Φ1, Φ2, and Φ3) from HRD orthologs in mammal (Mus musculus), bird (Gallus gallus), reptile (Podarcis muralis), frog (Xenopus tropicalis), and turtle (Chelonia mydas). Annotation is as described for panel (A), with the WebLogo compiled from 244 motif occurrences in HRD orthologs. For birds, the red arrow indicates the removal of one residue to facilitate alignment. (C) Individual WebLogo representation of Φ1, Φ2, and Φ3 motif classes (number of sequences indicated). For Φ1, the Primate version is shown separately to highlight its unique sequence composition compared to occurrences in other mammals, birds, reptiles, frogs, and turtles. (D) Representative images for the CBX5MBD chimera in Suv39h1/2 wild-type (+/+) and null (−/−) MEFs with average PC values indicated. (E) Representative images showing im3 localization in Suv39h1/2 wild-type (+/+) and null (−/−) MEFs (upper panels) and upon CBX5MBD co-expression (bottom panels; mEmerald or mCherry fusion proteins is denoted by a green or red bar); average PC values indicated on top left. (F) representative images for HRD localization in Suv39h1/2 wild-type (+/+) and null (−/−) MEFs (upper panels) and upon CBX5MBD co-expression (bottom panels, mEmerald or mCherry fusion proteins is denoted by a green or red bar); average PC values indicated on top left. (G) Representative images for co-expression of HRD Δ23 (mEmerald) and CBX5MBD (mCherry) in Suv39h1/2 null (−/−) MEFs shows dependence of rescue on the Φ2 and Φ3 motifs; average PC values indicated on top left. (H) Representative images for co-expression of the im3 (mEmerald) and HRD (mCherry) proteins in Suv39h1/2 wild-type MEFs shows displacement of im3 by the HRD; average PC values indicated on top left. The scale bar is 5 µm. Images in panels (DH) were derived from transiently transfected cells. For PC data, three separate experiments were conducted with a minimum of 15 cells each. Source data are available online for this figure.
Figure 6
Figure 6. Contributions of the linker region to HRD chromocenter retention.
(A) Sequence features of HRD natural and chimeric linkers. Five representative linker sequences from the indicated species classes (Mammal, Bird, Reptile, and Frog) are shown in comparison to the five chimeric sequences (IDR1-5). For each, heatmaps show net charge per residue (NCPR), fraction of charged residues (FCR), and fraction of disorder-promoting (DP) amino acid residues. Corresponding intensity scales for each feature are shown below the heatmap. (B) EMBOSS charge profiles are shown for the 40-residue chimeric IDR linker series to illustrate the distribution of positive (K and R in blue) and negative (D and E in red) amino acids (intensity scale shown on right). Based on increasing FCR and CIDER analysis, linkers are assigned to categories that include compact globules (CG, category 1), Flory random coils (FRC, category 3), or self-avoiding random coils (SARC, category 4). (C) Representative images for HRD linker chimeras in NMuMG cells (top row) or upon co-transfection with CBX5MBD in Suv39h1/2 null cells (bottom row). The red and blue bars distinguish images corresponding to linkers with either negative or positive NCPR values. Images were derived from transiently transfected cells. The scale bar is 5 µm. Average PC values are indicated on the top left of each image. (D) Summary of average PC values for the HRD and IDR chimeras in Suv39h1/2 wild-type (CD-CSD and H3K9me3+) or null (MBD-CSD and H3K9me3−) cells. Differences in linker functional length are shown as a gradient (from left to right), the magnitude of NCPR for each linker is shown in panel (A), and FCR is plotted below with a separate scale. For PC data, three separate experiments were conducted with a minimum of 15 cells each. Source data are available online for this figure.
Figure 7
Figure 7. Mechanistic overview of drivers of HRD retention and partitioning.
Cooperativity in wild-type cells (left panel) involves both the chromodomain (CD) and chromo shadow domain (CSD) of HP1 (left). This is modeled as an avidity-driven process involving CD binding of H3K9me3 (lollipop) and additional nucleosome engagement by CR1 to increase affinity. Tethering to CR2 facilitates HP1 effective concentration (Ceff) to confer elevated affinity and retention. The linker influence on cooperativity is shown as a function of partitioning (decreasing from top to bottom) with linkers colored according to NCPR (as in Fig. 6). On the right, the CBX5MBD binding mode is shown, which involves DNA engagement by the MBD. In the absence of H3K9me3 and CD involvement, the Φ1, H, and C motifs appear to make minimal contributions (depicted as a partial mask over CR1), such that increased effective concentration is acquired largely through CSD interactions with Φ2 and CR2 (Φ3). For this mode, the wild-type HRD shows inferior partitioning in comparison to the IDR2-5 chimeras, whose partitioning overall is highly correlated to functional length.
Figure EV1
Figure EV1. Characterization of HRD dynamics within constitutive heterochromatin compartments.
(A) Time-lapse series of total (T) and partial (P) HRD-mEmerald fluorescence recovery after photobleaching (Movie EV2) in mouse NMuMG immortalized breast epithelial cells (n = 45) (see Methods). Representative images are shown for pre-bleach, post-bleach (0.3 s), 9 s, and 60, and represent transiently transfected cells. Insets show fluorescence intensity using 16-color LUT. Asterisk denotes Hoechst channel to indicate presence of chromocenter.
Figure EV2
Figure EV2. WebLogo depiction for the HRD CR1 from representative mammals, birds, and reptiles.
The WebLogo (Crooks et al, 2004) is derived from the indicated number of sequences in each species. Key conserved features between classes are noted with arrows to account for differences in spacing. The frog version was omitted because the corresponding sequences show more variability in spacing between the histidine and cysteine residues. Detailed information regarding CR2 is provided in Fig. 5.
Figure EV3
Figure EV3. Complete FRAP and partitioning data for KMT5C, HRD, and corresponding derivatives.
(A) FRAP curves (relative fluorescence vs. time) depict profiles for total (red) and partial (black) photobleaching of chromocenters for KMT5C and the HRD (superimposed), m1 (Φ1 mutant), mH (histidine mutant), mC (cysteine mutant), m2 (Φ2 mutant), m3 (Φ3 mutant), ΔL (linker deletion), Δ1HC (Φ1-histidine-cysteine deletion), Δ1HC2 (Φ1-histidine-cysteine-Φ2 deletion), Δ3 (Φ3 deletion), Δ23 (Φ2-Φ3 deletion), m23 (Φ2-Φ3 mutation). With the exception of m23, where recovery was monitored with higher sampling over a 15-second period, the remaining graphs show recovery from 0 to 100 s. (B) Partition coefficients (normalized chromocenter intensity divided by normalized nucleoplasmic intensity; see methods) are shown for the indicated proteins. Clusters (c1–c4) correspond to those in Fig. 3c. In FRAP plots, vertical lines correspond to the standard deviation of the mean. For box plots, vertical lines indicate the bounds of the box and whiskers (minimum to maximum) and the box corresponds to middle 50% of PC values (Q1–Q3) with the median indicated by a horizontal line. For FRAP and PC data, three separate experiments were conducted with a minimum of 15 cells each.
Figure EV4
Figure EV4. Partition coefficient data for Suv39h1/2 (wild-type and null) and CBX5MBD rescue experiments.
(A) Partition coefficients (normalized chromocenter intensity divided by normalized nucleoplasmic intensity; see methods) are shown for the indicated proteins (single or co-transfection) and cell conditions (Suv39h1/2 wild-type and null MEFs) from Fig. 5. (B) Partition coefficient data for CBX5MBD rescue of all remaining mutant proteins from Fig. 3. For box plots, vertical lines indicate bounds of box and whiskers (minimum to maximum) and the box corresponds to middle 50% of PC values (Q1–Q3) with the median indicated by a horizontal line. For PC data, three separate experiments were conducted with a minimum of 15 cells each.
Figure EV5
Figure EV5. Disorder plot for representative KMT5C orthologs.
Graph depicts Metapredict disorder propensity (0 being lowest and 1 being highest) for KMT5C orthologs from Homo sapiens (Hs), Mus musculus (Mm), Gallus gallus (Gg), Podarcis muralis (Pm), and Xenopus tropicalis (Xt) that have been anchored to the amino-terminal catalytic region (NH/SET). For each species, the location of the CR1 region is noted by a square and the CR2 region by a circle. For the longer Pm and Xt proteins, the presence of potential additional hydrophobic motifs (Φ+) in the region between the CR1 and CR2 motifs are noted.
Figure EV6
Figure EV6. Complete FRAP and partitioning data for HRD chimeras.
(A) FRAP curves (relative fluorescence vs. time) depict profiles for total (red) and partial (black) photobleaching for the HRD-IDR chimeras in NMuMG cells from 0 to 100 s. (B) Partition coefficients (normalized chromocenter intensity divided by normalized nucleoplasmic intensity; see methods) are shown for the indicated proteins in both wild-type and Suv39h1/2 null conditions with co-expression of CBX5MBD. In FRAP plots, vertical lines correspond to the standard deviation of the mean. For box plots, vertical lines indicate the bounds of the box and whiskers (minimum to maximum) and the box corresponds to middle 50% of PC values (Q1–Q3) with the median indicated by a horizontal line. For FRAP and PC data, three separate experiments were conducted with a minimum of 15 cells each.

References

    1. Altschul SF, Gish W, Miller W, Myers EW, Lipman DJ (1990) Basic local alignment search tool. J Mol Biol 215:403–410 - PubMed
    1. Arganda-Carreras I, Kaynig V, Rueden C, Eliceiri KW, Schindelin J, Cardona A, Sebastian Seung H (2017) Trainable Weka segmentation: a machine learning tool for microscopy pixel classification. Bioinformatics 33:2424–2426 - PubMed
    1. Babicki S, Arndt D, Marcu A, Liang Y, Grant JR, Maciejewski A, Wishart DS (2016) Heatmapper: web-enabled heat mapping for all. Nucleic Acids Res 44:W147–W153 - PMC - PubMed
    1. Banani SF, Rice AM, Peeples WB, Lin Y, Jain S, Parker R, Rosen MK (2016) Compositional control of phase-separated cellular bodies. Cell 166:651–663 - PMC - PubMed
    1. Belaghzal H, Borrman T, Stephens AD, Lafontaine DL, Venev SV, Weng Z, Marko JF, Dekker J (2021) Liquid chromatin Hi-C characterizes compartment-dependent chromatin interaction dynamics. Nat Genet 53:367–378 - PMC - PubMed

MeSH terms

Substances

LinkOut - more resources