. 2025 Feb;39(2):296-307.
doi: 10.1038/s41375-024-02462-w. Epub 2024 Nov 19.

Polycomb group protein Mel18 inhibits hematopoietic stem cell self-renewal through repressing the transcription of self-renewal and proliferation genes

Affiliations

Polycomb group protein Mel18 inhibits hematopoietic stem cell self-renewal through repressing the transcription of self-renewal and proliferation genes

Wenjie Cai et al. Leukemia. 2025 Feb.

Abstract

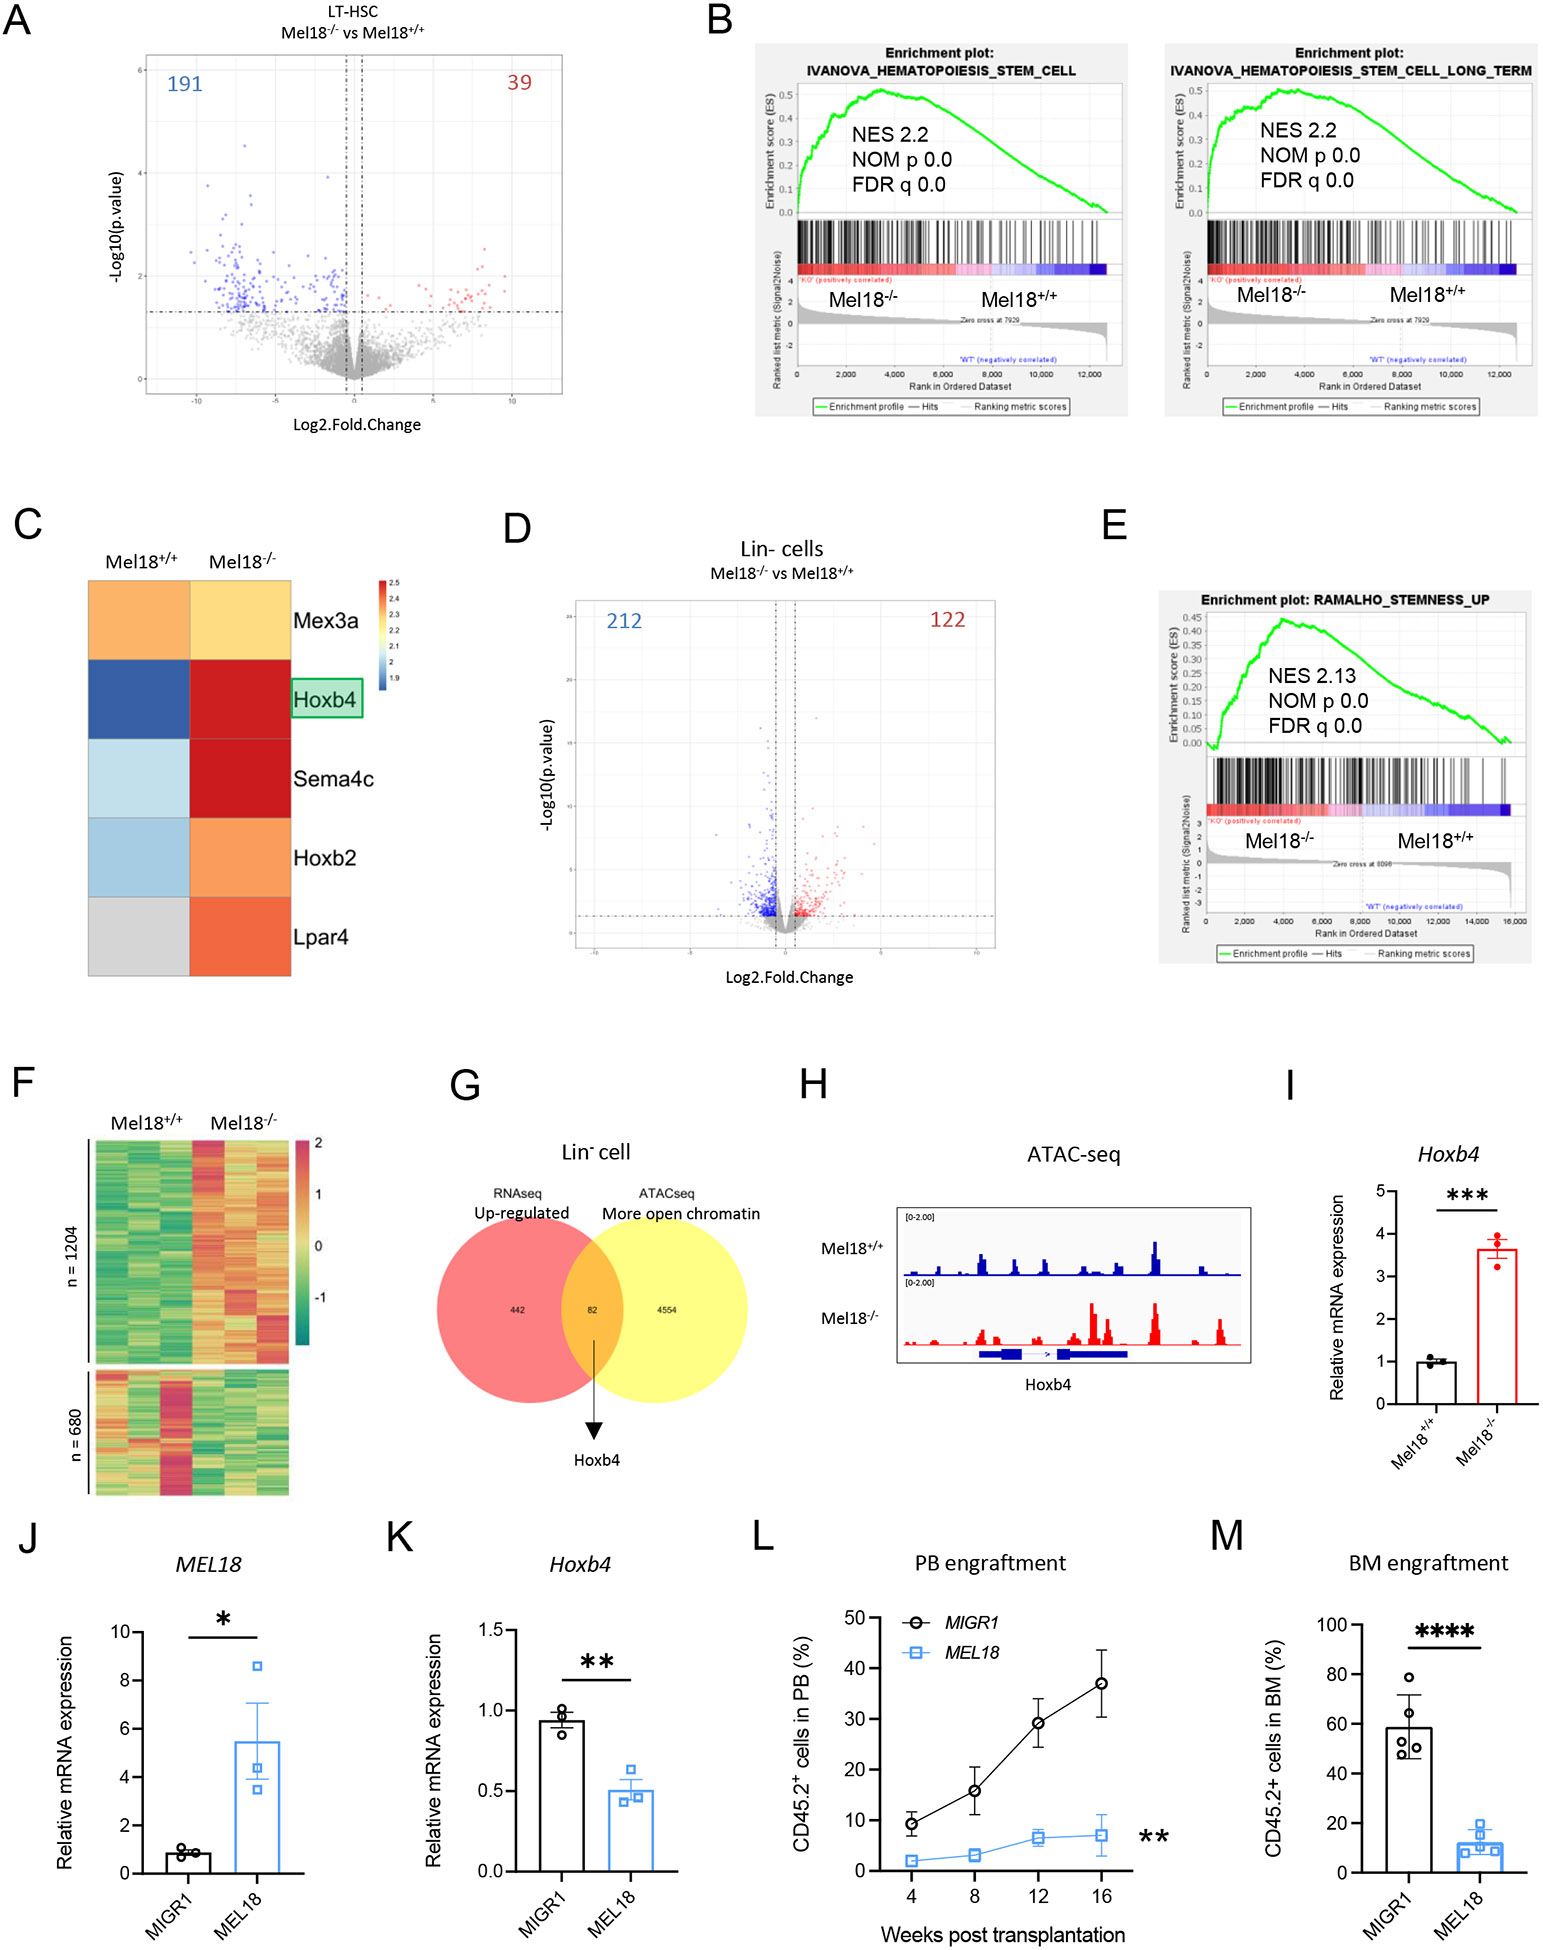
Polycomb group (PcG) proteins play important roles in hematopoietic stem cell (HSC) self-renewal. Mel18 and Bmi1 are homologs of the PCGF subunit within the Polycomb repressive complex 1 (PRC1). Bmi1 (PCGF4) enhances HSC self-renewal and promotes terminal differentiation. However, the role of Mel18 (PCGF2) in hematopoiesis is not fully understood and how Mel18 regulates gene transcription in HSCs remains elusive. We found that acute deletion of Mel18 in the hematopoietic compartment significantly increased the frequency of functional HSCs in the bone marrow. Furthermore, we demonstrate that Mel18 inhibits HSC self-renewal and proliferation. RNA-seq studies revealed that HSC self-renewal and proliferation gene signatures are enriched in Mel18-/- hematopoietic stem and progenitors (HSPCs) compared to Mel18+/+ HSPCs. Notably, ATAC-seq revealed increased chromatin accessibility at genes important for HSC self-renewal, whereas CUT&RUN showed decreased enrichment of H2AK119ub1 at genes important for proliferation, leading to increased expression of both Hoxb4 and Cdk4 in Mel18-/- HSPCs. Thus, we demonstrate that Mel18 inhibits hematopoietic stem cell self-renewal through repressing the transcription of genes important for HSC self-renewal and proliferation.


Conflict of interest statement

Competing interests: The authors declare no competing interests. Ethics approval and consent to participate: All methods were performed in accordance with the relevant guidelines and regulations. We have complied with all the relevant ethical regulations for animal testing and research. All animal-related experiments have received ethical approval from both Indiana and Northwestern University Institutional Animal Care and Use Committee (IACUC).

Figures

Fig. 1
Fig. 1. Loss of Mel18 increases the number of immunophenotypic hematopoietic stem cells.
A Schematic of deleting Mel18 in the hematopoietic system of Mel18fl/fl-Mx1-Cre+ mice following pI:pC treatment. pI:pC treated Mel18fl/fl and Mel18fl/fl-Mx1-Cre+ mice are defined as Mel18+/+ and Mel18−/− mice, respectively. B Expressions of Mel18 and Bmi1 in Mel18+/+ and Mel18−/− HSCs; n= 3 biological replicates. C Bone marrow (BM) cellularity of Mel18+/+ and Mel18−/− mice; n = 9 mice per genotype. D Absolute numbers of LT-HSCs, ST-HSCs, and MPPs in the BM of Mel18+/+ and Mel18−/− mice; n = 5 mice per genotype. E Absolute numbers of CMPs, GMPs, and MEPs in the BM of Mel18+/+ and Mel18−/− mice; n = 6 mice per genotype. F Absolute number of lineage negative (Lin) and cKIT+ cells in the BM of Mel18+/+ and Mel18−/− mice; n = 6 mice per genotype. G Frequency of myeloid cells (Gr1+), B cells (B220+), and T cells (CD3+) in the BM of Mel18+/+ and Mel18−/− mice; n = 6 mice per genotype. H-I Serial replating assays using Mel18+/+ and Mel18−/− BM mononuclear cells. The methylcellulose cultures were serially replated, weekly, for 3 weeks; n = 3 independent experiments performed in triplicates. Data are represented as mean ± SEM. ns, not statistically significant, *P < 0.05, **P < 0.01, ****P < 0.0001.
Fig. 2
Fig. 2. Loss of Mel18 enhances HSC self-renewal in vivo.
A Schematic of competitive transplantation assays using BM cells isolated from Mel18+/+ and Mel18−/− mice. B The percentage of donor-derived cells in PB of recipient mice in primary transplantation assays; n = 7 mice per group. C The percentage of donor-derived cells in the PB of recipient mice in secondary transplantation assays; n = 8 mice per group. D Measuring the number of functional HSCs in the BM of Mel18+/+ and Mel18−/− mice utilizing limiting dilution transplantation assays. Recipients with < 2% donor-derived cells in PB were defined as non-respondent: n = 4-10 mice per group. E Poisson statistical analysis of limiting dilution transplantation data from Figure 2D using L-Calc software. Shapes represent the percentages of negative mice for each cell dose, solid lines indicate the best-fit linear model, and dotted lines represent 95% CIs. F Measuring the number of functional HSCs in the BM of Mel18+/+ and Mel18−/− mice utilizing limiting dilution transplantation assays. G Schematic of HSC transplantation assays using LT-HSCs isolated from Mel18+/+ and Mel18−/− mice. H The percentage of donor-derived cells in PB of recipient mice in primary HSC transplantation assays; n = 7 mice per group. I The percentage of donor-derived cells in PB of recipient mice in secondary transplantation assays; n = 8 mice per group. J The absolute number of donor-derived hematopoietic stem and progenitors in the BM of recipient mice at 16 weeks after secondary transplantation; n = 7 mice per group. K The absolute number of donor-derived myeloid progenitors in the BM of recipient mice at 16 weeks after secondary transplantation; n = 7 mice per group. L 10 million BM cells (CD45.2+) from Mel18+/+ and Mel18−/− mice were transplanted into lethally irradiated recipient mice (CD45.1+). 18 hours after transplantation, the percentage of donor-derived CD150LSKs in the BM of recipient mice was determined by flow cytometry; n=5 mice per group. Data are represented as mean ± SEM. ns, not statistically significant, *P<0.05, **P<0.01, ***P<0.001, ****P<0.0001.
Fig. 3
Fig. 3. Loss of Mel18 promotes HSPC proliferation.
A Apoptosis assays of CD34LSKs using Annexin V and DAPI staining and followed by flow cytometry analysis. B The quantification of apoptotic CD34+LSKs and myeloid progenitor cells; n = 4-6 mice per genotype. C Quiescence assays using Ki67 and DAPI staining and followed by flow cytometry analysis. D The number of quiescent LSKs and CD34LSKs in the BM of Mel18+/+ and Mel18−/− mice; n=4-9 mice per genotype. E Cell cycle analysis of Mel18+/+ and Mel18−/− LSKs using BrdU uptake and DAPI staining followed by flow cytometry analysis. F The frequency of Mel18+/+ and Mel18−/− LSKs in different phases of the cell cycle; n = 3-4 mice per genotype. Data are represented as mean ± SEM. *P<0.05, **P<0.01.
Fig. 4
Fig. 4. Mel18 represses gene expression in HSPCs through altering chromatin accessibility.
A Volcano plots of −log10 (p value) against log2 fold change representing the differences in gene expression, related to RNA-seq analysis, in Mel18−/− versus Mel18+/+ LT-HSCs. Upregulated (red) and downregulated (blue) genes are highlighted. B Gene set enrichment analysis (GSEA) using differentially expressed genes (DEG) from Mel18+/+ and Mel18−/− LT-HSC RNA-seq analysis. C Heatmaps of HSC genes from RNA-seq analysis of Mel18+/+ and Mel18−/− LT-HSCs. The processed FPKM (reads per kilobase of exon per million reads mapped) values for each gene were used to calculate z scores used to generate the heatmap. D Volcano plots of −log10 (p value) against log2 fold change representing the differences in gene expression, related to RNA-seq analysis, in Mel18−/− versus Mel18+/+ Lin cells. Upregulated (red) and downregulated (blue) genes are highlighted. E GSEA of DEG from RNA-seq assays in Mel18+/+ and Mel18−/− Lin cells. F Heatmap showing differentially changed chromatin accessibility in Mel18−/− Lin cells when compared to the Mel18+/+ group, n=3 biological replicates per genotype. G Venn diagrams showing the overlap of upregulated genes in Mel18−/− Lin cell RNA-seq and genes with increased chromatin accessibility in Mel18−/− Lin cell ATAC-seq. Cutoffs for NGS data are ∣Log2 Fold Change∣>0.4 and p-value < 0.05. H Genome browser of ATAC-seq peaks at Hoxb4 locus in Mel18+/+ and Mel18−/− Lin cells. I Expression of Hoxb4 in Mel18+/+ and Mel18−/− Lin cells. n=3 mice per genotype. J-K Expression of Mel18 and Hoxb4 in wild type HSPCs expressing either GFP or MEL18; n = 3 biological replicates. L The frequency of donor-derived cells (CD45.2+) in peripheral blood of primary recipient mice at 4-week, 8-week,12-week, and 16-week after transplantation; n= 5 mice per group. M The frequence of donor-derived cells in the BM of recipient mice at 16 weeks post transplantation; n = 5 mice per group. Data are represented as mean ± SEM. *P<0.05, **P<0.01, ***P<0.001, ****P<0.0001.
Fig. 5
Fig. 5. Loss of Mel18 increases the expression cell cycle related genes in HSPCs.
A-C GSEA analysis using differentially expressed genes from Mel18+/+ and Mel18−/− LT-HSC RNA-seq analysis. D Expression of p15, p16, p18, and p19 in Mel18+/+ and Mel18−/− HSPCs; n = 3-4 biological replicates. E-G Expression of Ccnd2, Cdk4, and Cdk6 in Mel18+/+ and Mel18−/− HSPCs; n = 3-4 biological replicates. H-K Expression of Ccnd2, Cdk2, Cdk4, and Cdk6 in wild type HSPCs with ectopic expression of either GFP or MEL18; n = 3 biological replicates. L Representative Ring1b and control IgG ChIP-seq profiles of loci occupied by Ring1b in murine megakaryoblastic cell line L8057. Data are represented as mean ± SEM. *P<0.05, **P<0.01, ***P<0.001, ****P<0.0001.
Fig. 6
Fig. 6. Mel18 represses the expression of cell cycle related genes through altering the distribution of H2AK119ub1 on chromatin.
A Global H2AK119ub1 levels in Mel18+/+ and Mel18−/− BM and Lin cells as determined by immunoblot analysis. B Volcano plots of −log10 (p value) against fold change representing the differences in H2AK119ub1 peaks, related to CUT&RUN analysis, in Mel18−/− versus Mel18+/+ Lin cells. Upregulated (red) and downregulated (blue) genes are highlighted. C Heatmaps of H2AK119ub1 analysis in Mel18+/+ and Mel18−/− Lin cells. CUT&RUN analyses were performed using duplicate samples. The processed FPKM (reads per kilobase of exon per million reads mapped) values for each H1AK119ub1-associated gene were used to calculate z scores used to generate the heatmap. D Pie chart of the genomic distribution of down-regulated H2AK119ub1 in Mel18−/− Lin cells. E Gene ontology (GO) analysis using genes with decreased H2AK119ub1 at promoter regions in Mel18−/− Lin cells compared to Mel18+/+ Lin cells. F-G H2AK119ub1 occupancy at Cdk4 and Cdk6 loci in Mel18+/+ and Mel18−/− Lin cells.

References

    1. Kondo M, Wagers AJ, Manz MG, Prohaska SS, Scherer DC, Beilhack GF, et al. Biology of Hematopoietic Stem Cells and Progenitors: Implications for Clinical Application. Annu Rev Immunol. 2003;21:759–806. - PubMed
    1. Attar EC, Scadden DT. Regulation of hematopoietic stem cell growth. Leukemia. 2004;18:1760–8. - PubMed
    1. Sorrentino BP. Clinical strategies for expansion of haematopoietic stem cells. Nat Rev Immunol. 2004;4(11):878–88. - PubMed
    1. Walasek MA, van Os R, de Haan G. Hematopoietic stem cell expansion: challenges and opportunities. Ann N Y Acad Sci. 2012;1266:138–50. - PubMed
    1. Akala OO, Clarke MF. Hematopoietic stem cell self-renewal. Curr Opin Genet Dev. 2006; 16:496–501. - PubMed

Substances

LinkOut - more resources