. 2025 Jan;23(1):4-16.
doi: 10.1111/pbi.14458. Epub 2024 Nov 19.

Plant-produced SARS-CoV-2 antibody engineered towards enhanced potency and in vivo efficacy

Affiliations

Plant-produced SARS-CoV-2 antibody engineered towards enhanced potency and in vivo efficacy

Steven W de Taeye et al. Plant Biotechnol J. 2025 Jan.

Abstract

Prevention of severe COVID-19 disease by SARS-CoV-2 in high-risk patients, such as immuno-compromised individuals, can be achieved by administration of antibody prophylaxis, but producing antibodies can be costly. Plant expression platforms allow substantial lower production costs compared to traditional bio-manufacturing platforms depending on mammalian cells in bioreactors. In this study, we describe the expression, production and purification of the originally human COVA2-15 antibody in plants. Our plant-produced mAbs demonstrated comparable neutralizing activity with COVA2-15 produced in mammalian cells. Furthermore, they exhibited similar capacity to prevent SARS-CoV-2 infection in a hamster model. To further enhance these biosimilars, we performed three glyco- and protein engineering techniques. First, to increase antibody half-life, we introduced YTE-mutation in the Fc tail; second, optimization of N-linked glycosylation by the addition of a C-terminal ER-retention motif (HDEL), and finally; production of mAb in plant production lines lacking β-1,2-xylosyltransferase and α-1,3-fucosyltransferase activities (FX-KO). These engineered biosimilars exhibited optimized glycosylation, enhanced phagocytosis and NK cell activation capacity compared to conventional plant-produced S15 and M15 biosimilars, in some cases outperforming mammalian cell produced COVA2-15. These engineered antibodies hold great potential for enhancing in vivo efficacy of mAb treatment against COVID-19 and provide a platform for the development of antibodies against other emerging viruses in a cost-effective manner.

Keywords: SARS‐CoV‐2; antibody; effector function; engineering; glycosylation; structure.


Conflict of interest statement

Véronique Gomord is co‐founder, board member, and CSO of Angany Inc and CEO of Angany InnovationL, Louis‐Philippe Vezina is co‐founder of Angany Inc, Réjean Desgagnés, Loïc Faye, Anne‐Catherine Fitchette, Virginie Catala‐Stordeur, Bertrand Morel, Lucie Mirande, Guillaume Beauverger are employees of Angany Inc. or Angany Innovation.

Figures

Figure 1
Figure 1
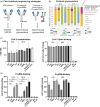
Therapeutic activity of plant‐produced SARS‐CoV‐2 antibody COVA2‐15. (a) Structural information on interaction between human COVA2‐15 antibody and SARS‐CoV‐2 spike protein. The left panel shows a 3.9 Å cryo‐EM structure of three COVA2‐15 Fab domains in complex with the Wuhan SARS‐CoV‐2 6P‐mut7 spike (PDB: 9aru). SARS‐CoV‐2 spike is depicted in a surface representation and COVA2‐15 Fab domains are depicted as orange (HC) and yellow (LC) ribbon cartoon. Middle and right panels show the crystal structure (PDB: 9B82) of COVA2‐15 in complex with the RBD of Wuhan spike, where critical contact residues in CDRH3 are displayed in a stick format. Two separate panels illustrate the interaction of COVA2‐15 with E484 and N501, residues subject to escape mutations in emerging variants after Wuhan. (b) Work‐flow of production of antibodies in N. benthamiana plants. Four days post transfection, leaves are harvested and the green juice is subjected to a one‐step Protein A magnetic purification strategy to isolate the plant‐produced antibodies. (c) Binding of human and plant‐produced antibodies (S15/M15) to SARS‐CoV‐2 Spike (Wuhan) and RBD (Wuhan) as determined by ELISA or BLI, respectively. One representative antibody titration experiment shows binding of antibodies to SARS‐CoV‐2 in ELISA. Data from one representative BLI experiment are plotted in which antibodies were used at a concentration of 100 nM. (d) SARS‐CoV‐2 neutralization by plant and human produced COVA2‐15 variants using an antibody serial dilution with a start concentration of 1 nM. Right panel shows mean IC50 values ±SD of at least three individual measurements. Statistical differences are determined using an ordinary one‐way ANOVA corrected with a Kruskal–Wallis multiple comparison test and are indicated with asterisks, *P < 0.05, **P < 0.01. (e) Schematic representation of the experiment: Syrian hamsters were infected via IN route with 10 000 PFU of SARS‐CoV‐2, treated via IP route with 10 mg/mL of COVA2‐15, M15, S15 or no Ab treatment on Day 1 and euthanized on Day 3; Lungs viral load on day 3 post challenge, P‐values are shown for significant difference. Statistical differences are determined using an ordinary one‐way ANOVA with Tukey's multiple comparisons test and are indicated with asterisks, **P < 0.01.
Figure 2
Figure 2
Engineering strategies to produce antibodies in plants with enhanced therapeutic activity. (a) Illustration of three engineering strategies (YTE, HDEL and FX) that were used to further improve plant‐produced COVA2‐15 antibodies. YTE mutations (M252Y/S254T/T256E) are introduced in the Fc domain to enhance Ab half‐life. The C‐terminal HDEL retention signal prevents Golgi trafficking and thereby alters N‐linked glycosylation. Production of antibody in fucosyl/xylosyl (FX) transferase knock out plants inhibits fucosylation and xylosylation of antibodies. (b) Depiction of N‐linked glycosylation forms of all human and plant‐produced antibody variants as determined by mass spectrometry. A terminal residue based nomenclature is used to specify the N‐linked glycoforms (Altmann et al., 2024). Coloured bar graphs show the prevalence of each glycoform (or group of glycoforms) for each individual antibody. A schematic illustration of the most prevalent glycoforms is depicted below to enhance visualization. (c) Binding of plant‐produced S15 variants (light grey), plant‐produced M15 variants (dark grey) and mammalian produced COVA2‐15 (black) to SARS‐CoV‐2 Spike (Wuhan) as determined with an IgG ELISA. SARS‐CoV‐2 neutralization by plant and human produced COVA2‐15 antibodies plotted as IC50 values. (d) FcγRIIa and FcγRIIIa binding to antigen bound COVA2‐15 variants, as determined by FcγR‐dimer ELISA. AUC values derived from full titration curves (Figure S2) are plotted of at least two individual measurements. Statistical differences are determined using an ordinary one‐way ANOVA corrected with a Dunns multiple comparison test and are indicated with asterisks,   ***P < 0.001.
Figure 3
Figure 3
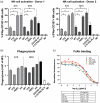
Fc effector function of glyco‐engineered plant produced COVA2‐15 antibodies. (a) NK cell activation by plant‐produced S15 variants (light grey), plant‐produced M15 variants (dark grey) and mammalian produced COVA2‐15 (black) is plotted as the percentage of CD107+ IFNγ+ double‐positive NK‐cells after incubation with antigen‐bound antibodies in a plate based NK cell activation assay. NK cell activation was determined with MACS negatively selected NK cells from two healthy blood donors. Statistical differences are determined using a Mann–Whitney t‐test and are indicated with asterisks, *P < 0.05. (b) Antibody dependent cellular phagocytosis (ADCP) determined by the internalization of SARS‐CoV‐2 spike coated fluorescent beads in the presence of plant‐produced S15 variants (light grey), plant‐produced M15 variants (dark grey) and mammalian produced COVA2‐15 (black). AUC values derived from full titration curves (Figure S3c) are plotted from two individual measurements. (c) Binding of S15 variants to the neonatal Fc receptor (FcRn) as determined with an FcRn‐SmBiT luminescence assay. Normalized luminescence was calculated by assigning 100% to maximum signal in the absence of an analyte and then calculating percentage of maximum signal in the presence of an analyte. Mean IC50 values ±standard deviation of two individual measurements is depicted.

References

    1. Adams, P.D. , Afonine, P.V. , Bunkóczi, G. , Chen, V.B. , Davis, I.W. , Echols, N. , Headd, J.J. et al. (2010) PHENIX: A comprehensive Python‐based system for macromolecular structure solution. Acta Crystallogr. D Biol. Crystallogr. 66, 213–221. - PMC - PubMed
    1. Afonine, P.V. , Poon, B.K. , Read, R.J. , Sobolev, O.V. , Terwilliger, T.C. , Urzhumtsev, A. and Adams, P.D. (2018) Real‐space refinement in PHENIX for cryo‐EM and crystallography. Acta Crystallogr. D. Struct. Biol. 74, 531–544. - PMC - PubMed
    1. Altmann, F. , Helm, J. , Pabst, M. and Stadlmann, J. (2024) Introduction of a human‐ and keyboard‐friendly N‐glycan nomenclature. Beilstein J. Org. Chem. 20, 607–620. - PMC - PubMed
    1. Anand, S.P. , Ding, S. , Tolbert, W.D. , Prévost, J. , Richard, J. , Gil, H.M. , Gendron‐Lepage, G. et al. (2021) Enhanced ability of plant‐derived PGT121 glycovariants to eliminate HIV‐1‐infected cells. J. Virol. 95, 10‐1128. - PMC - PubMed
    1. Barad, B.A. , Echols, N. , Wang, R.Y.‐R. , Cheng, Y. , DiMaio, F. , Adams, P.D. and Fraser, J.S. (2015) EMRinger: side chain–directed model and map validation for 3D cryo‐electron microscopy. Nat. Methods 12, 943–946. - PMC - PubMed