. 2024 Nov 19;22(1):1044.
doi: 10.1186/s12967-024-05835-y.

Gut metatranscriptomics based de novo assembly reveals microbial signatures predicting immunotherapy outcomes in non-small cell lung cancer

Affiliations

Gut metatranscriptomics based de novo assembly reveals microbial signatures predicting immunotherapy outcomes in non-small cell lung cancer

David Dora et al. J Transl Med. .

Abstract

Background: Advanced-stage non-small cell lung cancer (NSCLC) poses treatment challenges, with immune checkpoint inhibitors (ICIs) as the main therapy. Emerging evidence suggests the gut microbiome significantly influences ICI efficacy. This study explores the link between the gut microbiome and ICI outcomes in NSCLC patients, using metatranscriptomic (MTR) signatures.

Methods: We utilized a de novo assembly-based MTR analysis on fecal samples from 29 NSCLC patients undergoing ICI therapy, segmented according to progression-free survival (PFS) into long (> 6 months) and short (≤ 6 months) PFS groups. Through RNA sequencing, we employed the Trinity pipeline for assembly, MMSeqs2 for taxonomic classification, DESeq2 for differential expression (DE) analysis. We constructed Random Forest (RF), Support Vector Machine (SVM), and Extreme Gradient Boosting (XGBoost) machine learning (ML) algorithms and comprehensive microbial profiles.

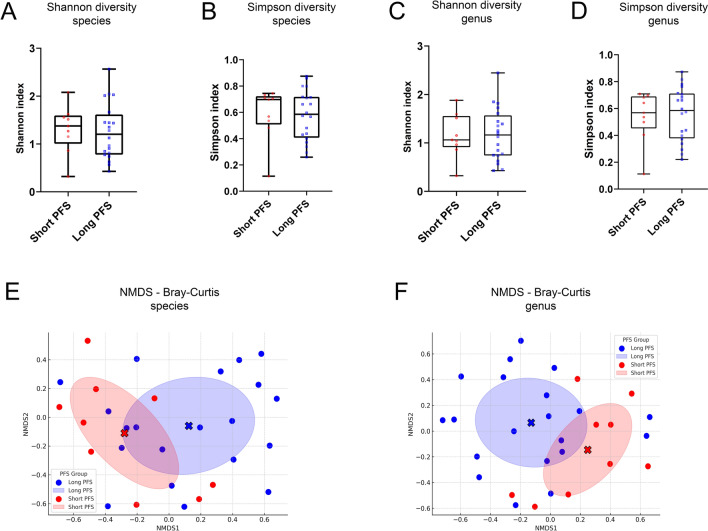
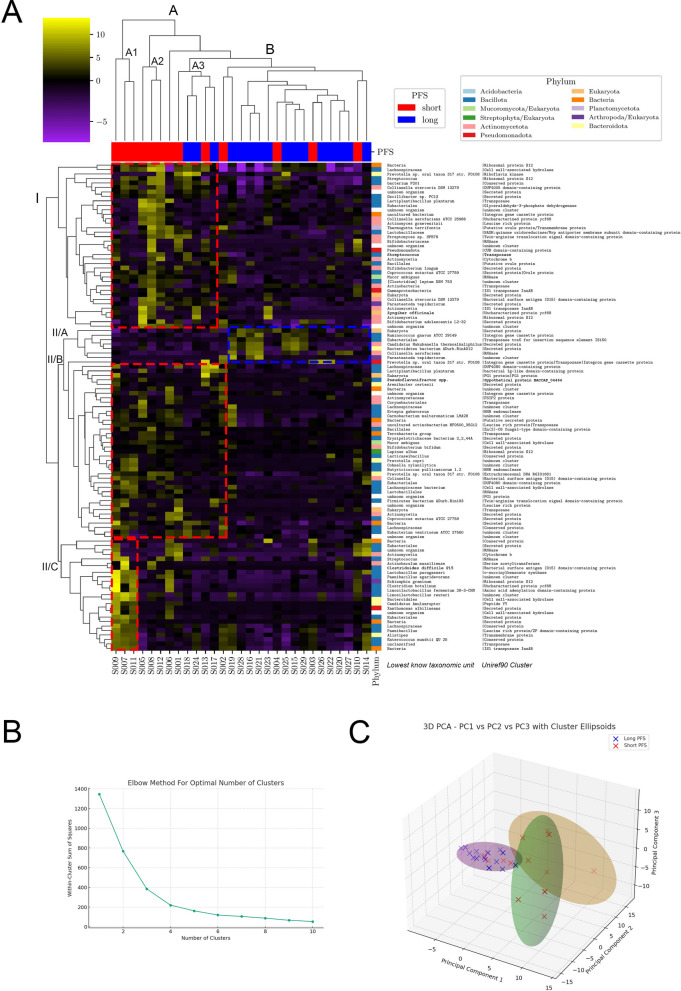
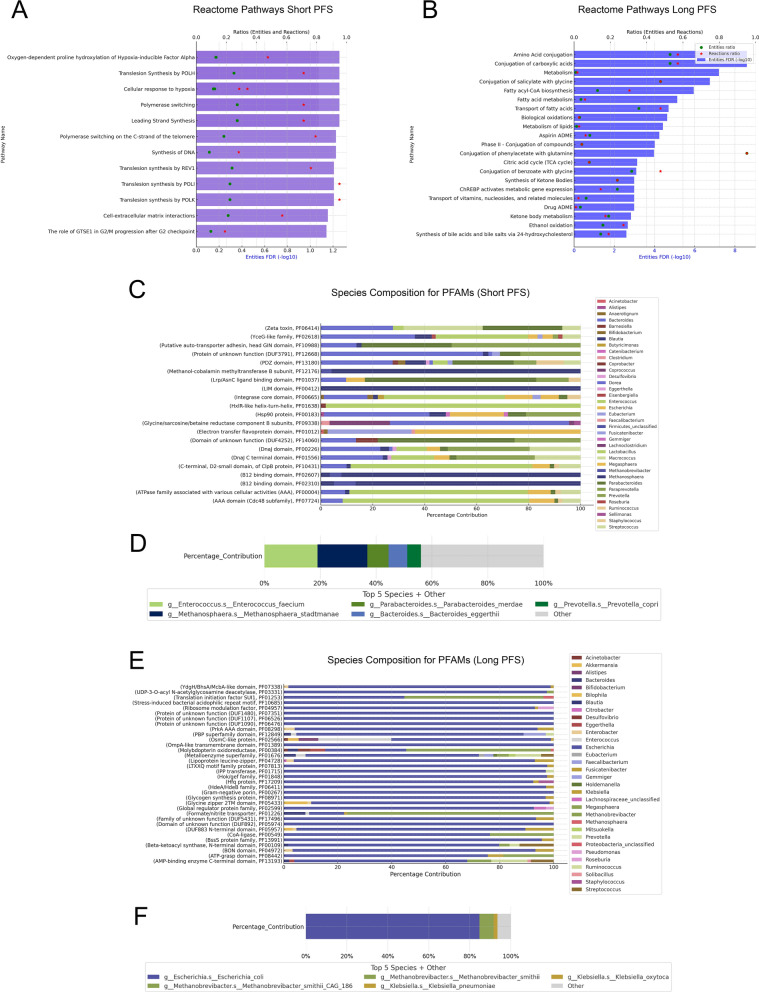
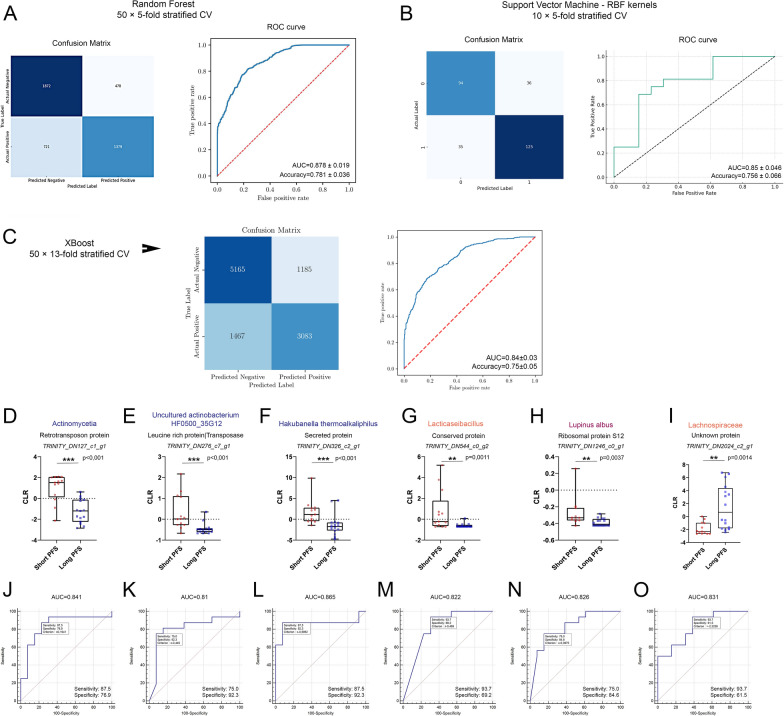
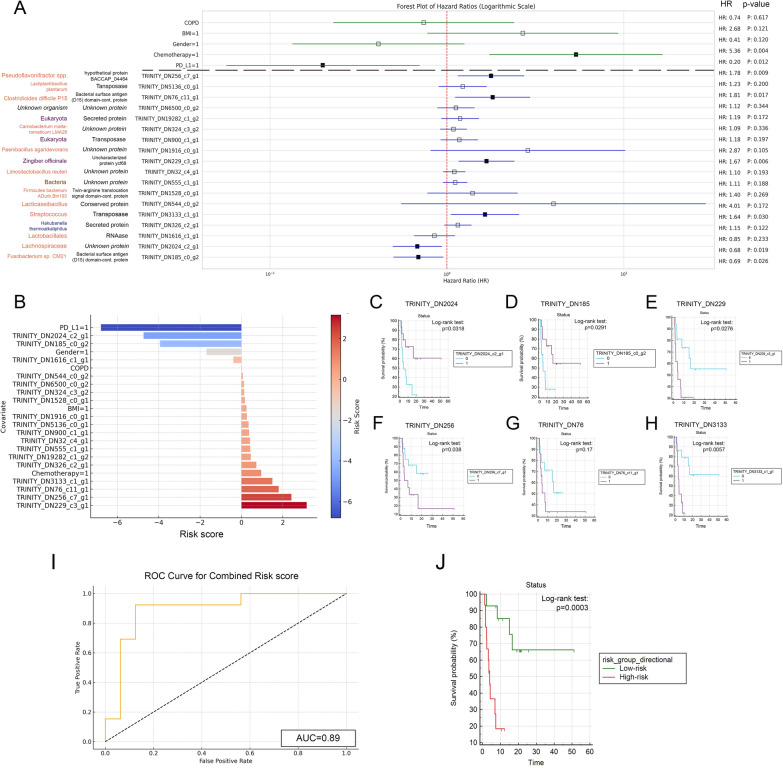
Results: We detected no significant differences concerning alpha-diversity, but we revealed a biologically relevant separation between the two patient groups in beta-diversity. Actinomycetota was significantly overrepresented in patients with short PFS (vs long PFS, 36.7% vs. 5.4%, p < 0.001), as was Euryarchaeota (1.3% vs. 0.002%, p = 0.009), while Bacillota showed higher prevalence in the long PFS group (66.2% vs. 42.3%, p = 0.007), when comparing the abundance of corresponding RNA reads. Among the 120 significant DEGs identified, cluster analysis clearly separated a large set of genes more active in patients with short PFS and a smaller set of genes more active in long PFS patients. Protein Domain Families (PFAMs) were analyzed to identify pathways enriched in patient groups. Pathways related to DNA synthesis and Translesion were more enriched in short PFS patients, while metabolism-related pathways were more enriched in long PFS patients. E. coli-derived PFAMs dominated in patients with long PFS. RF, SVM and XGBoost ML models all confirmed the predictive power of our selected RNA-based microbial signature, with ROC AUCs all greater than 0.84. Multivariate Cox regression tested with clinical confounders PD-L1 expression and chemotherapy history underscored the influence of n = 6 key RNA biomarkers on PFS.

Conclusion: According to ML models specific gut microbiome MTR signatures' associate with ICI treated NSCLC outcomes. Specific gene clusters and taxa MTR gene expression might differentiate long vs short PFS.

Keywords: De novo assembly; Gut microbiome; Immune-checkpoint inhibitor; Immunotherapy; Machine learning; Metatranscriptome; Progression-free survival.


Conflict of interest statement

Declarations Ethics approval and consent to participate In the current study, we adhered to the Helsinki Declaration’s study criteria established by the World Medical Association. The study was formally approved by the national ethics committee, specifically the Hungarian Scientific and Research Ethics Committee of the Medical Research Council (ETTTUKEB- 50302-2/2017/EKU). Participation in the study was contingent upon the provision of permission by all patients involved. To maintain confidentiality, patient IDs were removed after the collection of clinicopathological data, thereby preventing direct or indirect identification of patients. Consent for publication All authors agree to submit the article for publication. Competing interests The authors declare that the research was conducted in the absence of any commercial or financial relationships that could be construed as a potential conflict of interest.

Figures

Fig. 1
Fig. 1
Alpha and Beta diversity measurements using taxa-aligned RNA reads for species and genera. Alpha diversity analysis of the gut microbiome revealed no significant differences between Long- and Short-PFS groups for both species (p = 0.803, A) and genera (p = 0.949, C) using the Shannon index, nor with the Simpson index (species: p = 0.897, B genera: p = 0.819, D). Beta diversity, assessed using Bray–Curtis dissimilarities and NMDS ordination, indicated distinct gut microbiome compositions between the groups (E, species; F, genera), though PERMANOVA tests showed no statistical significance (species: p = 0.1539, genera: p = 0.2465). Red full circles represent samples from patients with Short PFS and blue full circles samples from patients with Long PFS according to their NMDS-ordinated species- and genus compositions. Statistical comparison of the Shannon and Simpson indices was performed using Welch’s test. Statistical significance *p < 0.05; **p < 0.01, ***p < .001, all p-values were two-sided
Fig. 2
Fig. 2
Comparative microbial abundance in patients with Long vs Short Progression-Free Survival (PFS). A Domain-level comparison shows no significant difference in Bacteria (90.3% vs 89.8%, p = 0.563) and Eukaryota (9.6% vs 8.8%, p = 0.092) abundance between Long and Short PFS patients. However, Archaea are significantly more abundant in Short PFS (1.6% vs 0.003%, p < 0.001). B Phyletic differences reveal Actinomycetota (36.7% vs 5.4%, p < 0.001, n = 139) and Euryarchaeota (1.3% vs 0.002%, p = 0.009, n = 5) overrepresented in Short PFS, while Bacillota (66.2% vs 42.3%, p = 0.007, n = 1041) is more abundant in Long PFS. Non-significantly overrepresented phyla in Long PFS include Bacteroidota (14.9% vs 9.4%, p = 0.124, n = 124) and Pseudomonadota (5.2% vs 2.5%, p = 0.464, n = 95), with variability due to high standard deviations. Y axis for 100% stacked bar charts shows the proportion of the total identified abundance of taxa. C Genus-level analysis shows Bifidobacterium (p < 0.001, n = 30), Collinsella (p < 0.001, n = 59), Limosilactobacillus (p = 0.0.43, n = 4), and Eubacterium (p = 0.048, n = 29) significantly overrepresented in Short PFS. D At the species level, Bifidobacterium adolescentis L2-32 (p = 0.0054, n = 9), Collinsella aerofaciens ATC 25986 (p = 0.028, n = 17), Bacteroides fragilis (p = 0.035, n = 12), Limosilactobacillus reuteri (p = 0.048, n = 3), Collinsella stercoris DSM 13279 (p = 0.048, n = 3), and Collinsella aerofaciens (p = 0.049, n = 31) were significantly more abundant in Short PFS, with a noted non-significant trend for Parabacteroides goldsteinii towards higher abundance in Long PFS (p = 0.082, n = 6). Data was derived from MMSeqs2 analysis of 2040 curated gene transcripts (Supplemental Dataset 2), showing the top 20 genera and 30 species according to their difference based on Wilcoxon rank-sum test. X axis indicates mean abundance values calculated from the populational abundance (Long vs Short PFS patients) of all unique taxon-matched Trinity IDs (protein-coding gene transcripts). “N” refers to the number of unique Trinity IDs matched with each MMseqs2 taxa. Differential abundance testing was done using the WRS test. A comparison of the percentual contributions of domains and phyla was performed using Welch’s test. Statistical significance *p < 0.05; **p < 0.01, ***p < .001, all p-values were two-sided
Fig. 3
Fig. 3
Differential gene expression (DEG) analysis between Long and Short PFS patients using DESeq2. Analysis of 2040 curated gene transcripts revealed 689 genes with significant differential expression (− Log10FDR > 1.3, Log2FC > [2]). Among these, 120 genes met higher significance criteria (− Log10FDR > 3, Log2FC > [2]). Results are visualized on a Volcano plot, where data points with a greater − log10 FDR value than 1.3 (adjusted p-value = 0.05) are colored red (short PFS) and blue (long PFS). All data points below this significance level occur in grey. DEGs meeting the higher significance criteria are highlighted in bright red (short PFS) and blue (long PFS). Presumptive protein names displaying their UniRef90 cluster are shown for all Trinity IDs with − Log10FDR > 3 and Log2FC > [2] values in the case of Long-PFS-related genes, and top 30 meeting the same criteria in the case of Short-PFS-related genes. X-axis indicates the Log2 value of fold change (FC), and Y-axis indicates – log10 value of false discovery rate (FDR)
Fig. 4
Fig. 4
Clusters of top 120 Trinity IDs. A Hierarchical cluster analysis and heatmap generation on the 120 curated gene transcripts revealed two primary patient groups based on progression-free survival (PFS): a heterogeneous Cluster A (subgroups A1, A2, A3) with varied gene expression, notably increased in gene clusters I, II/B, and II/C, and a homogeneous Cluster B with overexpression of gene cluster II/A (A). Short PFS patients predominated in Cluster A, while long PFS patients were more common in Cluster B (p = 0.0095). Cluster A2 and A3 exhibited an abundance of Actinomycetota species (38%). Cluster II/A was uniquely overexpressed in Cluster B, with Cluster II/B showing a mix of Bacillota- (56%) and Actinomycetota-origin genes (20%), and Cluster II/C genes were specifically overexpressed in patients of Cluster I/A, primarily from Bacillota (59%). Axis X shows patients (IDs) in the, whereas indicator bars on top reflect their PFS group (red/blue, short vs long). Each row represents a Trinity ID-coded gene transcript. Axis Y includes 3 columns indicating the phylum of origin color, which is color-coded, LKTU, and UniRef90 cluster. B Principal Component Analysis (PCA) on the same 120 gene transcripts identified three to four optimal clusters using the elbow method, aligning with hierarchical clustering results. C Three clusters were chosen for clarity, with the first 3 PCs explaining 73.3% of total variance, illustrating patient clustering via PC composition and 95% confidence interval ellipsoids (short PFS in red, long PFS in blue). PCA highlighted a more distinct separation between long and short PFS patients (p < 0.001), with Long PFS patients clustering more closely (Cluster A), and short PFS patients more dispersed across overlapping Clusters B and C (C). Compositional differences between clusters according to the PFS group were evaluated using Fisher’s exact test. All p-values were two-sided, and significance was considered at p < 0.05
Fig. 5
Fig. 5
Pathway analyses using differentially abundant PFAMs for patients with Long- and Short PFS. Reactome analysis showed Short PFS PFAMs overrepresented in pathways related to hypoxia-response, DNA-synthesis, Translesion-synthesis, Polymerase-switching among others (A), while Long PFS PFAMs were associated with various metabolic pathways (B). Pathways with [FDR < 0.1] are shown on bar charts, where lower X axis displays (-log10) FDR values and upper X axis displays ratios of entities (green circle) and reactions (red asterisk). Ratios reflect the proportion of pathway-matched UniProt IDs found in our dataset vs all UniProt IDs in that pathway. Taxonomic analysis showed Short PFS PFAMs represented by diverse taxa, including Enterococci and Methanosphaera (C, D), whereas Long PFS PFAMs were dominated by Escherichia, particularly E. coli (E, F). Only species with a minimum contribution of 1% are present on bars (C, E). D and F show the total contribution from the top 5 bacterial species accounting for all represented PFAMs in the corresponding patient group
Fig. 6
Fig. 6
Internal validation with machine learning. A The Random Forest (RF) model achieved an AUC of 0.878 ± 0.019 and 78.1% ± 0.036 accuracy in distinguishing Long vs Short PFS. Confusion matrix shows the number of true- and false positives and negatives for the RF classifier in a heatmap after 50 × fivefold cross-validation and ROC curve indicates RF model performance averaged after cross-validation. B The Support Vector Machine (SVM) model, using radial basis function kernels, showed comparable results with an AUC of 0.85 ± 0.046 and 75.6% ± 0.066 accuracy. Confusion matrix shows the number of true- and false positives and negatives for the SVM model in a heatmap after 10 × fivefold cross-validation. ROC curve indicates SVM model performance averaged after cross-validation. C The Extreme Gradient Boosting (XGBoost) model achieved an AUC of 0.84 ± 0.03 and 75% ± 0.05 accuracy in distinguishing Long vs Short PFS. Confusion matrix shows the number of true- and false positives and negatives for the RF classifier in a heatmap after 50 × 13-fold cross-validation and ROC curve indicates RF model performance averaged after cross-validation. Biomarker identification through ROC curve analyses for 120 microbial genes revealed potential biomarkers with AUC > 0.8, DI Abundance comparisons between patients with short- and long PFS are shown in box plots. JO ROC curves show the performance of biomarker candidates to classify patients into long vs short PFS groups. All ROC curves passed the significance threshold (p < 0.05). Sensitivity and Specificity for every gene transcript are shown in the bottom left corner of the ROC curve panels. Metric data are shown as medians and 95% CI. Statistical significance *p < 0.05; **p < 0.01, ***p < .001. All p-values were two-sided
Fig. 7
Fig. 7
Assessment of PFS associations with microbial gene transcripts and clinical covariates. A Univariate Cox regression on 120 gene transcripts and clinical covariates identified 18 genes significantly associated with PFS. Further multivariate analysis, adjusting for CHT and PD-L1 TPS as confounders, highlighted six genes with significant predictive value for PFS. Notably, a Fusobacterium species protein (HR: 0.69, p = 0.026) and a Lachnospiraceae protein (HR: 0.68, p = 0.029) were positively associated with PFS. In contrast, four others, including ribosomal protein S12 (HR: 1.64, p = 0.03) and uncharacterized protein ycf68 (HR: 1.67, p = 0.006) from unknown Eukaryota species, a bacterial surface antigen (D15) domain-containing protein (HR: 1.81, p = 0.017), and an unknown protein (HR: 1.78, p = 0.009) from unknown organisms were negatively associated with PFS. B Risk scores calculated for all covariates and biomarkers are shown on bar charts, where positive values indicate higher risk-, negative values indicate lower risk of progression. CH KM curves for RNA transcripts with top 6 risk scores and significant p-values for multivariate Cox regression compare biomarker-high vs low populations (cut-off: median abundance value). p-values for the Log-rank test are indicated along with censored data on charts (0 = biomarker-low group, 1 = biomarker-high group). I ROC curve analysis shows the predictive power of combined risk score (AUC = 0.89). J KM analysis shows that patients in the low-risk group exhibit significantly increased survival compared to high-risk patients (p = 0.0003). HR: Hazard ratio

Similar articles

Cited by

References

    1. Lahiri A, Maji A, Potdar PD, Singh N, Parikh P, Bisht B, Mukherjee A, Paul MK. Lung cancer immunotherapy: progress, pitfalls, and promises. Mol Cancer. 2023;22(1):40. 10.1186/s12943-023-01740-y. - PMC - PubMed
    1. Gandhi L, Rodríguez-Abreu D, Gadgeel S, Esteban E, Felip E, De Angelis F, Domine M, Clingan P, Hochmair MJ, Powell SF, Cheng SY, Bischoff HG, Peled N, Grossi F, Jennens RR, Reck M, Hui R, Garon EB, Boyer M, Rubio-Viqueira B, Novello S, Kurata T, Gray JE, Vida J, Wei Z, Yang J, Raftopoulos H, Pietanza MC, Garassino MC, KEYNOTE-189 Investigators. Pembrolizumab plus chemotherapy in metastatic non-small-cell lung cancer. N Engl J Med. 2018;378(22):2078–92. 10.1056/NEJMoa1801005. - PubMed
    1. Desai A, Peters S. Immunotherapy-based combinations in metastatic NSCLC. Cancer Treat Rev. 2023;116: 102545. 10.1016/j.ctrv.2023.102545. - PubMed
    1. Dora D, Ligeti B, Kovacs T, Revisnyei P, Galffy G, Dulka E, Krizsán D, Kalcsevszki R, Megyesfalvi Z, Dome B, Weiss GJ, Lohinai Z. Non-small cell lung cancer patients treated with Anti-PD1 immunotherapy show distinct microbial signatures and metabolic pathways according to progression-free survival and PD-L1 status. Oncoimmunology. 2023;12(1):2204746. 10.1080/2162402X.2023.2204746. - PMC - PubMed
    1. Routy B, Le Chatelier E, Derosa L, Duong CPM, Alou MT, Daillère R, Fluckiger A, Messaoudene M, Rauber C, Roberti MP, Fidelle M, Flament C, Poirier-Colame V, Opolon P, Klein C, Iribarren K, Mondragón L, Jacquelot N, Qu B, Ferrere G, Clémenson C, Mezquita L, Masip JR, Naltet C, Brosseau S, Kaderbhai C, Richard C, Rizvi H, Levenez F, Galleron N, Quinquis B, Pons N, Ryffel B, Minard-Colin V, Gonin P, Soria JC, Deutsch E, Loriot Y, Ghiringhelli F, Zalcman G, Goldwasser F, Escudier B, Hellmann MD, Eggermont A, Raoult D, Albiges L, Kroemer G, Zitvogel L. Gut microbiome influences efficacy of PD-1-based immunotherapy against epithelial tumors. Science. 2018;359(6371):91–7. 10.1126/science.aan3706. - PubMed

LinkOut - more resources