. 2024 Nov 19;16(1):251.
doi: 10.1186/s13195-024-01618-1.

Unveiling the molecular mechanisms of Danggui-Shaoyao-San against Alzheimer's disease in APP/PS1 mice via integrating proteomic and metabolomic approaches

Affiliations

Unveiling the molecular mechanisms of Danggui-Shaoyao-San against Alzheimer's disease in APP/PS1 mice via integrating proteomic and metabolomic approaches

Qihui Wu et al. Alzheimers Res Ther. .

Abstract

Background: Alzheimer's disease (AD) is the most prevalent neurodegenerative disorder for which no effective therapy is currently available. Given that various attempts to target beta-amyloid (Aβ) have been unsuccessful in clinical trials, other potential pathogenic factors such as brain energy metabolism (EM) have attracted increasing attention. Traditional Chinese medicines, including danggui-shaoyao-san (DSS), play a notable role in AD. However, it remains unclear whether DSS exerts therapeutic effects on AD through EM regulation.

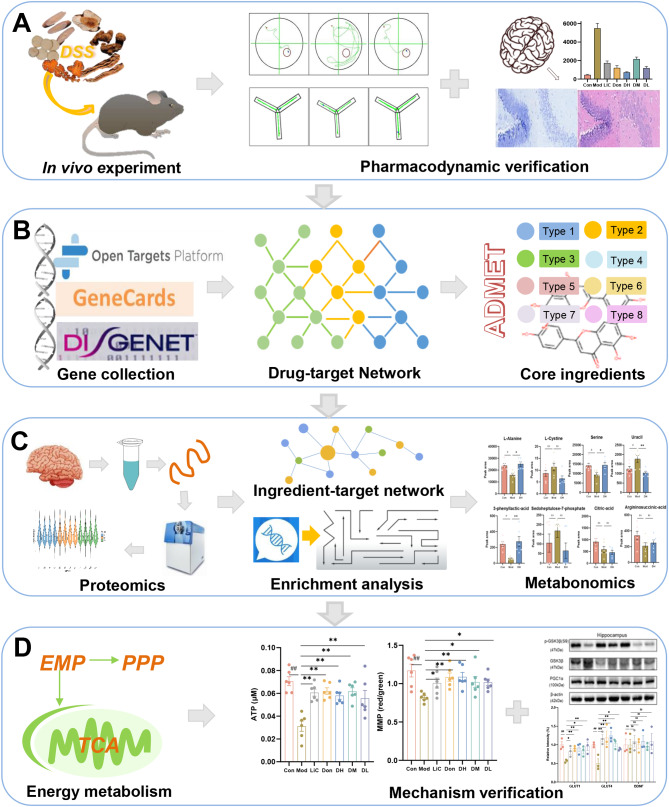
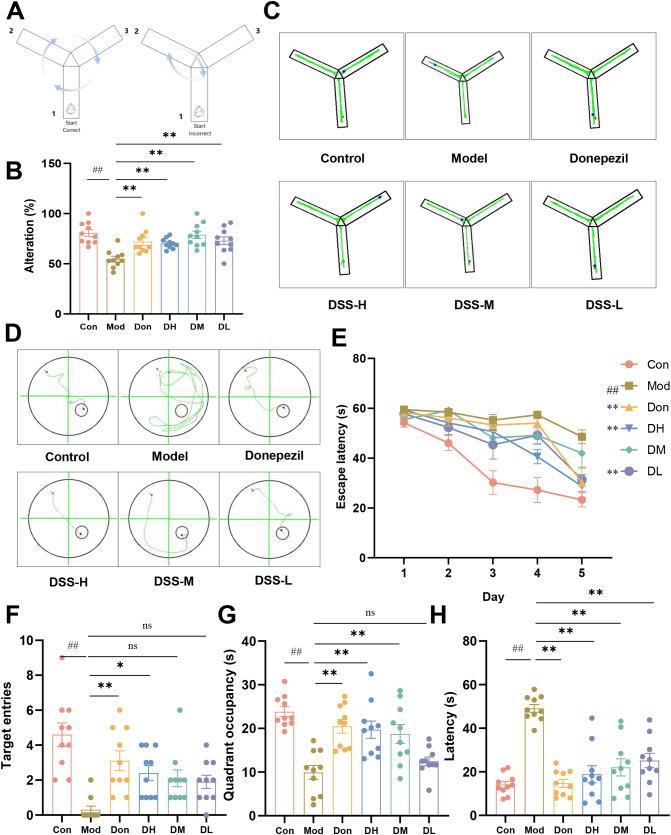
Methods: In this study, we conducted behavioural tests, Nissl staining, haematoxylin and eosin staining, and thioflavin S staining, in APP/PS1 mice to assess the pharmacodynamic effect of DSS on AD. Subsequently, we integrated the drug target network of herbal ingredients in DSS and evaluated their absorption, distribution, metabolism, excretion, and toxicity properties to identify the core ingredients. We used proteomic and metabolomic approaches to explore the potential mechanisms of action of DSS against AD. Consequently, we verified the mechanism underlying EM using qPCR, western blotting, and ELISA.

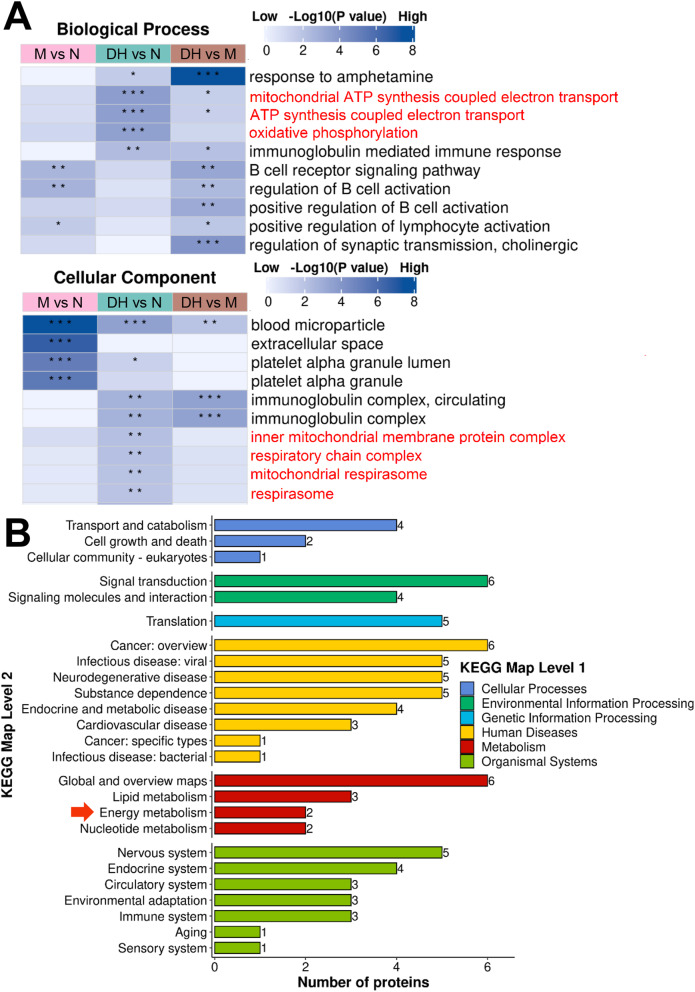
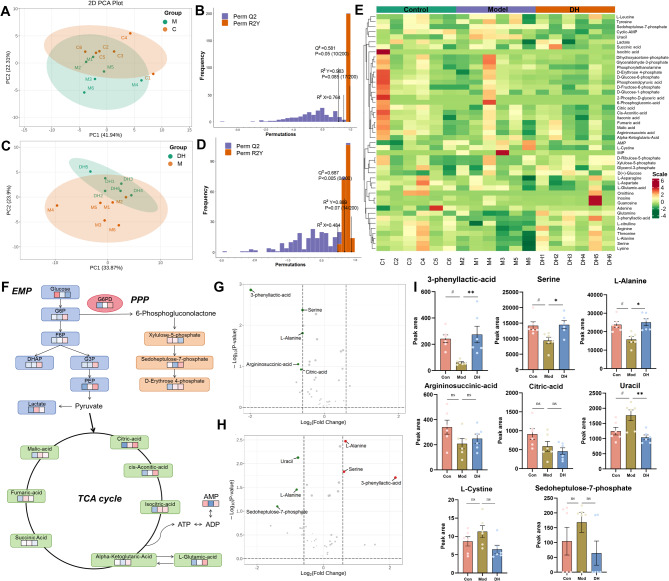
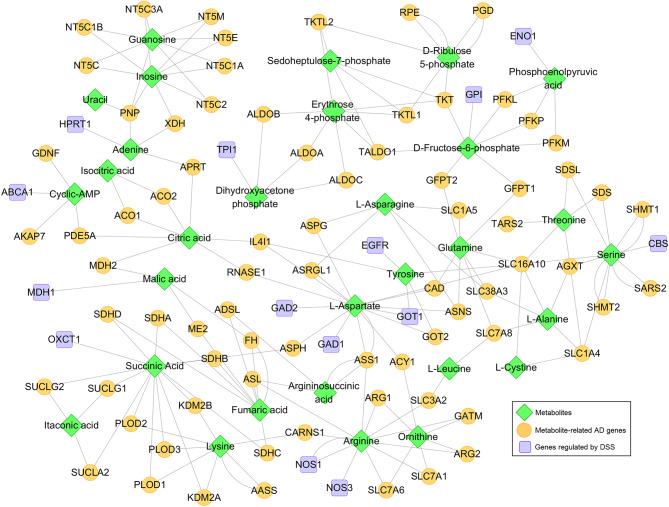
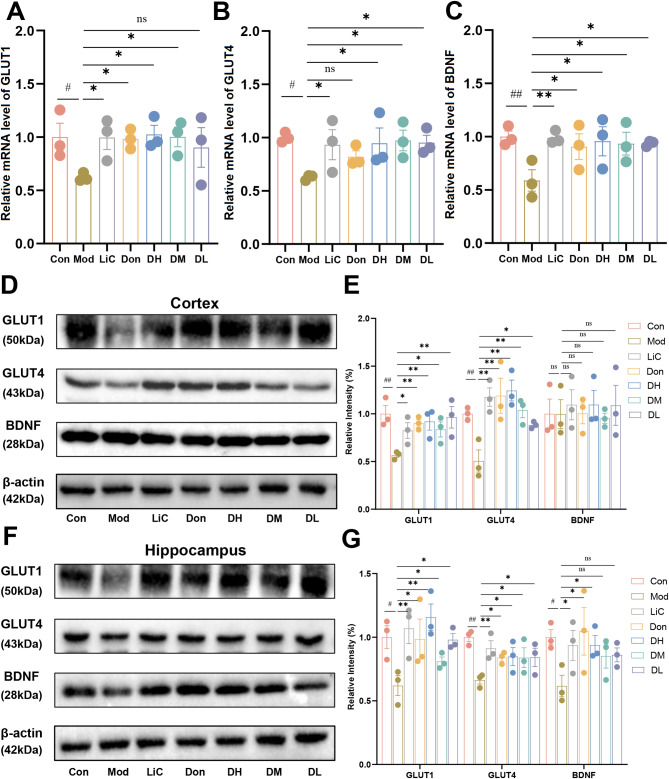
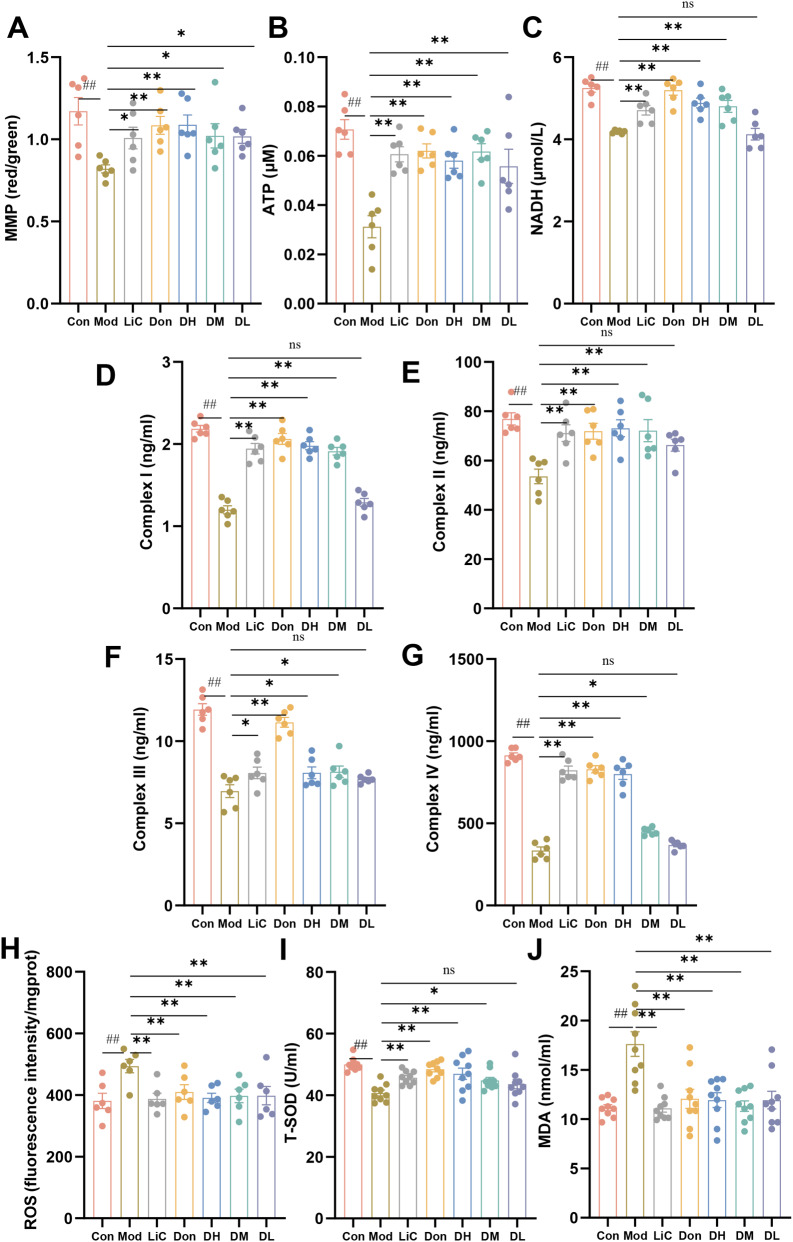
Results: In vivo experimental results revealed that DSS ameliorated cognitive impairment in APP/PS1 mice, attenuated neuronal apoptosis, and reduced Aβ burden. Furthermore, the drug-target network comprised 6,514 drug-target interactions involving 1,118 herbal ingredients and 218 AD genes, of which 253 were identified as the core ingredients in DSS. The proteomic results implied that DSS could act on EM to alleviate AD, and targeted energy metabolomics suggested that DSS regulated 47 metabolites associated with EM. Mechanistically, we found that DSS could regulate the GSK3β/PGC1α signalling pathway to improve brain glucose uptake and mitigate mitochondrial dysfunction and oxidative stress, ultimately promoting EM to treat AD.

Conclusion: Our study is the first to integrate multi-omics approaches to reveal that DSS could regulate the GSK3β/PGC1α signalling pathway to exert therapeutic effects in AD through the promotion of EM, thereby providing new insights into the mechanism of action of DSS against AD.

Keywords: Alzheimer’s disease; Danggui-Shaoyao-San; Energy metabolism; Multi-omics.


Conflict of interest statement

Declarations Ethical approval All in vivo interventions were accepted by the Animal Ethics Committee of Guangzhou University of Chinese Medicine (No. 20230405004). Competing interests The authors declare no competing interests.

Figures

Fig. 1
Fig. 1
Schematic workflow of this study. (A) In vivo pharmacodynamic verification. (B) Network construction and core ingredients screening. (C) Mechanism exploration by multi-omics analysis. (D) Verification of the mechanisms associated with energy metabolism
Fig. 2
Fig. 2
DSS improved cognitive function in APP/PS1 mice. (A) Schematic diagram of spontaneous alternation. (B) Alternation rates of all groups of mice in the Y-maze test. (C) Representative track images of mice in the Y-maze test. (D) Representative track images of mice in the Morris water maze (MWM) test. (E) Escape latency during training days in the MWM test. (F) Numbers of target crossings in the MWM test. (G) Time stayed in the target quadrant in the MWM test. (H) Escape latency of all groups of mice in the MWM test. Data are shown as mean ± SEM, n = 10 mice per group. ##p < 0.01 vs. the control group. *p < 0.05, **p < 0.01 vs. the model group, ns, no significant difference. Con, control group; Mod, model group; LiC, inhibitor group; Don, positive control group; DH, high dose of DSS group; DM, medium dose of DSS group; DL, low dose of DSS group. One-way ANOVA, followed by LSD method multiple comparisons tests (B, E, G, and H) or non-parametric independent samples Kruskal–Wallis test (F)
Fig. 3
Fig. 3
Effect of DSS on neuronal survival and Aβ plaque. (A) Images of Nissl’s staining and haematoxylin and eosin (H&E) staining of the CA3 and DG areas in the hippocampus of different groups. (B) Cell counts in CA3 and DG regions in Nissl’s staining and semi-quantitative analysis scores in H&E staining. (C) Images of TS staining in brain regions. (D) Quantification of the Aβ plaques in TS staining. Data are presented as mean ± SEM, n = 3 mice per group. ##p < 0.01 vs. the control group. *p < 0.05, **p < 0.01 vs. the model group. Con, control group; Mod, model group; LiC, inhibitor group; Don, positive control group; DH, high dose of DSS group; DM, medium dose of DSS group; DL, low dose of DSS group. One-way ANOVA, followed by LSD method multiple comparisons tests (B, D)
Fig. 4
Fig. 4
Drug-target network analysis and screening process of core ingredients in DSS. (A) This network comprises 6,514 DTIs, which interacts with 1,118 ingredients and 218 AD genes. The labels of the top 10 ingredients and AD genes with degrees ≥ 30 are shown. The font size of the labels and the size of the nodes are proportional to the degree. (B) Sankey diagram showing the screening process of the core ingredients in DSS. HIA, human intestinal absorption; BBB, blood-brain barrier; PPB, plasma protein binding. Herbal ingredients are classified according to the chemical taxonomy provided by ClassyFire [37]
Fig. 5
Fig. 5
Proteomic analysis of hippocampus tissue of APP/PS1 mice after treatment of high dose of DSS. (A) Relative standard deviation and (B) intensity of the control, model, and high dose of DSS (DH) groups based on identified proteins, n = 4 mice per group. (C) Differentially expressed proteins were identified from comparisons of the control vs. model groups, the model vs. DH groups, and the control vs. DH groups. (D) Venn diagram showing the differentially expressed proteins between the control vs. model groups and the DH vs. model groups. (E) The core ingredient-gene network and the protein-protein interactions network. N, control group; M, model group; DH, high dose of DSS group
Fig. 6
Fig. 6
Enrichment analysis of differentially expressed proteins from three different groups. (A) Gene Ontology (GO) enrichments of differentially expressed proteins between the control, model, and DH groups. (B) KEGG functional classifications of differentially expressed proteins. *p < 0.05, **p < 0.01, ***p < 0.001. n = 4 mice per group. N, control group; M, model group; DH, high dose of DSS group
Fig. 7
Fig. 7
Serum metabolic profile of APP/PS1 mice after DSS treatment (n = 6). (A) PCA and (B) OPLS-DA score plots between the control and model groups. (C) PCA and (D) OPLS-DA score plots between the model and high dose of DSS (DH) treatment group. (E) Heatmap of the 47 differential metabolites for three groups. (F) Schematic diagram of some detected metabolites associated with EM. (G,H) Volcano plot of differential metabolites of the control vs. model groups and the model vs. DH groups. (I) Change in the relative peak area of the metabolites. Data are expressed as mean ± SEM. n = 6 mice per group. #p < 0.05 vs. the control group. *p < 0.05 vs. the model group. **p < 0.01 vs. the model group
Fig. 8
Fig. 8
Metabolite-AD gene network of DSS. The green diamond and the purple square represent the differential metabolites related to energy metabolism and genes regulated by DSS, while the yellow dot node denotes the genes highly associated with these differential metabolites integrated through the AlzGPS database
Fig. 9
Fig. 9
DSS promoted brain glucose uptake in APP/PS1 mice. (A-C) qPCR analysis showing the GLUT1, GLUT4, and BDNF levels in the cortex. (D-G) Protein expression levels of GLUT1, GLUT4, and BDNF in the cortex and hippocampus by western blot analysis. Data are shown as mean ± SEM, n = 3 mice per group. #p < 0.05, ##p < 0.01 vs. the control group. *p < 0.05, **p < 0.01 vs. the model group, ns, no significant difference. Con, control group; Mod, model group; LiC, inhibitor group; Don, positive control group; DH, high dose of DSS group; DM, medium dose of DSS group; DL, low dose of DSS group. One-way ANOVA, followed by LSD method multiple comparisons tests (A, B, C, E, and G)
Fig. 10
Fig. 10
DSS improved mitochondrial function and relieved oxidative stress in APP/PS1 mice. (A) MMP measurement. (B,C) ATP and NADH content (n = 6). (D-G) Mitochondrial respiratory chain I-IV content. (H-J) The relative content of ROS, total SOD, and MDA. Data are presented as mean ± SEM, n = 6−9 mice per group. ##p < 0.01 vs. the control group. *p < 0.05, **p < 0.01 vs. the model group, ns, no significant difference. Con, control group; Mod, model group; LiC, inhibitor group; Don, positive control group; DH, high dose of DSS group; DM, medium dose of DSS group; DL, low dose of DSS group. One-way ANOVA, followed by LSD method multiple comparisons test (A, B, C, D, E, F, H, and I) or Tamhane’s T2 method test (G, J)
Fig. 11
Fig. 11
DSS regulated GSK3β/PGC1α signalling pathway. (A,B) The relative mRNA expression level of GSK3β and PGC1α in mouse cortex by qPCR analysis. (C-F) Protein expression of GSK3β, p-GSK3β and PGC1α in mouse cortex and hippocampus by western blot analysis. Data are presented as mean ± SEM, n = 3 mice per group. #p < 0.05, ##p < 0.01 vs. the control group. *p < 0.05, **p < 0.01 vs. the model group, ns, no significant difference. Con, control group; Mod, model group; LiC, inhibitor group; DON, positive control group; DH, high dose of DSS group; DM, medium dose of DSS; DL, low dose of DSS group. One-way ANOVA followed by LSD difference multiple comparison tests (A, B, D, and F)
Fig. 12
Fig. 12
The proposed underlying mechanism of DSS against AD. DSS exerted therapeutic effects on AD by regulating energy metabolism, relieving oxidative stress, and alleviating Aβ neurotoxicity

References

    1. Estimation of the global prevalence of dementia. In 2019 and forecasted prevalence in 2050: an analysis for the global burden of Disease Study 2019. Lancet Public Health. 2022;7(2):e105–25. - DOI - PMC - PubMed
    1. Winblad B, Amouyel P, Andrieu S, Ballard C, Brayne C, Brodaty H, et al. Defeating Alzheimer’s disease and other dementias: a priority for European science and society. Lancet Neurol. 2016;15(5):455–532. - DOI - PubMed
    1. He X, Peng Y, Huang S, Xiao Z, Li G, Zuo Z et al. Blood Brain Barrier-Crossing Delivery of Felodipine Nanodrug Ameliorates Anxiety-Like Behavior and Cognitive Impairment in Alzheimer’s Disease. Adv Sci 2024:e2401731. - PMC - PubMed
    1. Patel V, Mill J, Okonkwo OC, Salamat S, Li L, Raife T. Global Energy metabolism deficit in Alzheimer Disease Brain. J Prev Alzheimers Dis. 2024;11(1):171–8. - PubMed
    1. Jin Y, Liang S, Qiu J, Jin J, Zhou Y, Huang Y, et al. Intestinal flora study reveals the mechanism of Danggui Shaoyao San and its decomposed recipes to improve cognitive dysfunction in the rat model of Alzheimer’s disease. Front Cell Infect Microbiol. 2023;13:1323674. - DOI - PMC - PubMed

LinkOut - more resources