. 2024 Nov-Dec;176(6):e14630.
doi: 10.1111/ppl.14630.

Interplay between CO2 and light governs carbon partitioning in Chlamydomonas reinhardtii

Affiliations

Interplay between CO2 and light governs carbon partitioning in Chlamydomonas reinhardtii

Luca Zuliani et al. Physiol Plant. 2024 Nov-Dec.

Abstract

Increasing CO2 availability is a common practice at the industrial level to trigger biomass productivity in microalgae cultures. Still, the consequences of high CO2 availability in microalgal cells exposed to relatively high light require further investigation. Here, the photosynthetic, physiologic, and metabolic responses of the green microalga model Chlamydomonas reinhardtii were investigated in high or low CO2 availability conditions: high CO2 enabled higher biomass yields only if sufficient light energy was provided. Moreover, cells grown in high light and high CO2 availability were characterized, compared to cells grown in high light and low CO2, by a relative increase of the energy-dense triacylglycerols and decreased starch accumulation per dry weight. The photosynthetic machinery adapted to the increased carbon availability, modulating Photosystem II light-harvesting efficiency and increasing Photosystem I photochemical activity, which shifted from being acceptor side to donor side limited: cells grown at high CO2 availability were characterized by increased photosynthetic linear electron flow and by the onset of a balance between NAD(P)H oxidation and NAD(P)+ reduction. Mitochondrial respiration was also influenced by the conditions herein applied, with reduced respiration through the cytochrome pathway compensated by increased respiration through alternative pathways, demonstrating a different use of the cellular reducing power based on carbon availability. The results suggest that at high CO2 availability and high irradiance, the reducing power generated by the oxidative metabolism of photosynthates is either dissipated through alternative oxidative pathways in the mitochondria or translocated back to the chloroplasts to support carbon assimilation and energy-rich lipids accumulation.


Figures

FIGURE 1
FIGURE 1
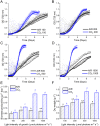
Growth curves and biomass productivity. Chlamydomonas reinhardtii cells were grown at different CO2 availability (AIR: 0.04%, CO2: 3%) at different irradiances (100, 200, 500, or 1000 μmol photons m−2 s−1 as reported respectively in panels A, B, C, D). In panel A‐D, three different growth curves are reported for each condition, while the functions obtained upon fitting procedure are reported in solid lines. Biomass productivity expressed as g L−1 day−1 of dry weight and the final biomass (dry weight) concentration are reported in panels E and F. In panels E and F, data are reported as means of three biological replicates with standard deviation shown. Significant different values in the different conditions are indicated by different letters according to ANOVA analysis post Tuckey post‐hoc test (p < 0.05).
FIGURE 2
FIGURE 2
Protein, starch, and lipids in AIR vs. CO 2 conditions. Relative protein (A), starch (B), and lipid (C) content per dry weight in AIR vs. CO2 condition. Lipid composition is reported in terms of phospholipids, galactolipids (including SQDG), DGTS, and triacylglycerols (TAG). (D) Polar lipid profile obtained by thin‐layer chromatography. (C) The profile of fatty acids was obtained by gas chromatography. Data are means of three biological replicates with standard deviation shown. Significantly different values in CO2 versus AIR are indicated with * (p < 0.05, n = 3). MGDG, monogalactosyldiacylglycerol; DGDG, di galactosyl diacylglycerol; PG, phosphatidylglycerol; PE, phosphatidylethanolamine; DGTS, diacylglycerol N,N,N‐trimethylhomoserine; SQDG, sulfoquinovosyl diacylglycerol.
FIGURE 3
FIGURE 3
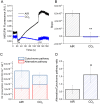
NAD(P)H formation rate and mitochondrial respiration in AIR vs. CO 2 . (A) Light‐dependent rate of NAD(P)H formation upon exposure to light (300 μmol photons m−2 s−1) for 100 s in AIR (black color) or CO2 (blue color) conditions followed by 60 s of dark recovery (ON–OFF in panel A indicates when light was turned on or off). (B) Slope of the NAD(P)H fluorescence emission curve upon exposure to actinic light reported in (A). (C) Oxygen consumption by dark respiration in cells grown in AIR or CO2 conditions. The relative contribution of cytochrome (filled bars) and alternative respiration (empty bars) was reported normalized to cell content. (D) The ratio between alternative and cytochrome pathways for cells grown in AIR or CO2 conditions according to the results reported in (C). Data are means of three biological replicates with standard deviation shown. Significantly different values in CO2 versus AIR are indicated by * (p < 0.05) or ** (p < 0.01).
FIGURE 4
FIGURE 4
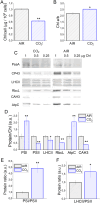
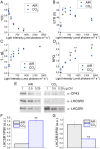
Pigment and photosynthetic protein accumulation. (A) Chlorophyll (Chl) content per cell in AIR or CO2 conditions. (B) Chlorophyll a/b ratio in AIR or CO2 conditions. (C) Immunoblotting results of different proteins involved in the photosynthetic process: Photosystem I subunit PsaA, Photosystem II subunit CP43, LHCII antenna proteins, RuBisCO large subunit (RbcL), chloroplastic ATPase subunit C (AtpC) and carbonic anhydrase (CAH3). (D) densitometric analysis of western blot reported in (C) expressed as protein content on a chlorophyll (Chl) basis normalized to AIR condition. (E) The Photosystem I (PSI) to Photosystem II (PSII) ratio is calculated based on the results reported in (D). (F) LHCII to Photosystem II (PSII) ratio calculated based on the results reported in (D) normalized to AIR condition. Data are means of three biological replicates with standard deviation shown. Significantly different values in CO2 versus AIR are indicated by * (p < 0.05) or ** (p < 0.01).
FIGURE 5
FIGURE 5
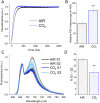
Photosystem II light harvesting efficiency and state transitions in AIR vs. CO2. (A). fluorescence emission kinetic upon exposure to limiting light in cells treated with DCMU to inhibit PSII photochemical activity. (B) PSII light harvesting efficiency, or PSII antenna size, calculated from the kinetics reported in (A) as the 1/τ2/3, where τ2/3 is the time required to reach 2/3 of the maximum fluorescence emission. The PSII light harvesting efficiencies were then normalized as a percentage of light harvesting efficiency measured in cells grown in AIR conditions. (C) State transition analysis by 77 K fluorescence emission spectra in state 1 (S1) or state 2 (S2) conditions. S1 was induced by shaking vigorously cells in a low light (⁓5 μmol photons m2 s−1) with 10 μm of DCMU for at least 15 min to oxidize the plastoquinone pool. In contrast, S2 was induced by adding 250 μm sodium azide to inhibit mitochondrial respiration and to reduce the plastoquinone pool. (D) Maximum capacities for state transitions estimated from the spectra reported in (C) as (FS2‐FS1)/FS2, being FS1 and FS2 the maximum fluorescence emission at 720 nm (PSI emission) measured in cells respectively in S1 or S2. Data reported are means of three biological replicates with standard deviation shown. Significant differences in CO2 vs. AIR are indicated with ** (p < 0.01).
FIGURE 6
FIGURE 6
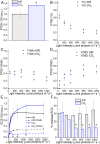
Light‐dependent oxygen evolution curves. Light‐dependent oxygen evolution was measured at different light intensities. The results obtained are presented on a cell basis (A), chlorophyll basis (B), or PSII basis (C). Data reported are means of three biological replicates with standard deviation shown. Significant differences in CO2 vs. AIR are indicated with * (p < 0.05).
FIGURE 7
FIGURE 7
Photosystem II photochemical and non‐photochemical activity. (A) PSII operating quantum yield (Y(II)), (B) PSII electron transport rate (ETR(II)), (C) redox state of plastoquinone (1‐qL), D) non‐photochemical quenching (NPQ) measured at different actinic lights in dark‐adapted cells grown in AIR or CO2 conditions. (E) Western blot analysis of LHCSR3 and LHCSR1 content in cells grown in AIR or CO2 conditions. CP43 subunit content was also analyzed by immunoblotting to normalize LHCSR1 and LHCSR3 content to PSII. (F) LHCSR1 to PSII ratio determined by densitometric analysis of immunoblotting results (E) normalized to AIR condition. (G) LHCSR3 to PSII ratio determined by densitometric analysis of immunoblotting results normalized to AIR conditions (E). Data reported are means of three biological replicates with standard deviation shown. Significant differences in CO2 vs. AIR are indicated with * (p < 0.05) or ** (p < 0.01).
FIGURE 8
FIGURE 8
Photosystem I activity and electrochromic shift in AIR vs. CO2 condition. (A) Maximal P700 oxidation on a chlorophyll basis in cells grown in AIR or CO2 conditions normalized to AIR condition. (B) P700 quantum yield at different actinic lights. (C) Fraction of P700 being limited at the acceptor side at different actinic lights. (D) The fraction of P700 is limited on the donor side at different actinic lights. (E) Electrochromic shift (ECS) at different actinic light in cells grown in AIR or CO2 conditions (solid lines) normalized to chlorophyll content. ECS results in the presence of DCMU are also reported with dashed lines. (F) Percentage of residual ECS upon DCMU treatment and inhibition of linear electron flow. Data are means of three biological replicates with standard deviation shown. Significant differences in CO2 vs. AIR are indicated with * (p < 0.05) or ** (p < 0.01).

References

    1. Allorent, G. , Tokutsu, R. , Roach, T. , Peers, G. , Cardol, P. , Girard‐Bascou, J. , Seigneurin‐Berny, D. , Petroutsos, D. , Kuntz, M. , Breyton, C. , Franck, F. , Wollman, F. A. , Niyogi, K. K. , Krieger‐Liszkay, A. , Minagawa, J. & Finazzi, G. 2013. A dual strategy to cope with high light in Chlamydomonas reinhardtii. Plant Cell, 25, 545–57. - PMC - PubMed
    1. Alric, J. 2014. Redox and ATP control of photosynthetic cyclic electron flow in Chlamydomonas reinhardtii: (II) involvement of the PGR5‐PGRL1 pathway under anaerobic conditions. Biochim Biophys Acta, 1837, 825–34. - PubMed
    1. Aronsson, H. , Schöttler, M. A. , Kelly, A. A. , Sundqvist, C. , Dörmann, P. , Karim, S. & Jarvis, P. 2008. Monogalactosyldiacylglycerol deficiency in Arabidopsis affects pigment composition in the prolamellar body and impairs thylakoid membrane energization and photoprotection in leaves. Plant Physiol, 148, 580–92. - PMC - PubMed
    1. Bailleul, B. , Berne, N. , Murik, O. , Petroutsos, D. , Prihoda, J. , Tanaka, A. , Villanova, V. , Bligny, R. , Flori, S. , Falconet, D. , Krieger‐Liszkay, A. , Santabarbara, S. , Rappaport, F. , Joliot, P. , Tirichine, L. , Falkowski, P. , Cardol, P. , Bowler, C. & Finazzi, G. 2015. Energetic coupling between plastids and mitochondria drives CO2 assimilation in diatoms. Nature, 524, 366‐+. - PubMed
    1. Bailleul, B. , Cardol, P. , Breyton, C. & Finazzi, G. 2010. Electrochromism: a useful probe to study algal photosynthesis. Photosynth Res, 106, 179–89. - PubMed

MeSH terms

LinkOut - more resources