. 2024 Nov 19;12(1):35.
doi: 10.1186/s40170-024-00364-0.

Glutaminolysis is associated with mitochondrial pathway activation and can be therapeutically targeted in glioblastoma

Affiliations

Glutaminolysis is associated with mitochondrial pathway activation and can be therapeutically targeted in glioblastoma

Kenji Miki et al. Cancer Metab. .

Abstract

Background: Glioblastoma is an aggressive cancer that originates from abnormal cell growth in the brain and requires metabolic reprogramming to support tumor growth. Metabolic reprogramming involves the upregulation of various metabolic pathways. Although the activation of specific metabolic pathways in glioblastoma cell lines has been documented, the comprehensive profile of metabolic reprogramming and the role of each pathway in glioblastoma tissues in patients remain elusive.

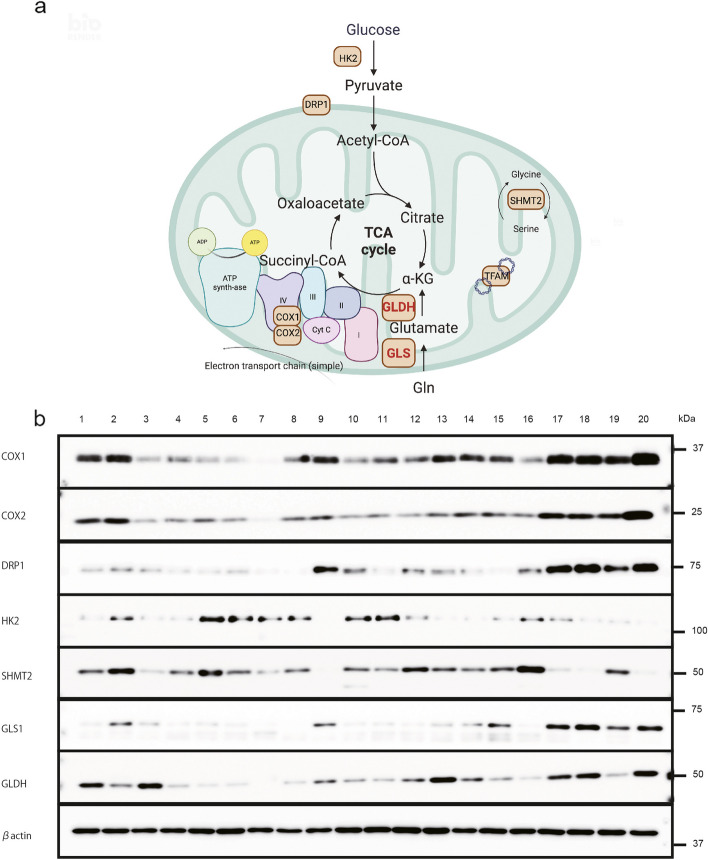
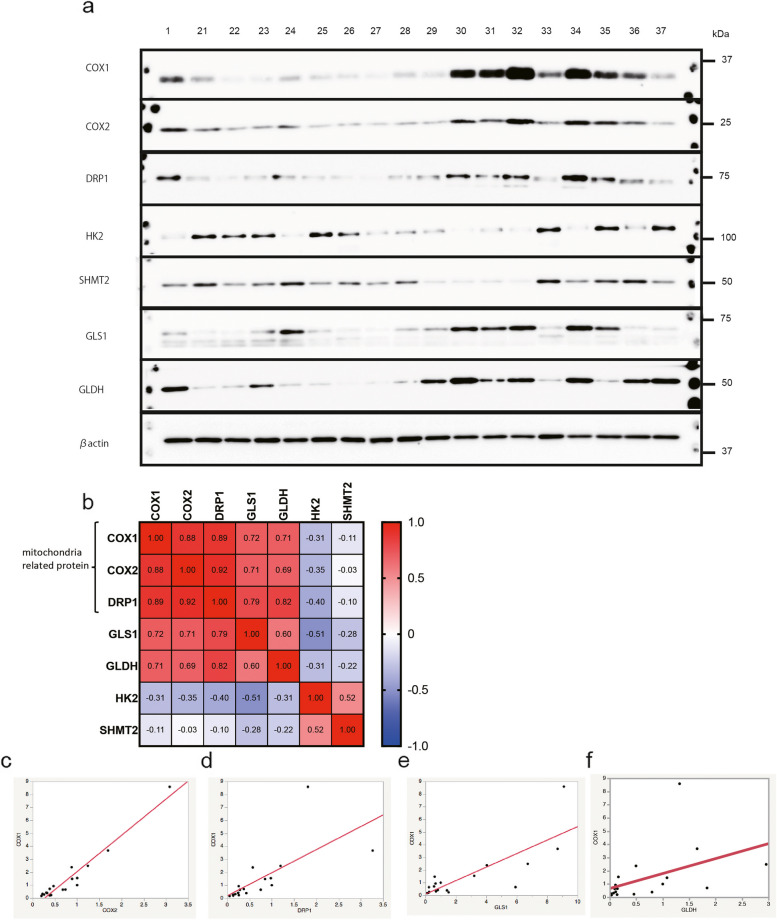
Methods: We analyzed 38 glioblastoma tissues. As a test set, we examined 20 tissues from Kyushu University Hospital, focusing on proteins related to several metabolic pathways, including glycolysis, the one-carbon cycle, glutaminolysis, and the mitochondrial tricarboxylic acid cycle. Subsequently, we analyzed an additional 18 glioblastoma tissues from Kagoshima University Hospital as a validation set. We also validated our findings using six cell lines, including U87, LN229, U373, T98G, and two patient-derived cells.

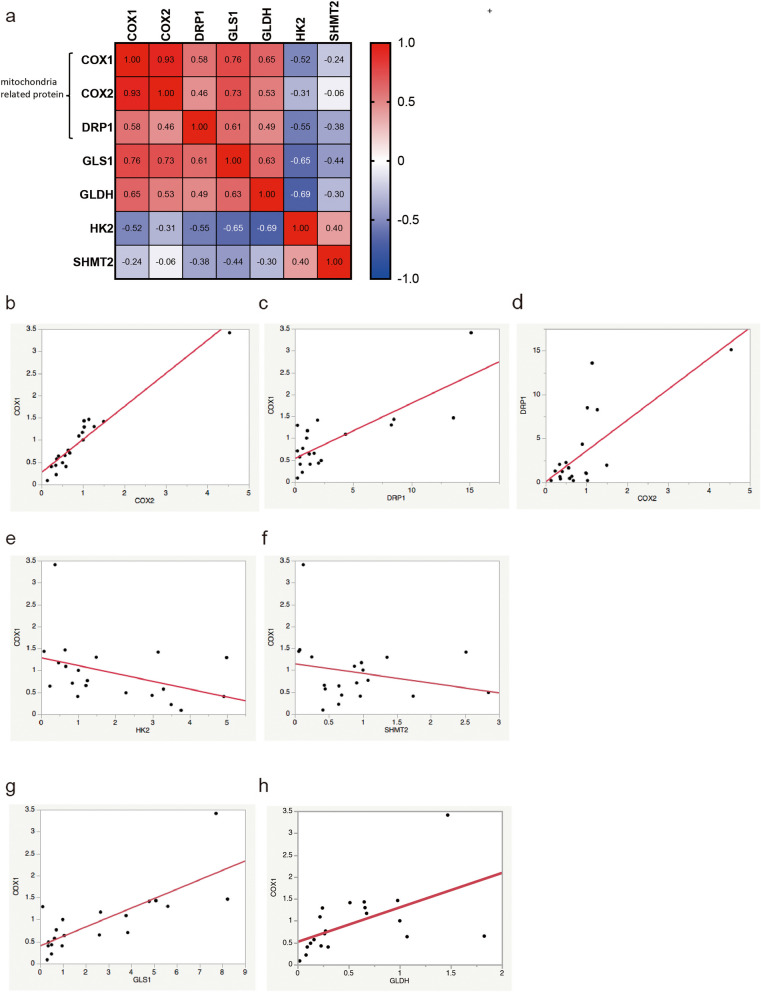
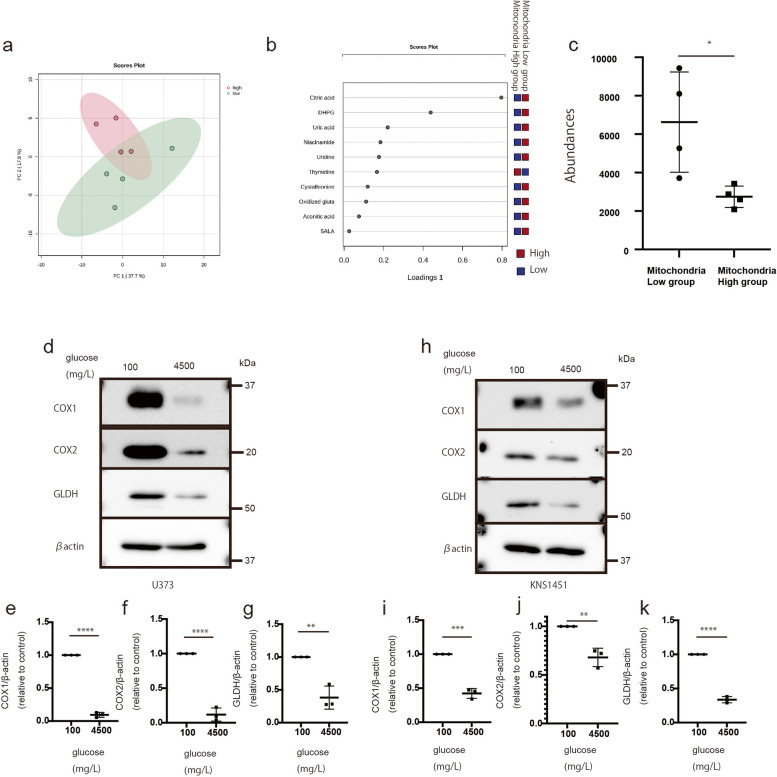
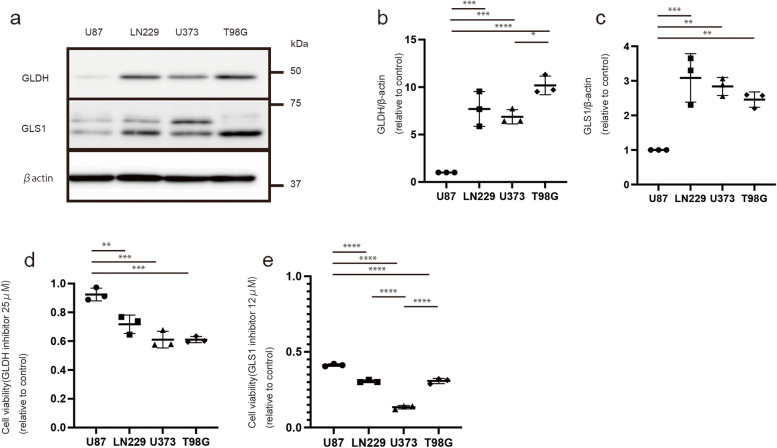
Results: The levels of mitochondria-related proteins (COX1, COX2, and DRP1) were correlated with each other and with glutaminolysis-related proteins (GLDH and GLS1). Conversely, their expression was inversely correlated with that of glycolytic proteins. Notably, inhibiting the glutaminolysis pathway in cell lines with high GLDH and GLS1 expression proved effective in suppressing tumor growth.

Conclusions: Our findings confirm that glioblastoma tissues can be categorized into glycolytic-dominant and mitochondrial-dominant types, as previously reported. The mitochondrial-dominant type is also glutaminolysis-dominant. Therefore, inhibiting the glutaminolysis pathway may be an effective treatment for mitochondrial-dominant glioblastoma.

Keywords: Glioblastoma; Glutaminolysis; Metabolic changes; Mitochondria.


Conflict of interest statement

Declarations Ethics approval and consent to participate The use of glioblastoma tissues for this study was approved by the Ethics Committee of the Graduate School of Medical Sciences, Kyushu University, and Kagoshima University. Written informed consent was obtained by all patients. Consent for publication Not applicable. Competing interests The authors declare no competing interests.

Figures

Fig. 1
Fig. 1
Protein expression of the metabolic pathway of tumor tissue. a Schematic representation of the study showing the relationship between each enzyme and mitochondria. b Expression of proteins of the metabolic pathway in tumor tissue, including COX1, COX2, DRP1, HK2, SHMT2, GLS1, GLDH, and β-actin
Fig. 2
Fig. 2
Interaction between mitochondria and other pathway-related proteins. Mitochondria-related protein expression levels are correlated. a Correlation coefficient between each protein. The correlation values (r) are calculated using the Spearman method using GraphPad Prism version 9. b COX1 expression correlates with COX2 expression (r = 0.93). c COX1 expression correlates with DRP1 expression (r = 0.56). d COX2 expression correlates with DRP1 expression (r = 0.46). Mitochondria-related protein expression levels are inversely correlated with glycolytic protein expression levels. e COX1 expression tends to be inversely correlated with that of HK2 (r = -0.52). Mitochondria-related protein expression is not correlated with that of one-carbon metabolism proteins. f COX1 expression is not correlated with that of SHMT2 (r = -0.24). Mitochondria-related protein expression is correlated with that of glutaminolysis-related proteins. g COX1 expression is correlated with GLS1 (r = 0.76). h COX1 expression is correlated with GLDH (r = 0.65)
Fig. 3
Fig. 3
Protein expression of the metabolic pathway of tumor tissues (used as a validation set). Expression of mitochondria-related proteins is correlated with each other and with that of glutaminolysis proteins. a Proteins associated with metabolic pathways in tumor tissues include COX1, COX2, DRP1, HK2, SHMT2, GLS1, GLDH, and actin. b Correlation coefficient between each protein. The correlation values (r) are calculated using the Spearman method using GraphPad Prism version 9. c COX1 expression correlates with COX2 expression (r = 0.88). d COX1 expression correlates with DRP1 expression (r = 0.89). e COX1 expression correlates with GLS1 (r = 0.72). f COX1 expression tends to correlate with GLDH (r = 0.71)
Fig. 4
Fig. 4
Mass spectrometry analysis of the tumor sample comparing the correlation of glycolytic- and mitochondria-type tissue proteins with glutaminolysis protein levels under glucose starvation. a Schema of the differences between the sample with high expression of mitochondria-related proteins and the sample with low expression of mitochondria-related proteins using the PCA method. b One of the main metabolome compounds distinguishing between glycolytic- and mitochondria-type tissue using the sPLS-DA method. c Quantitative value of citric acid levels in each group (P < 0.05). Values are presented as the mean ± SD. The Mann–Whitney test was performed for comparison between the low group vs. the high group (*P < 0.05). dk Expression of mitochondrial and glutaminolysis proteins under different glucose concentrations. d expression of COX1, COX2, GLDH, and actin in U373. eg Quantification of COX1 (e), COX2 (f), and GLDH (g), normalized to the expression of β-actin (h). Expression of COX1, COX2, GLDH, and actin in KNS1451. i–k Quantification of COX1 (i), COX2 (j), and GLDH (k), normalized to the expression of β-actin. Values are presented as the mean ± SD. A Student’s t-test was performed to compare conditions of 100 vs. 4,500 mg/L of glucose. **P < 0.01; ***P < 0.001 ****P < 0.0001
Fig. 5
Fig. 5
Expression of glutaminolysis proteins (GLDH and GLS1) and the effectiveness of their inhibitors (GLDH and GLS1 inhibitors) in each cell line. a GLDH and GLS1 expressions in U87, LN229, U373, and T98G. b Quantification of GLDH expression, normalized to the expression of β-actin. c Quantification of GLS1 expression, normalized to the expression of β-actin. d Cell number (relative to control) following the administration of the 25 μM GLDH(R162) inhibitor for 72 h. e Cell number (relative to control) following the administration of the 12 μM GLS1(BPTES) inhibitor for 72 h. Values are presented as the mean ± SD. One-way ANOVA and Tukey’s multiple comparison tests were performed for comparisons between U87 vs. LN229, U373, and T98G. *P < 0.05, **P < 0.01; ***P < 0.001 ****P < 0.0001

References

    1. Stupp R, Mason WP, van den Bent MJ, Weller M, Fisher B, Taphoorn MJ, et al. Radiotherapy plus concomitant and adjuvant temozolomide for glioblastoma. N Engl J Med. 2005;352:987–96. - PubMed
    1. Bi J, Chowdhry S, Wu S, Zhang W, Masui K, Mischel PS. Altered cellular metabolism in gliomas - an emerging landscape of actionable co-dependency targets. Nat Rev Cancer. 2020;20:57–70. - PubMed
    1. Liu Y, Sun Y, Guo Y, Shi X, Chen X, Feng W, et al. An overview: the diversified role of mitochondria in cancer metabolism. Int J Biol Sci. 2023;19:897–915. - PMC - PubMed
    1. Faubert B, Solmonson A, DeBerardinis RJ. Metabolic reprogramming and cancer progression. Science. 2020;368:eaaw5473. - PMC - PubMed
    1. Pavlova NN, Zhu J, Thompson CB. The hallmarks of cancer metabolism: still emerging. Cell Metab. 2022;34:355–77. - PMC - PubMed

LinkOut - more resources