Review
. 2024 Nov 19;28(1):377.
doi: 10.1186/s13054-024-05173-x.

Electrical impedance tomography monitoring in adult ICU patients: state-of-the-art, recommendations for standardized acquisition, processing, and clinical use, and future directions

Affiliations
Review

Electrical impedance tomography monitoring in adult ICU patients: state-of-the-art, recommendations for standardized acquisition, processing, and clinical use, and future directions

Gaetano Scaramuzzo et al. Crit Care. .

Abstract

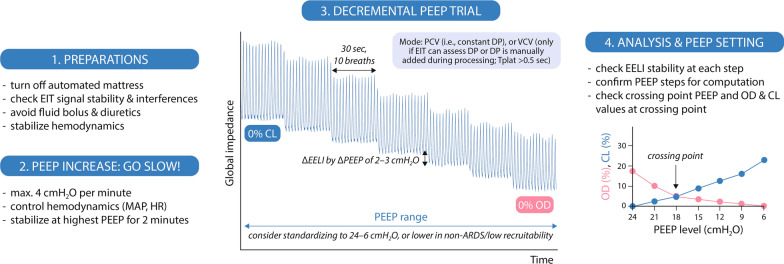
Electrical impedance tomography (EIT) is an emerging technology for the non-invasive monitoring of regional distribution of ventilation and perfusion, offering real-time and continuous data that can greatly enhance our understanding and management of various respiratory conditions and lung perfusion. Its application may be especially beneficial for critically ill mechanically ventilated patients. Despite its potential, clear evidence of clinical benefits is still lacking, in part due to a lack of standardization and transparent reporting, which is essential for ensuring reproducible research and enhancing the use of EIT for personalized mechanical ventilation. This report is the result of a four-day expert meeting where we aimed to promote the consistent and reliable use of EIT, facilitating its integration into both clinical practice and research, focusing on the adult intensive care patient. We discuss the state-of-the-art regarding EIT acquisition and processing, applications during controlled ventilation and spontaneous breathing, ventilation-perfusion assessment, and novel future directions.

Keywords: Electrical impedance tomography; Lung perfusion; Mechanical ventilation; Respiratory monitoring; Signal processing; Ventilation distribution.


Conflict of interest statement

Declarations Ethical approval and consent for participate Not applicable. Consent for publication Not applicable. Competing interests LSM is supported by a fellowship from the European Respiratory Society and a scholarship from Canadian Lung Society. SL has received EIT-related research funding under grant LE 817/40–1 (Project No. 422367304, paid to the institution) from German Research Foundation (DFG). AJ is supported by a personal grant from NWO (ZonMw Veni 2022, 09150162210061, paid to the institution) and has received research funding (paid to the institution) from Pulmotech B.V., Liberate Medical, Netherlands eScience Center and Health ~ Holland. All other authors declared that they have no competing interests.

Figures

Fig. 1
Fig. 1
EIT acquisition and best practices. Abbreviations: A.U., arbitrary units; EELI, end-expiratory lung impedance; EIT, electrical impedance tomography; US, ultrasound
Fig. 2
Fig. 2
EIT-based PEEP titration: step-by-step recommendations. The PEEP selection is generally made at the crossing point of the OD and CL curves; if the crossing point is between two PEEP levels, values are usually rounded up to the nearest integer. Abbreviations: ARDS, acute respiratory distress syndrome; DP, driving pressure; EELI, end-expiratory lung impedance; EIT, electrical impedance tomography; HR, heart rate; CL, lung collapse; MAP, mean arterial pressure; OD, overdistension, PEEP, positive end-expiratory pressure; PCV, pressure-controlled ventilation; Tplat, time (duration) of plateau pressure; VCV, volume-controlled ventilation
Fig. 3
Fig. 3
Illustration of ventilation-perfusion assessment by EIT. Waveforms and images from ref. [124] in a patient after pulmonary endarterectomy. A EIT waveforms before and during a NaCl bolus and apnea (38–50 s) in four lung quadrants. B Tidal ventilation image prior to the NaCl bolus and apnea. C Bolus-based perfusion image. The red/yellow indicate the conductivity change during the lung perfusion phase (at approximately 47 s) of the bolus. This is only in the left lung due to the patient’s perfusion defect. D Heart rate-filtered EIT image. E Relative EIT-V˙/Q image in the lung region of interest. The color scales used are shown using a log-scale such that 1 indicates mean equal perfusion and ventilation distribution. No consensus for EIT perfusion or V˙/Q color scales is available. Abbreviations: RV = right ventral, LV = left ventral, RD = right dorsal, LD = left dorsal

References

    1. Franchineau G, Jonkman AH, Piquilloud L, et al. Electrical impedance tomography to monitor hypoxemic respiratory failure. Am J Respir Crit Care Med. 2023. - PubMed
    1. Frerichs I, Amato MB, van Kaam AH, et al. Chest electrical impedance tomography examination, data analysis, terminology, clinical use and recommendations: consensus statement of the TRanslational EIT developmeNt stuDy group. Thorax. 2017;72(1):83–93. - PMC - PubMed
    1. Costa EL, Borges JB, Melo A, et al. Bedside estimation of recruitable alveolar collapse and hyperdistension by electrical impedance tomography. Intensive Care Med. 2009;35(6):1132–7. - PubMed
    1. Grieco DL, Delle Cese L, Menga LS, et al. Physiological effects of awake prone position in acute hypoxemic respiratory failure. Crit Care. 2023;27(1):315. - PMC - PubMed
    1. Jimenez JV, Weirauch AJ, Culter CA, et al. Electrical impedance tomography in acute respiratory distress syndrome management. Crit Care Med. 2022;50(8):1210–23. - PubMed

Publication types

MeSH terms

LinkOut - more resources