. 2018 Sep;2(9):10.1103/physrevmaterials.2.093801.
doi: 10.1103/physrevmaterials.2.093801.

Resolving interfacial charge transfer in titanate superlattices using resonant x-ray reflectometry

Affiliations

Resolving interfacial charge transfer in titanate superlattices using resonant x-ray reflectometry

R F Need et al. Phys Rev Mater. 2018 Sep.

Abstract

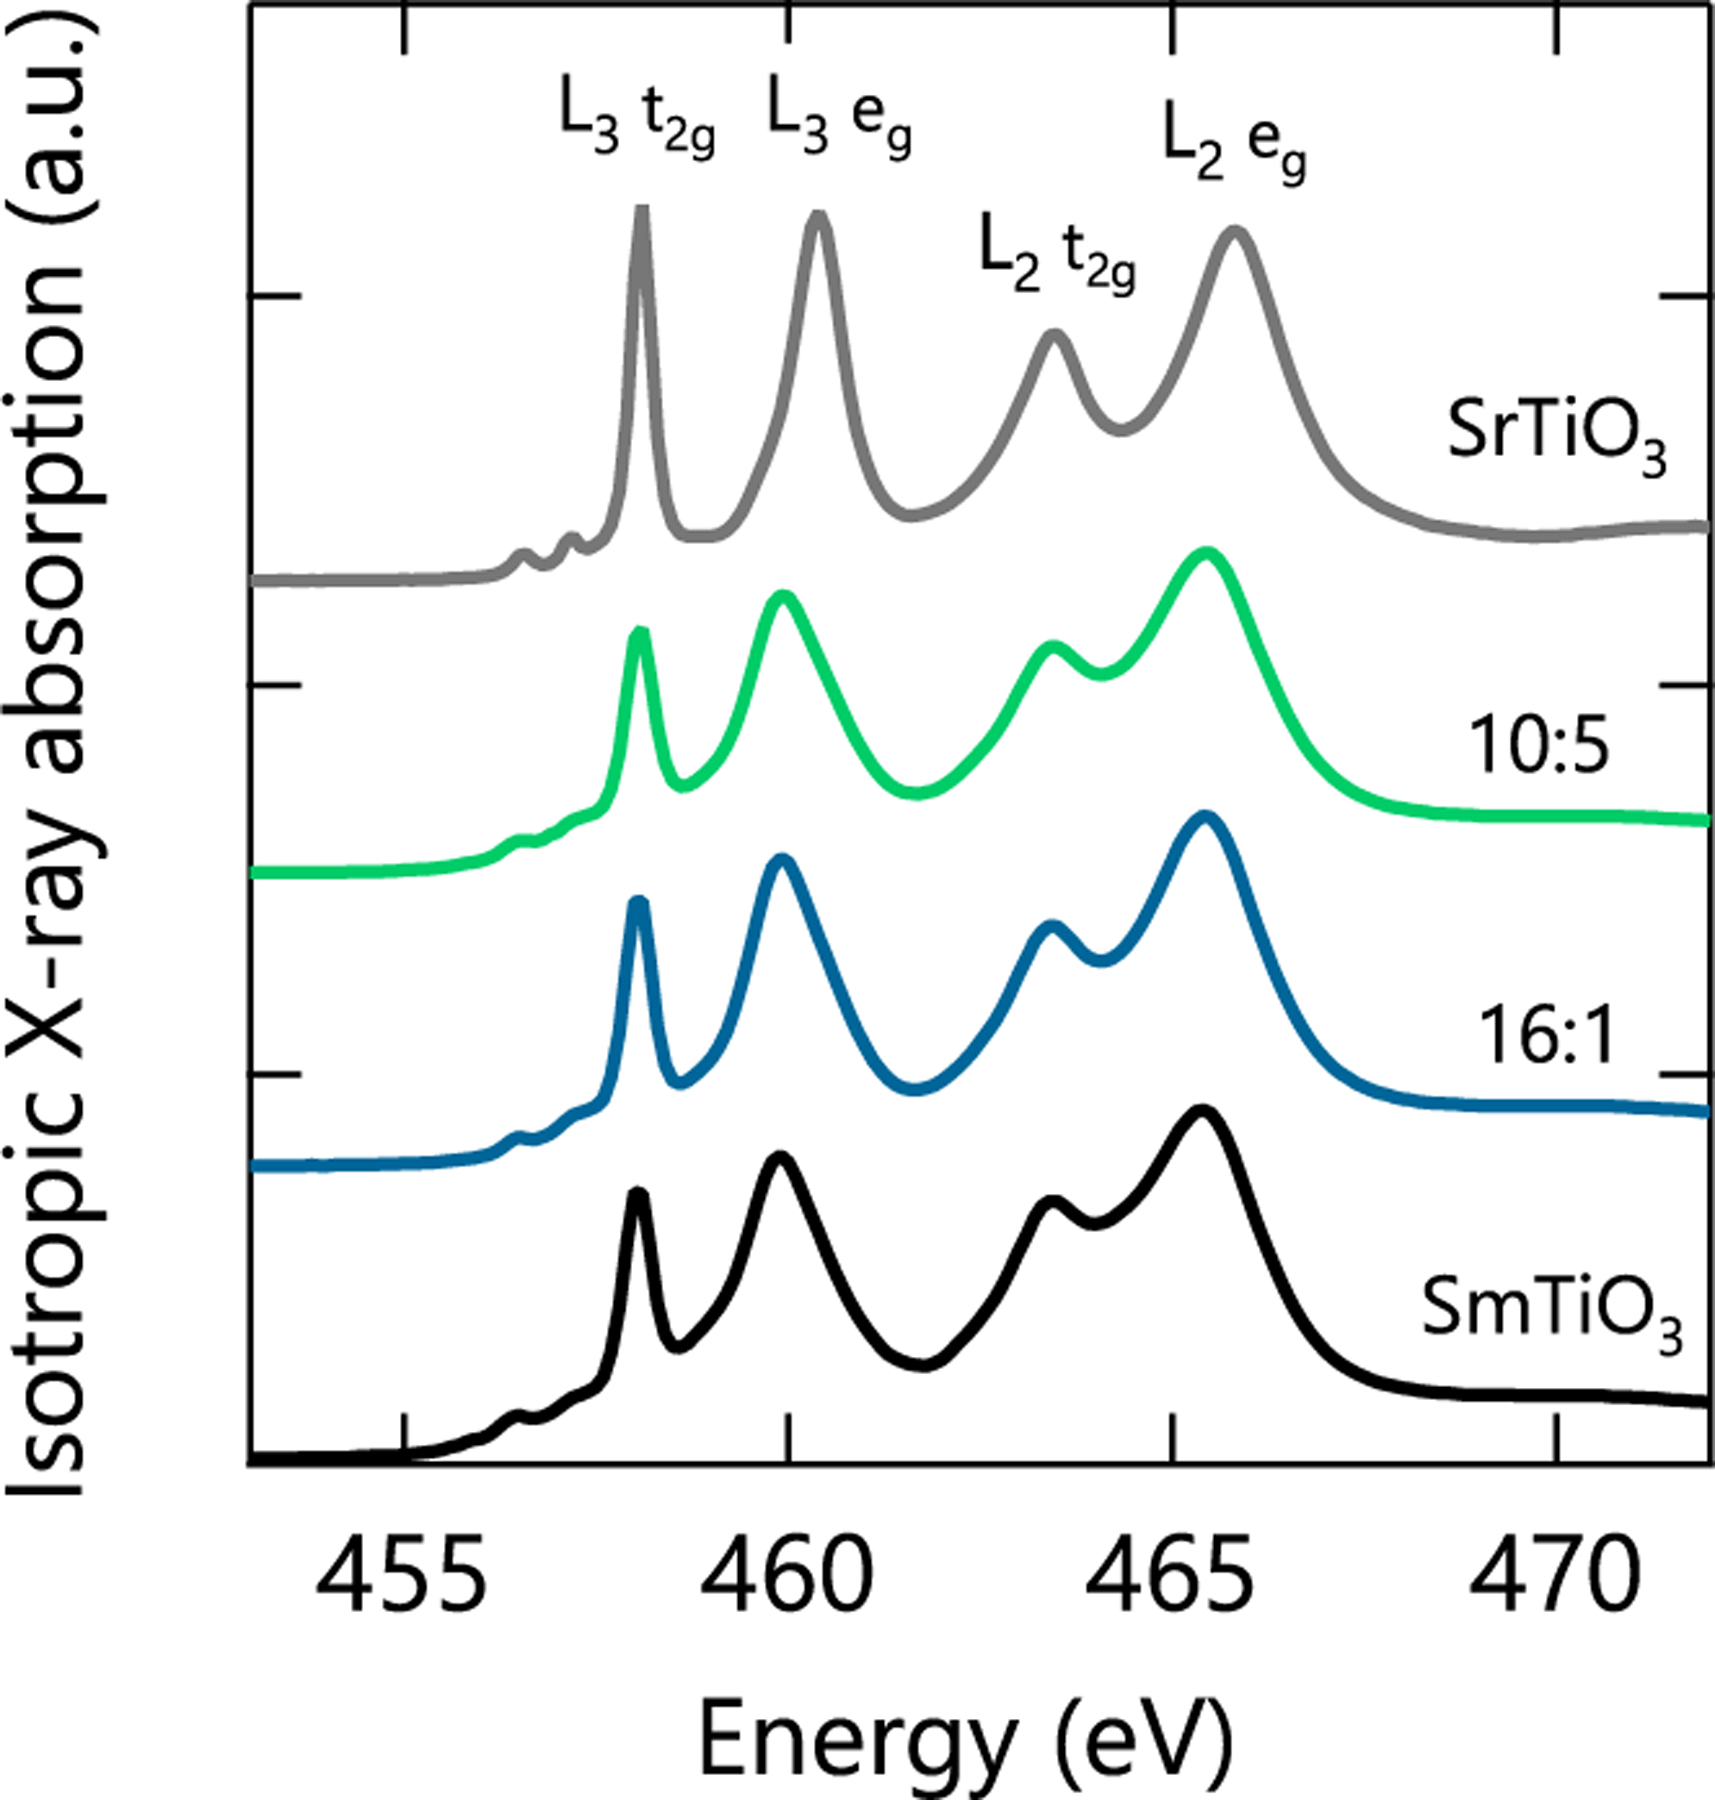
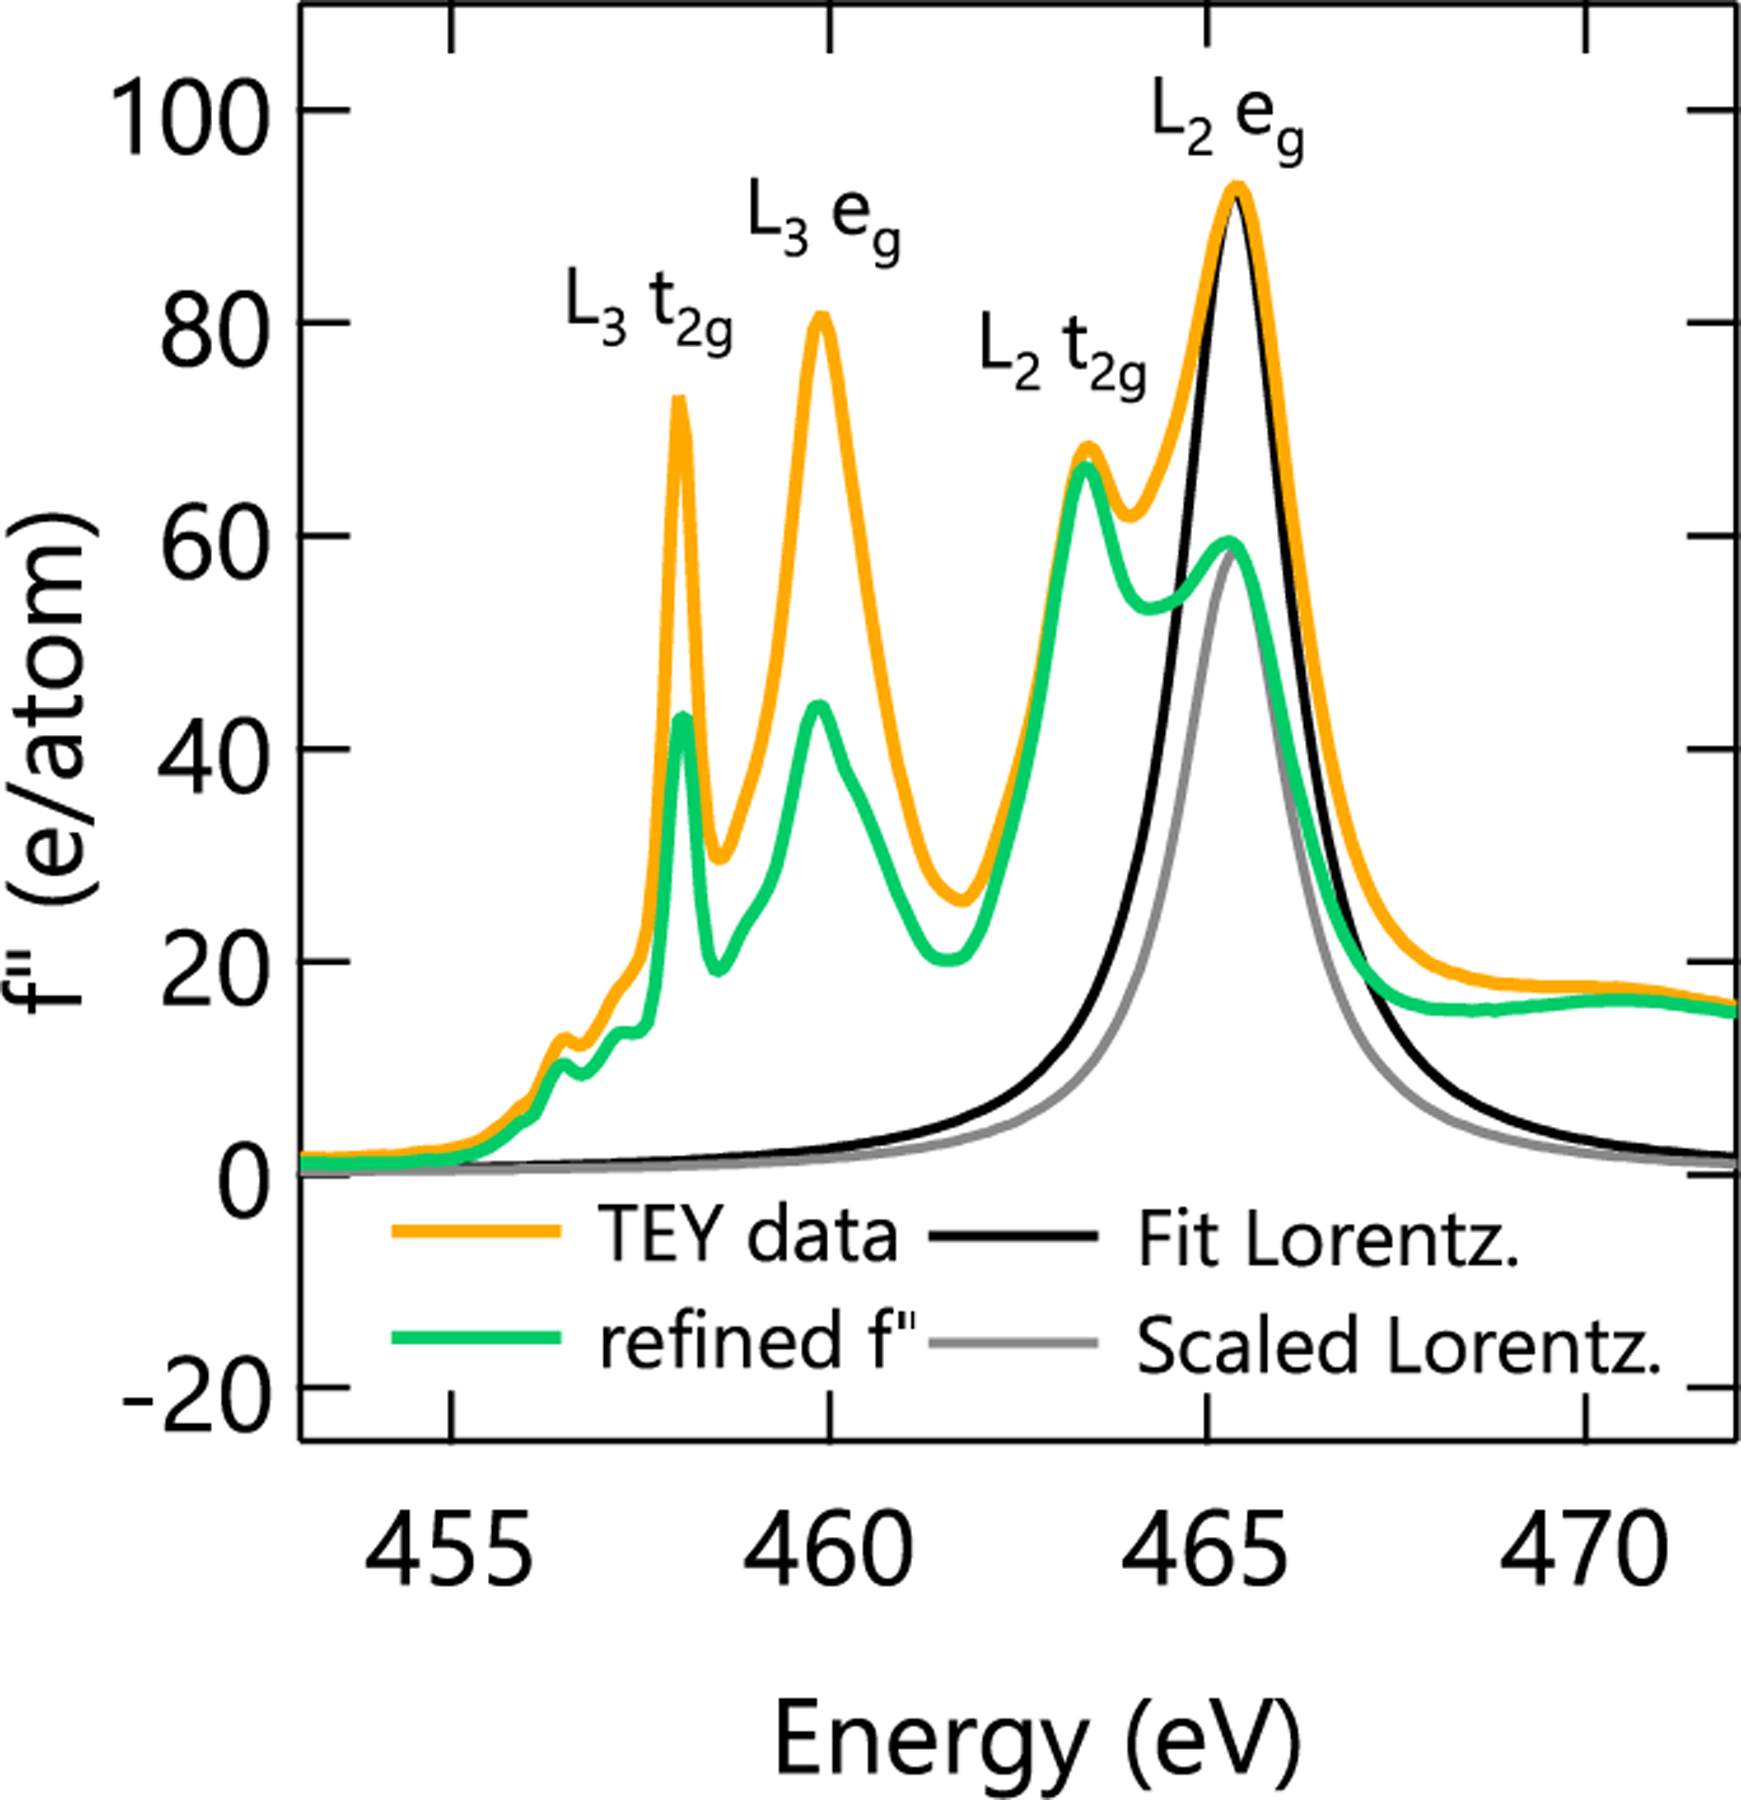
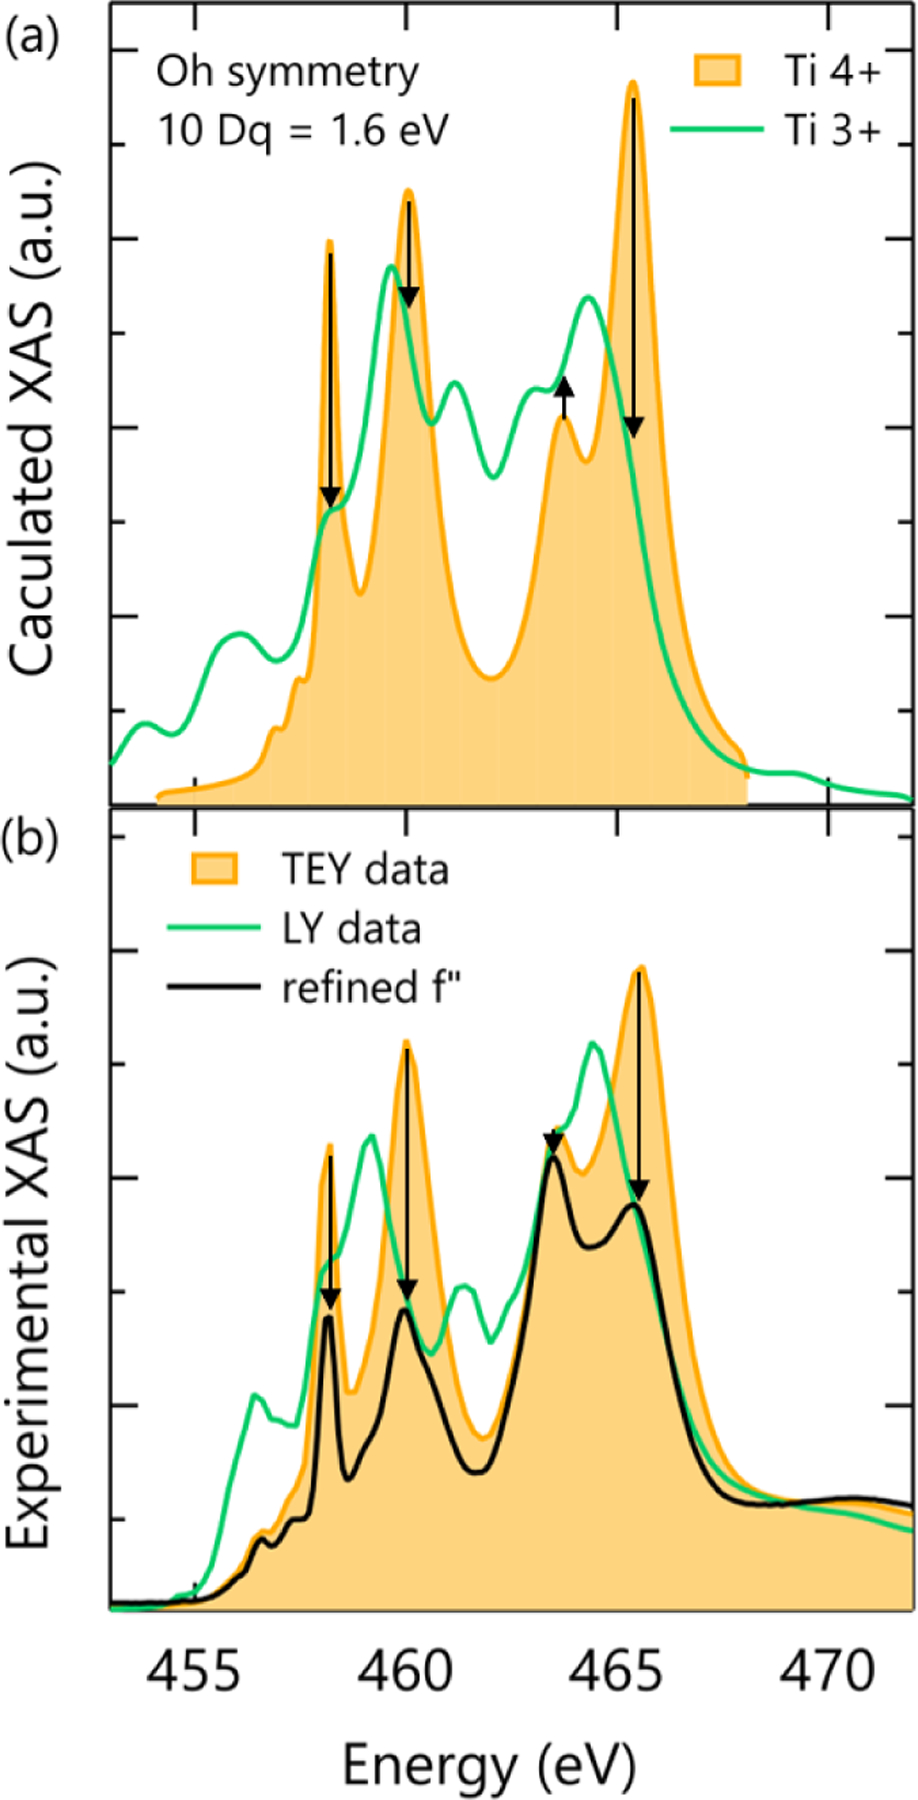
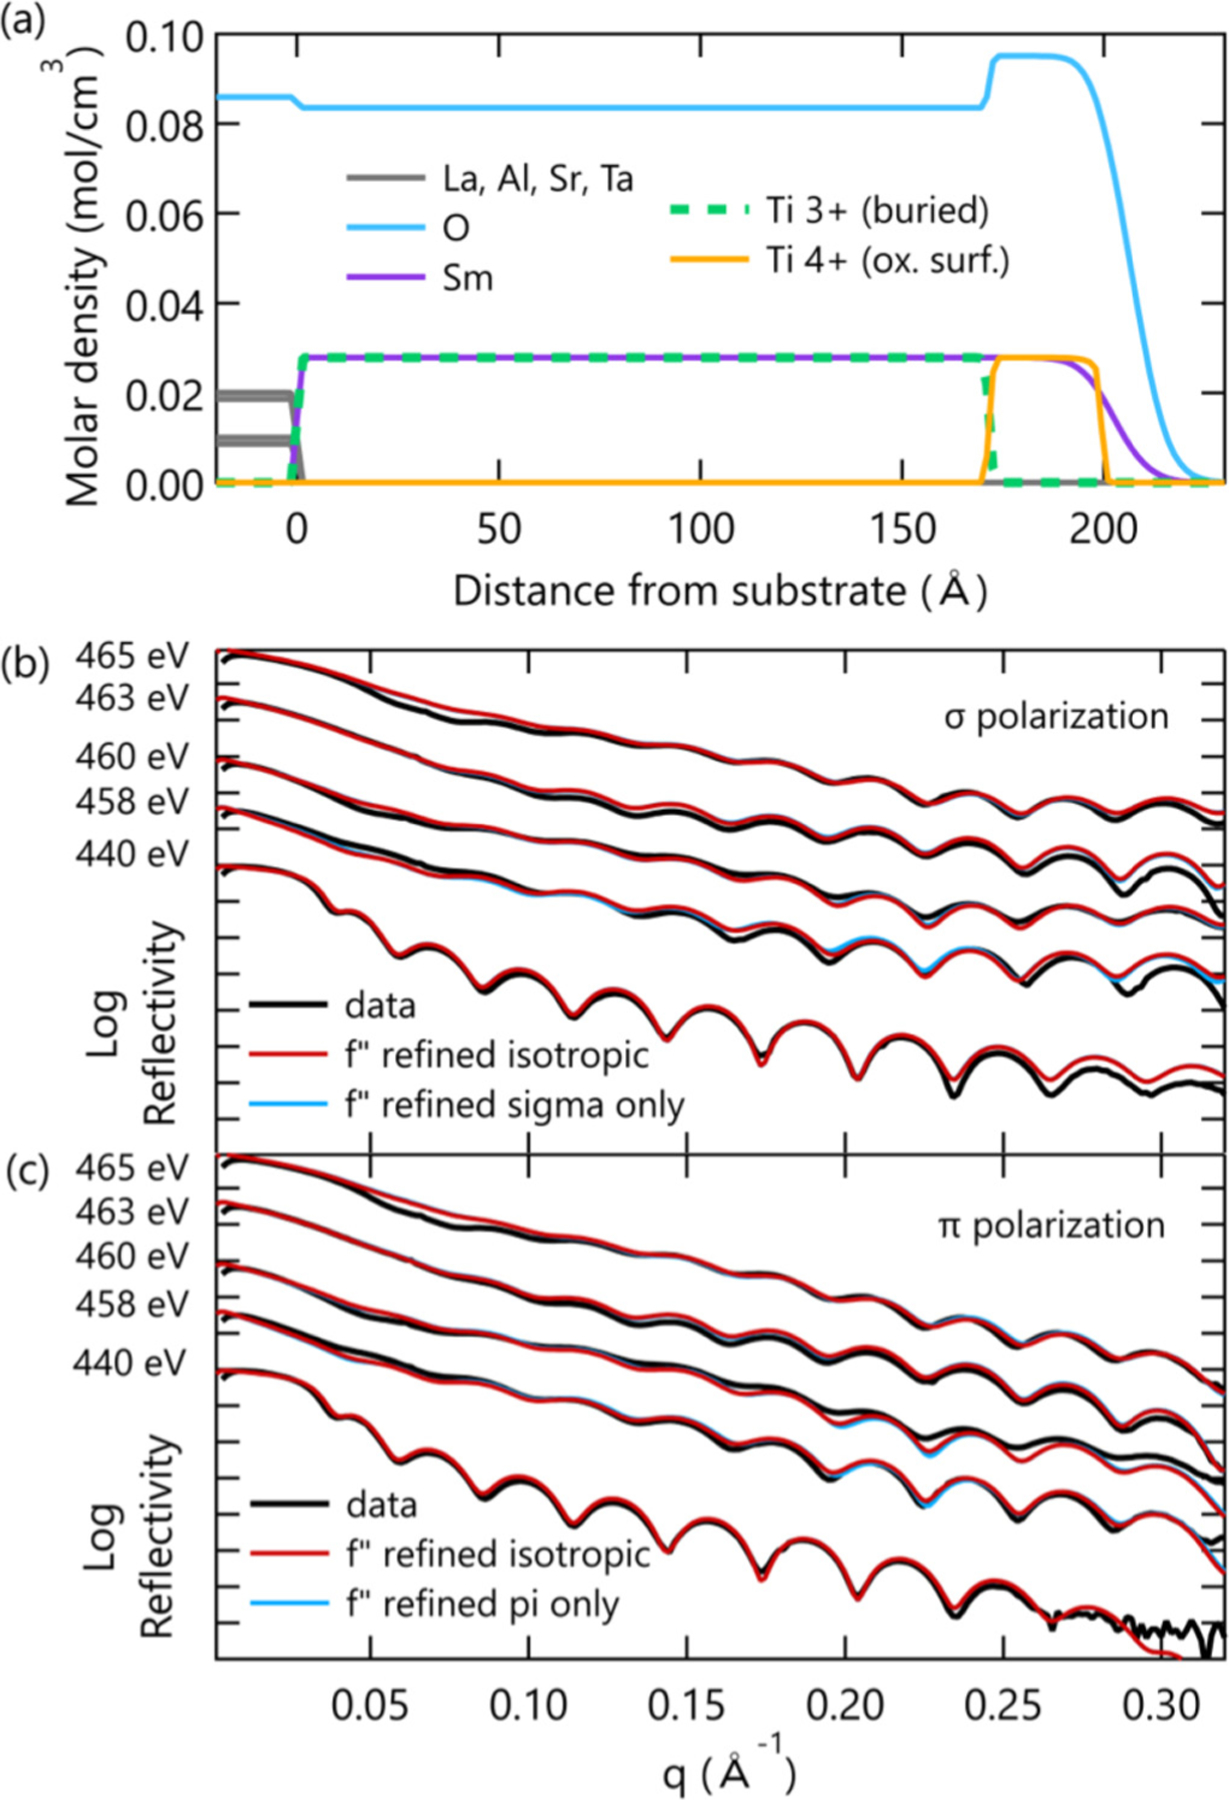
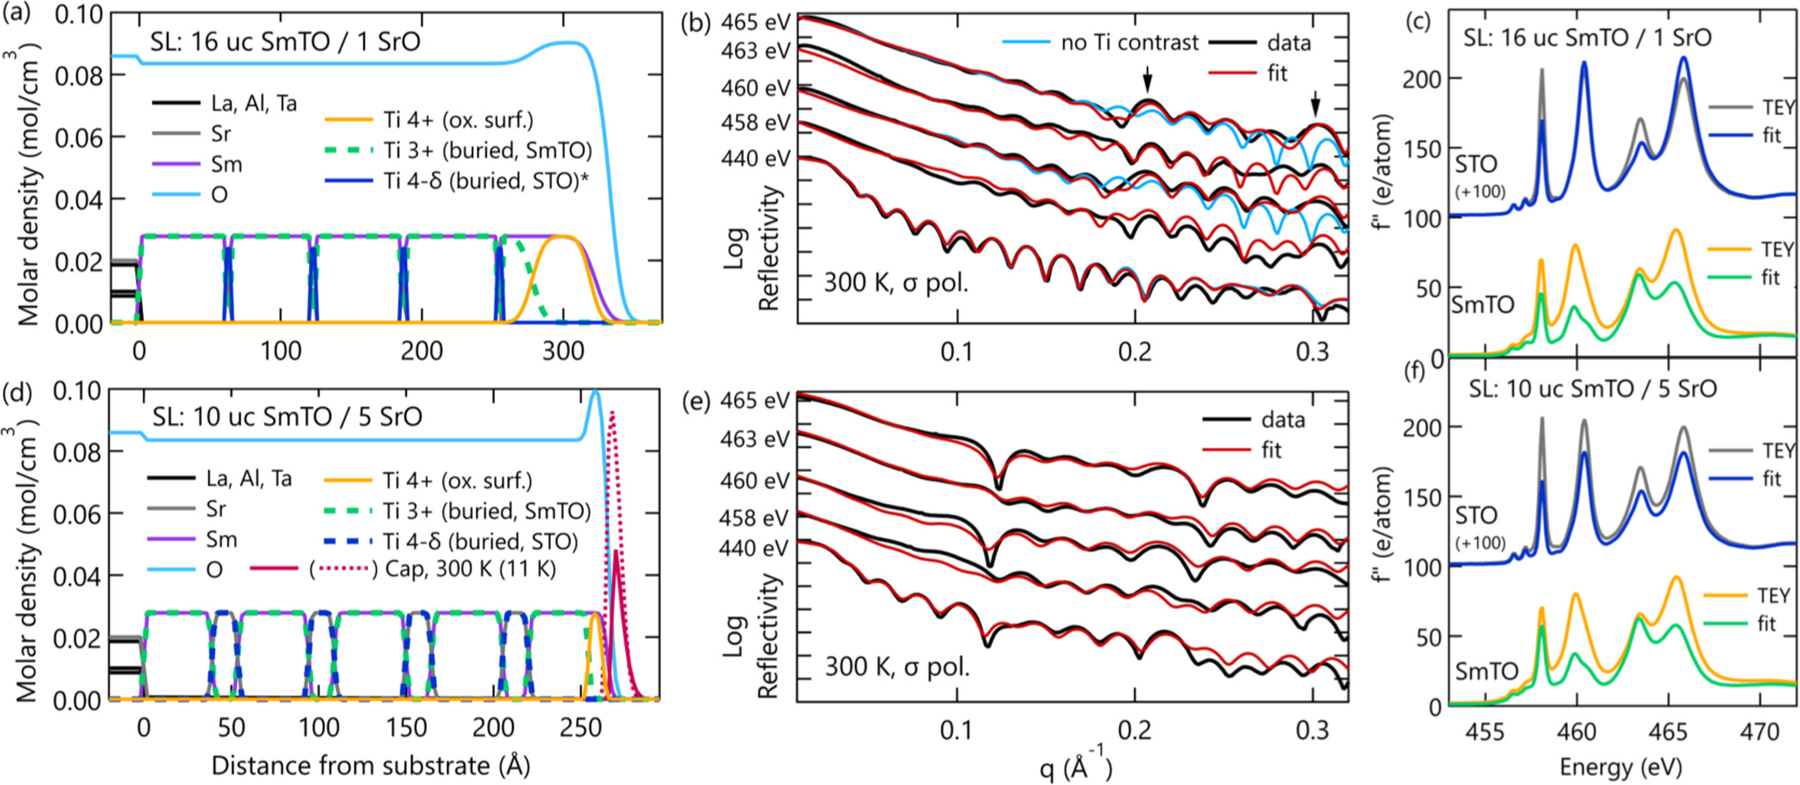
Charge transfer in oxide heterostructures can be tuned to promote emergent interfacial states, and accordingly, has been the subject of intense study in recent years. However, accessing the physics at these interfaces, which are often buried deep below the sample surface, remains difficult. Addressing this challenge requires techniques capable of measuring the local electronic structure with high-resolution depth dependence. Here, we used linearly polarized resonant x-ray reflectometry (RXR) as a means to visualize charge transfer in oxide superlattices with single unit cell precision. From our RXR measurements, we extract valence depth profiles of SmTiO3 (SmTO)/SrTiO3 (STO) heterostructures with STO quantum wells varying in thickness from five SrO planes down to a single SrO plane. At the polar-nonpolar SmTO/STO interface, an electrostatic discontinuity leads to approximately half an electron per areal unit cell transferred from the interfacial SmO layer into the neighboring STO quantum well. We observe this charge transfer as a suppression of the t 2g absorption peaks that minimizes contrast with the neighboring SmTO layers at those energies and leads to a pronounced absence of superlattice peaks in the reflectivity data. Our results demonstrate the sensitivity of RXR to electronic reconstruction in single unit cell layers, and establish RXR as a powerful means of characterizing charge transfer at buried oxide interfaces.


Figures

FIG. 1.
FIG. 1.
Isotropic TEY x-ray absorption spectra for a SmTO control film, STO substrate, and two SmTO/STO superlattices measured at 300 K. The labels X : Y correspond to the SmTO:STO layer architectures of the superlattices as described in the main text.
FIG. 2.
FIG. 2.
Measured TEY (yellow) and refined (green) spectra of the imaginary anomalous scattering factor for the SmTO control film. The fit (black) and scaled (grey) Lorentzian peaks are used to refine the measured XAS profile as described in the main text. Please note that, as described in the main text, the refined f′′ spectra are only accurate near the TEY peak energies where our reflectometry data were collected.
FIG. 3.
FIG. 3.
(a) Crystal field multiplet calculations for Ti4+ and Ti3+ ions in Oh symmetry made using the program CTM4XAS. (b) X-ray absorption spectra from the 20-nm SmTO control film measured in TEY (yellow) and LY (green) modes, which probe the oxidized surface and total film thickness, respectively, are compared to the fit f′′ spectra (black).
FIG. 4.
FIG. 4.
(a) Refined sample model showing the various elemental profiles including the oxidized Ti surface layer. (b) Sigma and (c) pi polarization reflectivity data and fits from the refined model, comparing models to scattering factor spectra that were refined under isotropic and anisotropic assumptions.
FIG. 5.
FIG. 5.
Results of reflectivity refinements for the two superlattice samples. Sample layer models (a) and (d) show each sample’s structure through the combination of multiple elemental depth profiles. The Ti profiles are plotted as dashed lines to show the Sm and Sr profiles that are directly overlapped by Ti. Note the exception of Ti4−δ in (a), which was left solid to clearly show the 1 SrO layers. Fits (red) to 300 K sigma reflectivity data (black) are plotted in panels (b) and (e). Also in panel (b) are the poor fits (light blue) from a comparative model without Ti contrast as described in the main text. Arrows point to superlattice peaks. Finally, the measured (grey and yellow) and refined (blue and green) f′′ spectra for the STO and SmTO layers are shown in panels (c) and (f) for the 16:1 and 10:5 superlattices, respectively. Please note that, as described in the main text, the refined f′′ spectra are only accurate near the TEY peak energies where our reflectometry data were collected.

Similar articles

References

    1. Mimura T, Hiyamizu S, Fujii T, and Nanbu K, Jpn. J. Appl. Phys 19, L225 (1980).
    1. Tsui DC, Stormer HL, and Gossard AC, Phys. Rev. Lett 48, 1559 (1982).
    1. Chambers SA, Adv. Mater 22, 219 (2010). - PubMed
    1. Boschker H and Mannhart J, Annu. Rev. Conden. Matter Phys 8, 145 (2017).
    1. Mannhart J and Schlom D, Science 327, 1607 (2010). - PubMed

LinkOut - more resources