. 2024 Oct 16;27(11):111137.
doi: 10.1016/j.isci.2024.111137. eCollection 2024 Nov 15.

Dysfunctional bronchoalveolar effector memory CD8+ T cells in tuberculosis-exposed people living with antiretroviral-naïve HIV infection

Affiliations

Dysfunctional bronchoalveolar effector memory CD8+ T cells in tuberculosis-exposed people living with antiretroviral-naïve HIV infection

Maphe Mthembu et al. iScience. .

Abstract

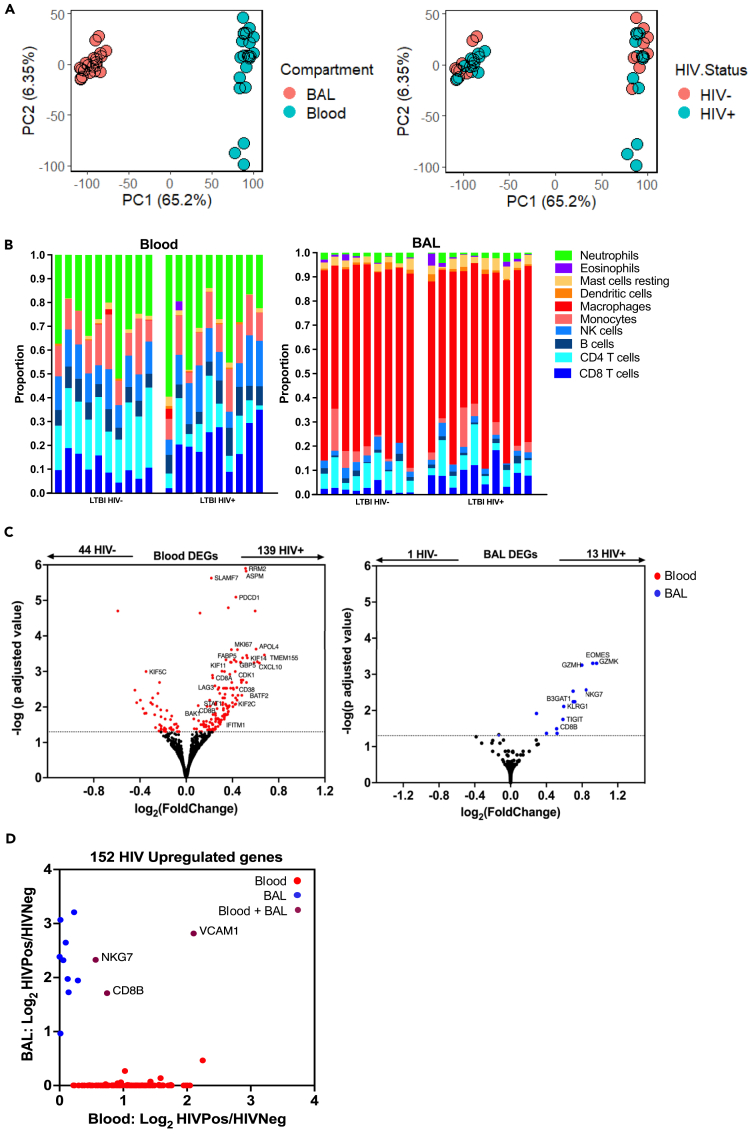
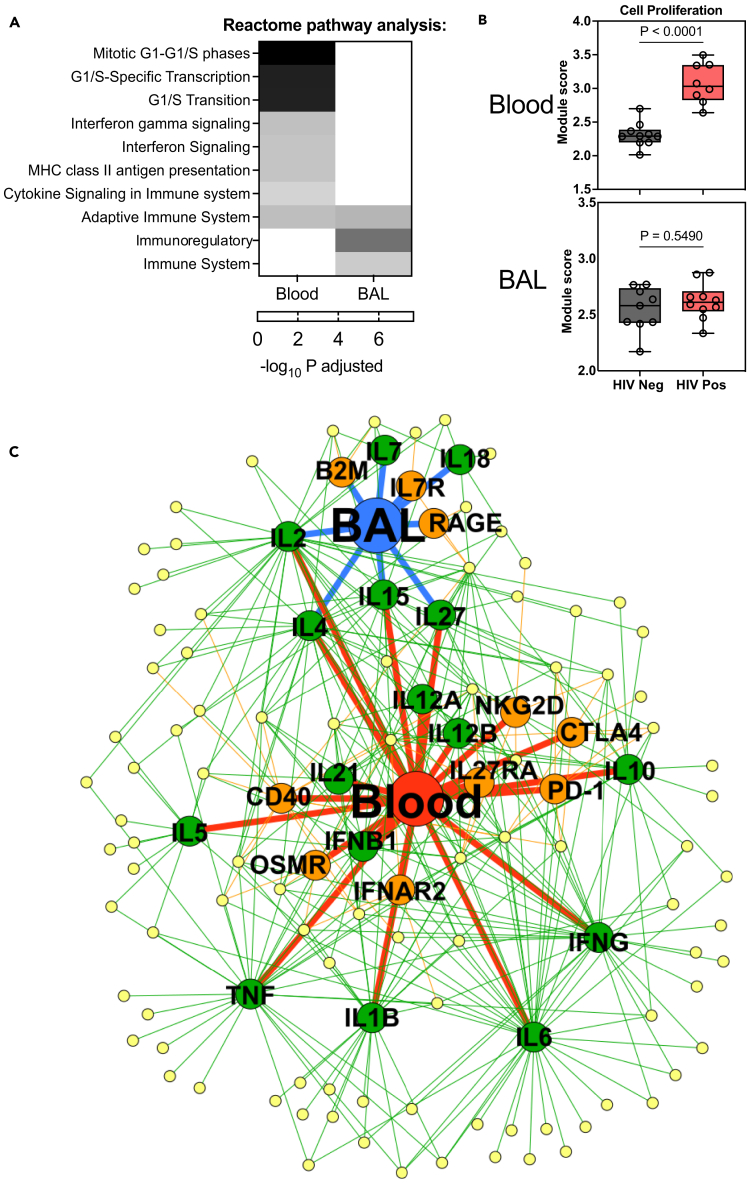
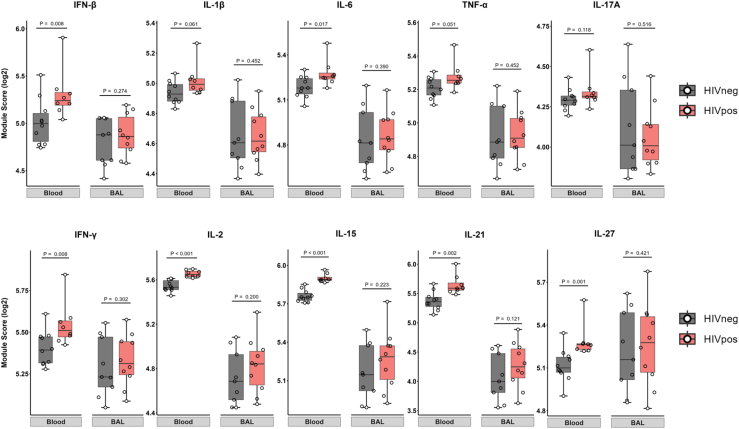
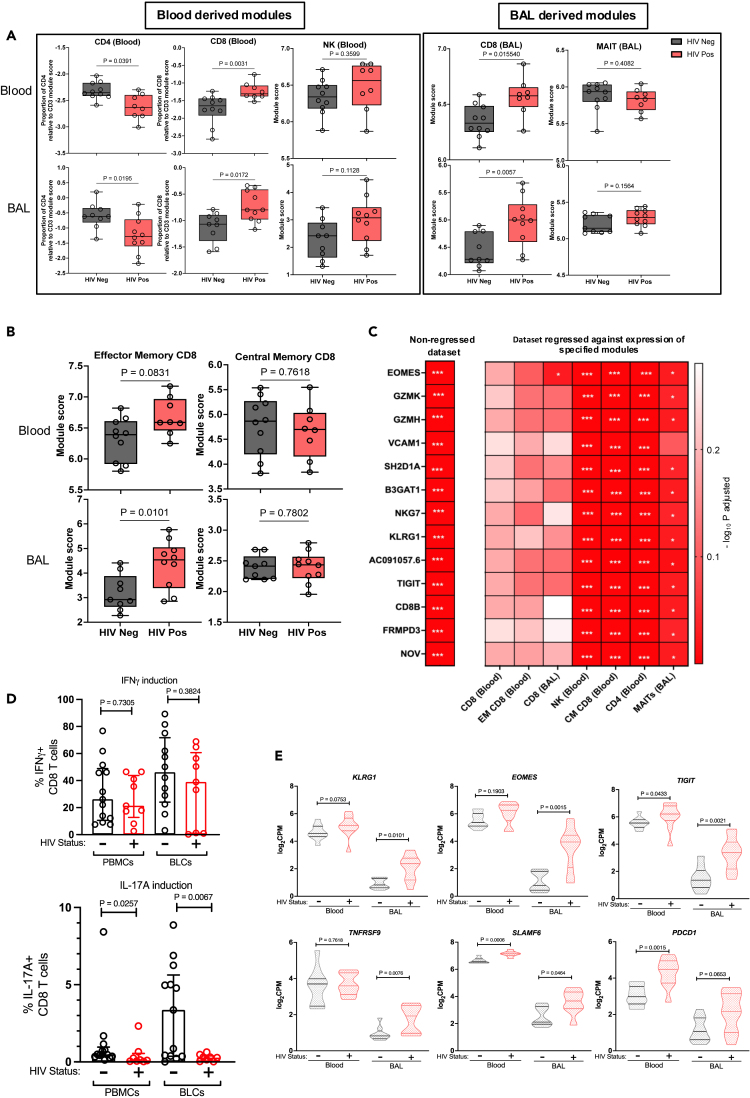
HIV causes susceptibility to respiratory pathogens, including tuberculosis (TB), but the underlying immunological mechanisms remain incompletely understood. We obtained whole blood and bronchoalveolar lavage (BAL) from TB-exposed people in the presence or absence of antiretroviral-naïve HIV co-infection. Bulk transcriptional profiling demonstrated compartment-specific enrichment of immunological processes. Systems-level deconvolution of whole blood from people living with HIV identified elevated type I and type II interferon cytokine activity and T cell proliferation. Transcriptional modules derived from both peripheral blood and sorted BAL immune cells demonstrated an increased frequency of effector memory CD8 T cells in whole BAL samples. Both compartments displayed reduced induction of CD8 T-cell-derived interleukin-17A (IL-17A) in people with HIV, associated with elevated T cell regulatory molecule expression. The data suggest that dysfunctional CD8 T cell responses in uncontrolled HIV may contribute to compromised respiratory immunity to pathogens, a process that could be modulated by host-directed therapies that target CD8 T cell effector functions.

Keywords: Immunology; Virology.


Conflict of interest statement

No conflicts of interest were reported by any of the co-authors.

Figures

None
Graphical abstract
Figure 1
Figure 1
HIV infection associated with different transcriptional profiles in blood compared to the bronchoalveolar space (A) Principal-component analyses of whole-genome level bulk transcriptomes, displaying PC1 and PC2, stratified on the left by compartment (blood or bronchoalveolar [BAL]) and on the right by the presence or absence of HIV infection (n = 20, HIV-negative [10] and HIV-positive [10]). (B) Relative proportions of major immune cell types in blood (left) and BAL (right) compartments per participant (columns), stratified by HIV status. (C) Whole-genome differential gene expression transcriptional analysis from blood and BAL samples; volcano plots indicate genes with significantly elevated expression (p adjusted <0.05) in HIV infection in blood (red) and BAL (blue) compartments. (D) Dot plot of genes with elevated expression in blood and BAL compartments of people with HIV. Colors represent genes showing elevated expression only in blood (red), only in BAL (blue), or in both compartments (magenta).
Figure 2
Figure 2
Systems-level dysregulation of immune responses associated with HIV infection in blood and the bronchoalveolar compartment (A) Heatmap showing REACTOME pathway enrichment (white: lowest to black: highest) in the transcriptome in blood (left column) and BAL (right column) samples in PLWH compared to people without HIV. (B) Box (interquartile range) and Whisker (min and max) plot showing expression of T cell proliferation transcriptional response module in blood and BAL compartments in people with (red) and without (gray) HIV with the boxplots showing. (C) Network diagram depicting predicted upstream regulators of genes with increased expression in BAL or blood of PLWH. Yellow nodes represent genes with significantly greater expression in HIV+ compared to HIV− individuals in either BAL (blue node) or blood (red node). Green and orange nodes represent cytokines and transmembrane receptors, respectively, predicted to regulate the expression of genes in the yellow nodes. Edges depict relationship between upstream regulators and the compartments and the differentially expressed genes. IL, interleukin; IFN, interferon; TNF, tumor necrosis factor; OSM, oncostatin M; PD-1, programmed cell death 1; RAGE, receptor for advanced glycation end products; B2M, beta-2 microglobulin.
Figure 3
Figure 3
Differential cytokine activity in peripheral blood and BAL compartments associated with HIV infection Box (interquartile range) and whisker (min and max) plots showing expression in the bulk transcriptome of modules reflective of cytokine activity in blood and BAL, stratified by the presence (red) or absence (gray) of HIV infection. Statistical assessments were performed by Mann-Whitney U tests.
Figure 4
Figure 4
Bronchoalveolar compartment in HIV infection characterized by enrichment of effector memory CD8 T cells deficient in IL-17A production Box (interquartile range) and whisker (min and max) plot illustrating module expression in whole transcriptomics data from (A). Blood-derived (left) and BAL-derived (right) modules and (B) effector and central memory CD8 T cell modules. Statistical assessments were performed by Mann-Whitney U tests. (C) Heatmap representing differential expression of specified genes between PLWH and those without HIV in BAL before (left column) or after linear regression for the expression of specified immune cell transcriptional modules (right columns). p values quantified by Mann-Whitney U tests (red = most significant). ∗ <0.05, ∗∗ <0.005, and ∗∗∗ <0.0001. (D) Scatterplot with bars (median) and whiskers (interquartile range) displaying expression of intracellular IFN-γ (top row) and IL-17A (bottom row) by CD8 T cells following PMA-ionomycin stimulation of mononuclear cells from both blood and BAL (n = 30, 17 HIV-negative and 13-HIV positive). (E) Violin plots (lines = interquartile range and shape = density) showing multiple immune checkpoint markers transcriptional expression in blood and BAL (left and right, respectively) (n = 20, 10 HIV-negative and 10 HIV-positive). Statistical assessments were performed by Mann-Whitney U tests.

Update of

References

    1. World Health Organisation . 2020. Global Tuberculosis Report.
    1. Smit-McBride Z., Mattapallil J.J., McChesney M., Ferrick D., Dandekar S. Gastrointestinal T lymphocytes retain high potential for cytokine responses but have severe CD4(+) T-cell depletion at all stages of simian immunodeficiency virus infection compared to peripheral lymphocytes. J. Virol. 1998;72:6646–6656. - PMC - PubMed
    1. Hazenberg M.D., Otto S.A., van Benthem B.H.B., Roos M.T.L., Coutinho R.A., Lange J.M.A., Hamann D., Prins M., Miedema F. Persistent immune activation in HIV-1 infection is associated with progression to AIDS. AIDS. 2003;17:1881–1888. - PubMed
    1. Boasso A., Shearer G.M. Chronic innate immune activation as a cause of HIV-1 immunopathogenesis. Clin. Immunol. 2008;126:235–242. - PMC - PubMed
    1. Jambo K.C., Banda D.H., Afran L., Kankwatira A.M., Malamba R.D., Allain T.J., Gordon S.B., Heyderman R.S., Russell D.G., Mwandumba H.C. Asymptomatic HIV-infected individuals on antiretroviral therapy exhibit impaired lung CD4(+) T-cell responses to mycobacteria. Am. J. Respir. Crit. Care Med. 2014;190:938–947. - PMC - PubMed

LinkOut - more resources