. 2024 Oct 23;27(11):111241.
doi: 10.1016/j.isci.2024.111241. eCollection 2024 Nov 15.

Effects of hyperhomocysteinemia on follicular development and oocytes quality

Affiliations

Effects of hyperhomocysteinemia on follicular development and oocytes quality

Lu Wang et al. iScience. .

Abstract

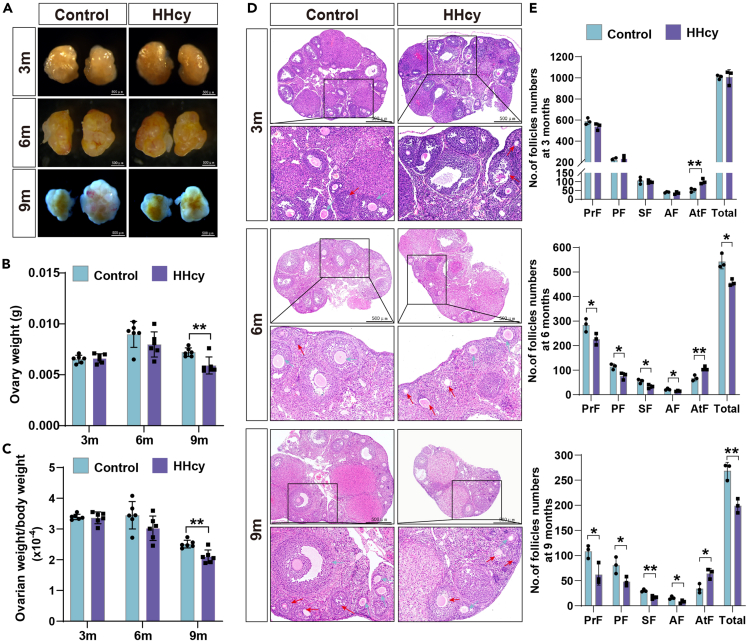
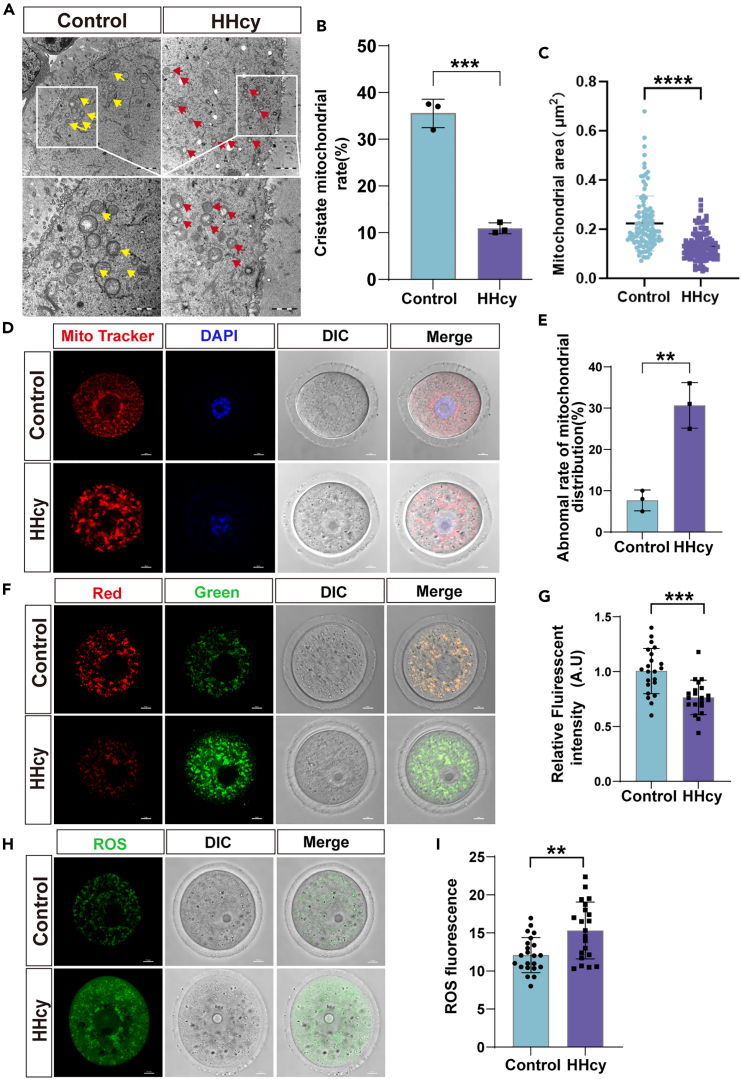
In patients with polycystic ovary syndrome (PCOS), the concentration of homocysteine (Hcy) in follicular fluid is inversely correlated with oocyte and embryo quality. Nevertheless, other metabolic abnormalities associated with PCOS may also impact oocyte and early embryo quality. Therefore, it remains uncertain whether reproductive function is affected in patients without PCOS with hyperhomocysteinemia (HHcy). Here, we observed reduced fertility, increased ovarian atretic follicles, and reduced oocyte maturation rates in HHcy mice. Proteomic analyses revealed that HHcy causes mitochondrial dysfunction and reduced expression of zona pellucida proteins (ZP1, ZP2, and ZP3) in oocytes. Transmission electron microscopy confirmed abnormal formation of the zona pellucida and microvilli in oocytes from HHcy mice. Additionally, in vitro fertilization (IVF) demonstrated a reduction in the rate of 2-cell embryo formation in HHcy mice. These findings reveal that HHcy reduces female reproductive longevity by affecting follicular development and oocyte quality.

Keywords: Health sciences; Medical specialty; Medicine.


Conflict of interest statement

The authors declare that they have no competing interests.

Figures

None
Graphical abstract
Figure 1
Figure 1
HHcy induced impaired sexual hormone disturbances and reduced fertility in female mice (A) Schematic illustrating the experimental design (ND: Normal diet, HMD: High-methionine diet). (B) Serum Hcy levels in mice (n = 6). (C) Curves of changes in the estrous cycle of female mice in the control and HHcy groups (n = 6) monitored continuously for 14 days. (D) Ratio of estrous cycle phases (n = 6). (E–I) The hormone levels of female mice (3 months) in estrus (n = 6.). (J) Mean cumulative pup numbers for Control (n = 10) and HHcy (n = 10) from 14 weeks to 13 months of age mated with young WT males. (K) Average number of pups per female per litter (n = 10). Statistical analysis was performed by Student’s t-test. Data are represented as mean ± SEM. ns, no significance, ∗p < 0.05, ∗∗p < 0.01, ∗∗∗∗p < 0.0001.
Figure 2
Figure 2
HHcy affects follicular development in female mice (A) Representative images of ovaries from female mice in 3m, 6m, 9m control, and HHcy groups. Scale bar, 500μm. (The ovarian tissue images of 9-month-old mice appear blue because they were captured using a different method. The ovarian tissues of 3- and 6-month-old mice were photographed under a microscope against black cardstock, while the 9-month-old ovarian tissues were photographed directly on the microscope stage). (B and C) Ovary weight, ovary weight/body weight of mice in 3M, 6M, 9M control, and HHcy groups (n = 6). (D) H&E staining results showing ovarian histology of Control and HHcy female mice at the indicated ages. Blue arrows indicate healthy follicles, and red arrows indicate atretic follicles. Scale bar, 500μm. (E) Mean number of primordial follicles (PrF), primary follicles (PF), secondary follicles (SF), antral follicles (AF), atretic follicles (AtF), and total follicles (Total) in the ovaries of control (n = 3) and HHcy female mice (n = 3). Statistical analysis was performed by Student’s t-test. Data are represented as mean ± SEM. ∗p < 0.05, ∗∗p < 0.01.
Figure 3
Figure 3
HHcy results in impaired oocyte maturation in mice (A) Representative images of 3-month-old control and HHcy group MII oocytes. Scale bar, 100μm. (B) The average number of ovulations in 3-month-old control and HHcy mice (n = 5). (C) Quantitative analysis of Pb1 extrusion rate in control and HHcy oocytes (n = 5). (D) Schematic diagram of the workflow for in vitro oocyte culture. (E) Bright-field images of control and HHcy group oocytes during in vitro culture maturation with arrows pointing to GV, GVBD, and Pb1 oocytes. Scale bar, 50μm. (F–H) GV oocyte acquisition and percentage of GVBD, Pb1(n = 3). Statistical analysis was performed by Student’s t-test. Data are represented as mean ± SEM. ns, no significance, ∗p < 0.05, ∗∗p < 0.01.
Figure 4
Figure 4
Proteomic analysis of mice ovarian tissue (A) Principal component analysis of protein expression patterns in Control and HHcy Groups (n = 3). (B and C) DEGs of control and HHcy mouse ovarian tissues through LC-MS/MS (Significantly (Fold Change, FC > 1.5) up- and down (Fold Change, FC < 1/1.5) -regulated. (D) Diagram of protein distribution among subcellular compartments. (E) GO annotation analysis of the identified proteins was performed using eggnog-mapper software (v2.1.6) based on the EggNOG database. (F) KEGG pathway enrichment analysis of control and HHcy group mouse ovary LC-MS/MS data. (G) Reactome pathway analysis of downregulated DEPs in control and HHcy group mouse ovary LC-MS/MS data.
Figure 5
Figure 5
HHcy affects mitochondrial function in oocytes (A) TEM images of oocytes in ovarian tissues (n = 3). Yellow arrows represent cristate mitochondria, and red arrows represent fuzzy mitochondrial cristae and vacuolated mitochondria. Scale bar, 1 μm. Scale for enlarging images, 2 μm. (B) The ratio of cristae mitochondria in control and HHcy oocytes was observed in TEM images (n = 3). (C) Mitochondrial area was calculated in control (n = 109) and HHcy (n = 117) group oocytes observed in TEM images. (D) Representative images of mitochondrial distribution in control and HHcy oocytes. Oocytes were stained with Mito Tracker Red to show mitochondria. Scale bar, 10 μm. (E) The abnormal rate of mitochondrial distribution was recorded in control and HHcy oocytes. (F) Representative images of JC-1 kit staining in control and HHcy groups oocytes. Scale bar, 10 μm. (G) The ratio of red to green fluorescence intensity was calculated in control (n = 22) and HHcy (n = 20) oocytes. (H) Representative images of DCFH-DA staining in control and HHcy groups. Scale bar, 10 μm. (I) Fluorescent intensity of ROS was analyzed in control (n = 23) and HHcy (n = 21) oocytes. Statistical analysis was performed by Student’s t-test. Data are represented as mean ± SEM. ∗∗p < 0.01, ∗∗∗p < 0.001, ∗∗∗∗p < 0.0001.
Figure 6
Figure 6
The expression of ZP proteins decreased in female mice with HHcy (A) Schematic representation of ZP production during oocyte growth in mice. (B) Masson staining for changes in the fibrils of follicular ZP at all levels in the ovaries of control and HHcy mice (n = 3). Arrows indicate the presence of fibrils: yellow arrows indicate the formation of normal ZP fibrils, and black arrows indicate abnormal formation of ZP fibrils. Scale for whole ovary image, 400μm. Scale for follicle images, 25μm. (C) Immunohistochemical detection of ZP2 and ZP3 protein expression in control and HHcy oocytes (n = 3). Arrow indicates the location of ZP. Scale for primary and secondary follicle images, 50μm. Scale for antral follicle images, 100μm. (D) Western blot probing with anti-ZP2 and anti-ZP3 of oocytes from control and HHcy female mice. (E) Quantitative analysis of ZP2 and ZP3 protein expression in control and HHcy groups. Statistical analysis was performed by Student’s t-test. Data are represented as mean ± SEM (n = 3). ∗p < 0.05.
Figure 7
Figure 7
Changes in oocyte ZP and microvilli (A, C, and E) TEM of oocyte ZP thickness and microvilli morphology in secondary, antral and preovulatory follicles. (i, ii are the localization and magnification of antral follicles selected for TEM observation of ZP and microvilli, respectively. iii, iiii are the TEM images of similar size antral follicles in the control and HHcy groups. The yellow dashed portion is the oocyte ZP. Yellow arrows indicate the normal microvilli morphology and density, and red arrows indicate the microvilli with abnormal morphology and density). Scale bar for i, 100μm. iii, Scale bar, 10μm. And iiii, Scale bar, 1μm. (B, D, and F) Oocyte ZP thickness in secondary, antral and preovulatory follicles (n = 3). (G) The density of oocyte microvilli in each follicle (n = 6). (H) The average length of oocyte microvilli in each follicle (n = 6). (I) Shown are representative brightfield images of zygote and 2-cell stage embryos. Blue arrows indicate normally developing embryos, red asterisks indicate cytoplasmic fragmentation, and yellow asterisks indicate unfertilized eggs or developmentally arrested embryos. Scale bar, 50 μm. (J) Percentage of 2-cell embryos (n = 3). Statistical analysis was performed by Student’s t-test. Data are represented as mean ± SEM. ∗p < 0.05, ∗∗p < 0.01.

References

    1. Tripathi M., Singh B.K., Zhou J., Tikno K., Widjaja A., Sandireddy R., Arul K., Abdul Ghani S.A.B., Bee G.G.B., Wong K.A., et al. Vitamin B(12) and folate decrease inflammation and fibrosis in NASH by preventing syntaxin 17 homocysteinylation. J. Hepatol. 2022;77:1246–1255. doi: 10.1016/j.jhep.2022.06.033. - DOI - PubMed
    1. Hou N., Chen S., Chen F., Jiang M., Zhang J., Yang Y., Zhu B., Bai X., Hu Y., Huang H., Xu C. Association between premature ovarian failure, polymorphisms in MTHFR and MTRR genes and serum homocysteine concentration. Reprod. Biomed. Online. 2016;32:407–413. doi: 10.1016/j.rbmo.2016.01.009. - DOI - PubMed
    1. Moll S., Varga E.A. Homocysteine and MTHFR Mutations. Circulation. 2015;132:e6–e9. doi: 10.1161/circulationaha.114.013311. - DOI - PubMed
    1. Michels K.A., Wactawski-Wende J., Mills J.L., Schliep K.C., Gaskins A.J., Yeung E.H., Kim K., Plowden T.C., Sjaarda L.A., Chaljub E.N., Mumford S.L. Folate, homocysteine and the ovarian cycle among healthy regularly menstruating women. Hum. Reprod. 2017;32:1743–1750. doi: 10.1093/humrep/dex233. - DOI - PMC - PubMed
    1. Vujkovic M., de Vries J.H., Dohle G.R., Bonsel G.J., Lindemans J., Macklon N.S., van der Spek P.J., Steegers E.A.P., Steegers-Theunissen R.P.M. Associations between dietary patterns and semen quality in men undergoing IVF/ICSI treatment. Hum. Reprod. 2009;24:1304–1312. doi: 10.1093/humrep/dep024. - DOI - PubMed

LinkOut - more resources