

Deep-learning-driven optical coherence tomography analysis for cardiovascular outcome prediction in patients with acute coronary syndrome
- PMID: 39563910
- PMCID: PMC11570387
- DOI: 10.1093/ehjdh/ztae067
Deep-learning-driven optical coherence tomography analysis for cardiovascular outcome prediction in patients with acute coronary syndrome
Abstract
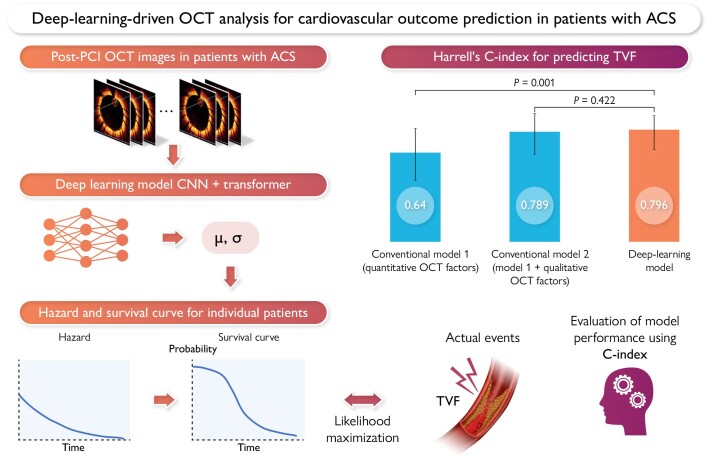
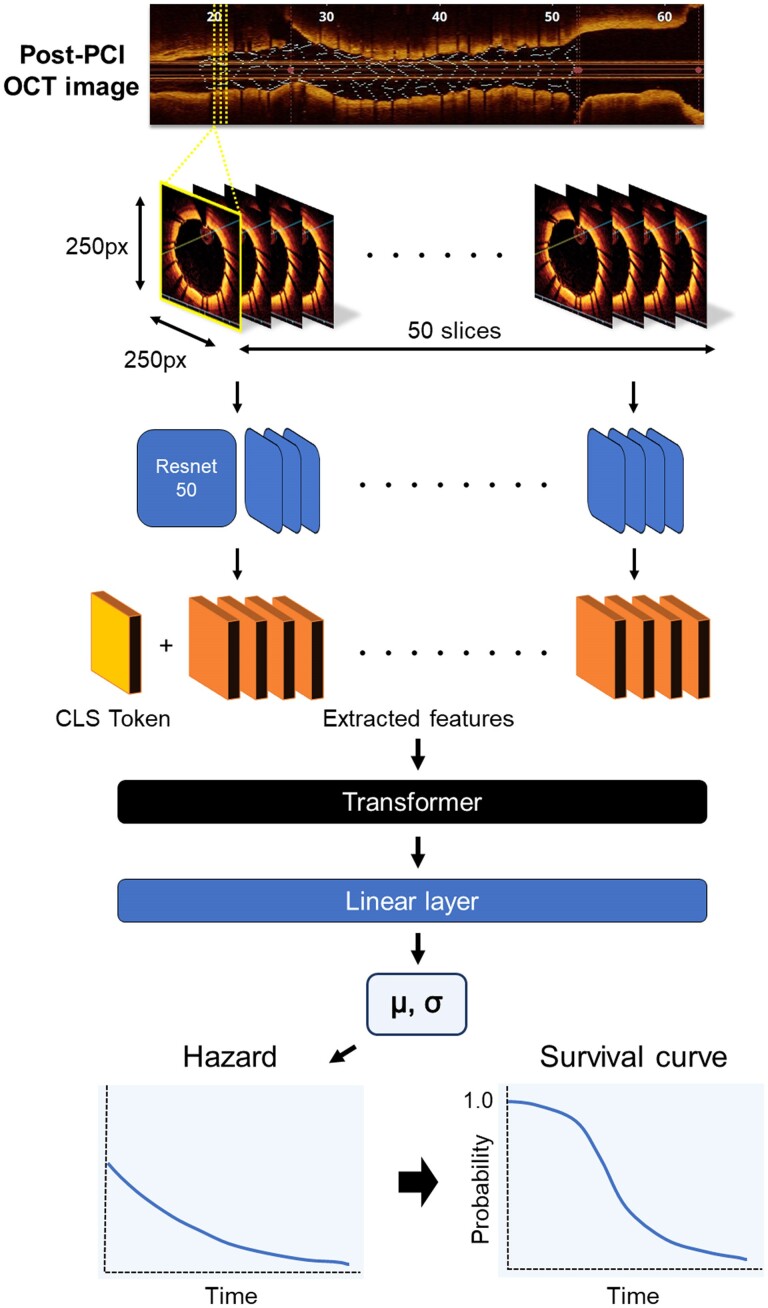
Aims: Optical coherence tomography (OCT) can identify high-risk plaques indicative of worsening prognosis in patients with acute coronary syndrome (ACS). However, manual OCT analysis has several limitations. In this study, we aim to construct a deep-learning model capable of automatically predicting ACS prognosis from patient OCT images following percutaneous coronary intervention (PCI).
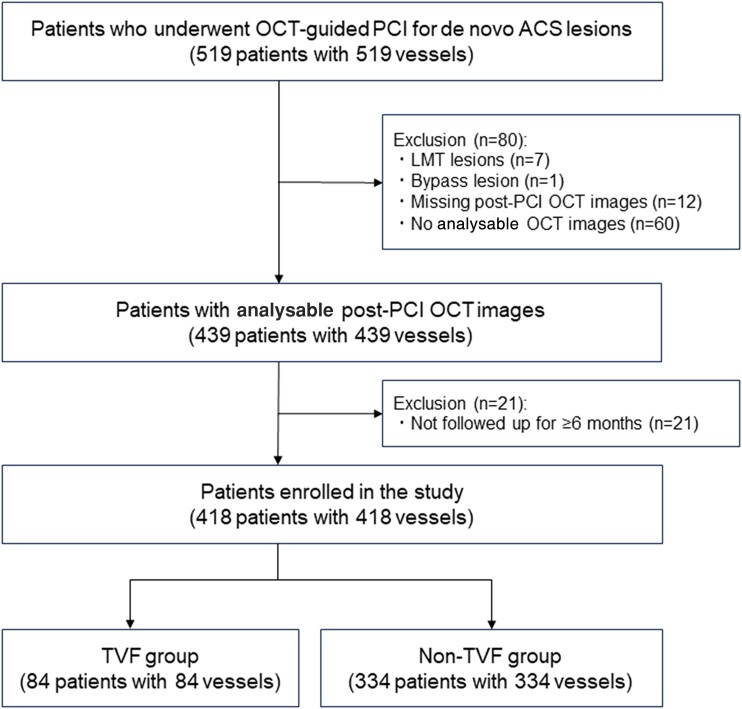
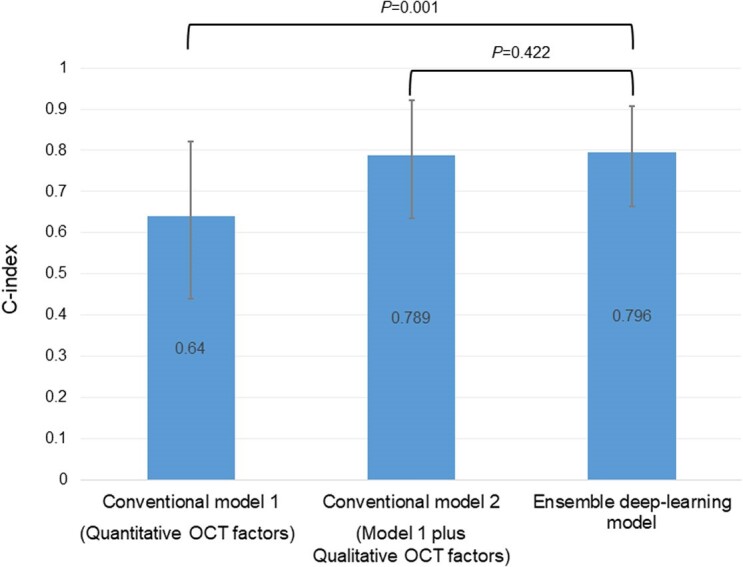
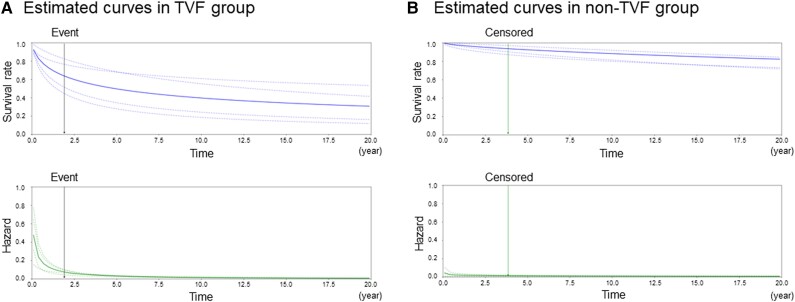
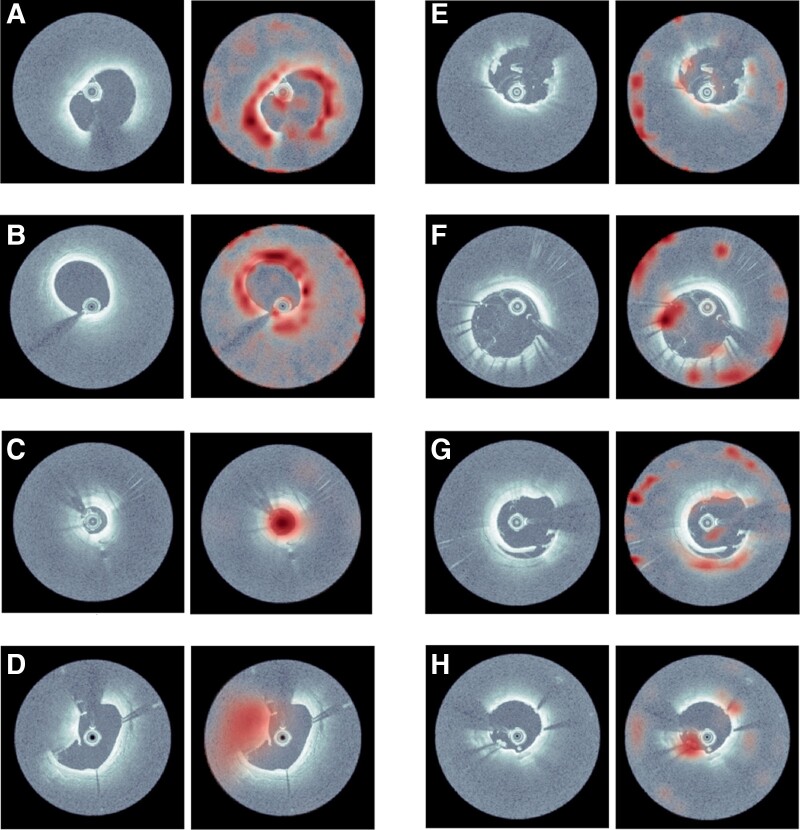
Methods and results: Post-PCI OCT images from 418 patients with ACS were input into a deep-learning model comprising a convolutional neural network (CNN) and transformer. The primary endpoint was target vessel failure (TVF). Model performances were evaluated using Harrell's C-index and compared against conventional models based on human observation of quantitative (minimum lumen area, minimum stent area, average reference lumen area, stent expansion ratio, and lesion length) and qualitative (irregular protrusion, stent thrombus, malapposition, major stent edge dissection, and thin-cap fibroatheroma) factors. GradCAM activation maps were created after extracting attention layers by using the transformer architecture. A total of 60 patients experienced TVF during follow-up (median 961 days). The C-index for predicting TVF was 0.796 in the deep-learning model, which was significantly higher than that of the conventional model comprising only quantitative factors (C-index: 0.640) and comparable to that of the conventional model, including both quantitative and qualitative factors (C-index: 0.789). GradCAM heat maps revealed high activation corresponding to well-known high-risk OCT features.
Conclusion: The CNN and transformer-based deep-learning model enabled fully automatic prognostic prediction in patients with ACS, with a predictive ability comparable to a conventional survival model using manual human analysis.
Clinical trial registration: The study was registered in the University Hospital Medical Information Network Clinical Trial Registry (UMIN000049237).
Keywords: Acute coronary syndrome; Deep learning; Optical coherence tomography; Survival model.
© The Author(s) 2024. Published by Oxford University Press on behalf of the European Society of Cardiology.
Conflict of interest statement
Conflict of interest: none declared.
Figures
References
-
- Stone GW, Maehara A, Lansky AJ, De Bruyne B, Cristea E, Mintz GS, et al. A prospective natural-history study of coronary atherosclerosis. N Engl J Med 2011;364:226–235. - PubMed
-
- Erlinge D, Maehara A, Ben-Yehuda O, Bøtker HE, Maeng M, Kjøller-Hansen L, et al. Identification of vulnerable plaques and patients by intracoronary near-infrared spectroscopy and ultrasound (PROSPECT II): a prospective natural history study. Lancet 2021;397:985–995. - PubMed
-
- Patwari P, Weissman NJ, Boppart SA, Jesser C, Stamper D, Fujimoto JG, et al. Assessment of coronary plaque with optical coherence tomography and high-frequency ultrasound. Am J Cardiol 2000;85:641–644. - PubMed
-
- Kakizaki S, Otake H, Seike F, Kawamori H, Toba T, Nakano S, et al. Optical coherence tomography fractional flow reserve and cardiovascular outcomes in patients with acute coronary syndrome. JACC Cardiovasc Interv 2022;15:2035–2048. - PubMed
LinkOut - more resources
Full Text Sources
Miscellaneous